4883
Differential diagnosis of multiple sclerosis based on the central vein sign assessment using deep learning: a multicentre study.1Advanced Clinical Imaging Technology, Siemens Healthcare AG, Lausanne, Switzerland, 2Department of Radiology, Centre Hospitalier Universitaire Vaudois (CHUV) and University of Lausanne (UNIL), Lausanne, Switzerland, 3Signal Processing Laboratory (LTS 5), Ecole Polytechnique Fédérale de Lausanne (EPFL), Lausanne, Switzerland, 4Departement of Neurology, Centre Hospitalier Universitaire Vaudois (CHUV) and University of Lausanne (UNIL), Lausanne, Switzerland, 5Translational Neuroradiology Section, National Institute of Neurological Disorders and Stroke, National Institutes of Health (NIH), Bethesda, MD, United States, 6Neurologic Clinic and Policlinic, Departments of Medicine, Clinical Research and Biomedical Engineering, University Hospital Basel and University of Basel, Basel, Switzerland, 7Translational Imaging in Neurology (ThINk) Basel, Department of Medicine and Biomedical Engineering, University Hospital Basel and University of Basel, Basel, Switzerland, 8Medical Image Analysis Laboratory (MIAL), Centre d'Imagerie BioMédicale (CIBM), Lausanne, Switzerland
Synopsis
Prospective multicentre studies are needed to establish the clinical value of the central vein sign for diagnosis of multiple sclerosis. This type of studies requires manual segmentation and classification of lesions with and without the central vein sign, which are time-consuming tasks. In this work, we evaluate the performance of an in-house deep-learning-based prototype algorithm for automated assessment of the central vein sign using data from two different healthcare units.
Introduction
Recently, prospective studies have shown that the central vein sign (CVS) in brain lesions is a biomarker that differentiates multiple sclerosis (MS) from other MS-mimics1,2,3. However, due to the lack of larger prospective multicentre trials, its clinical value is not yet established4. The tedious manual segmentation and classification of this type of lesions5 is the main reason that prevents or delays the development of these studies. Here, we evaluate the performance of a deep-learning-based tool that automatically classifies lesions with (L+) and without (L-) CVS6. The evaluation was carried out using MS and MS-mimic subjects from two different healthcare units.Material and Methods
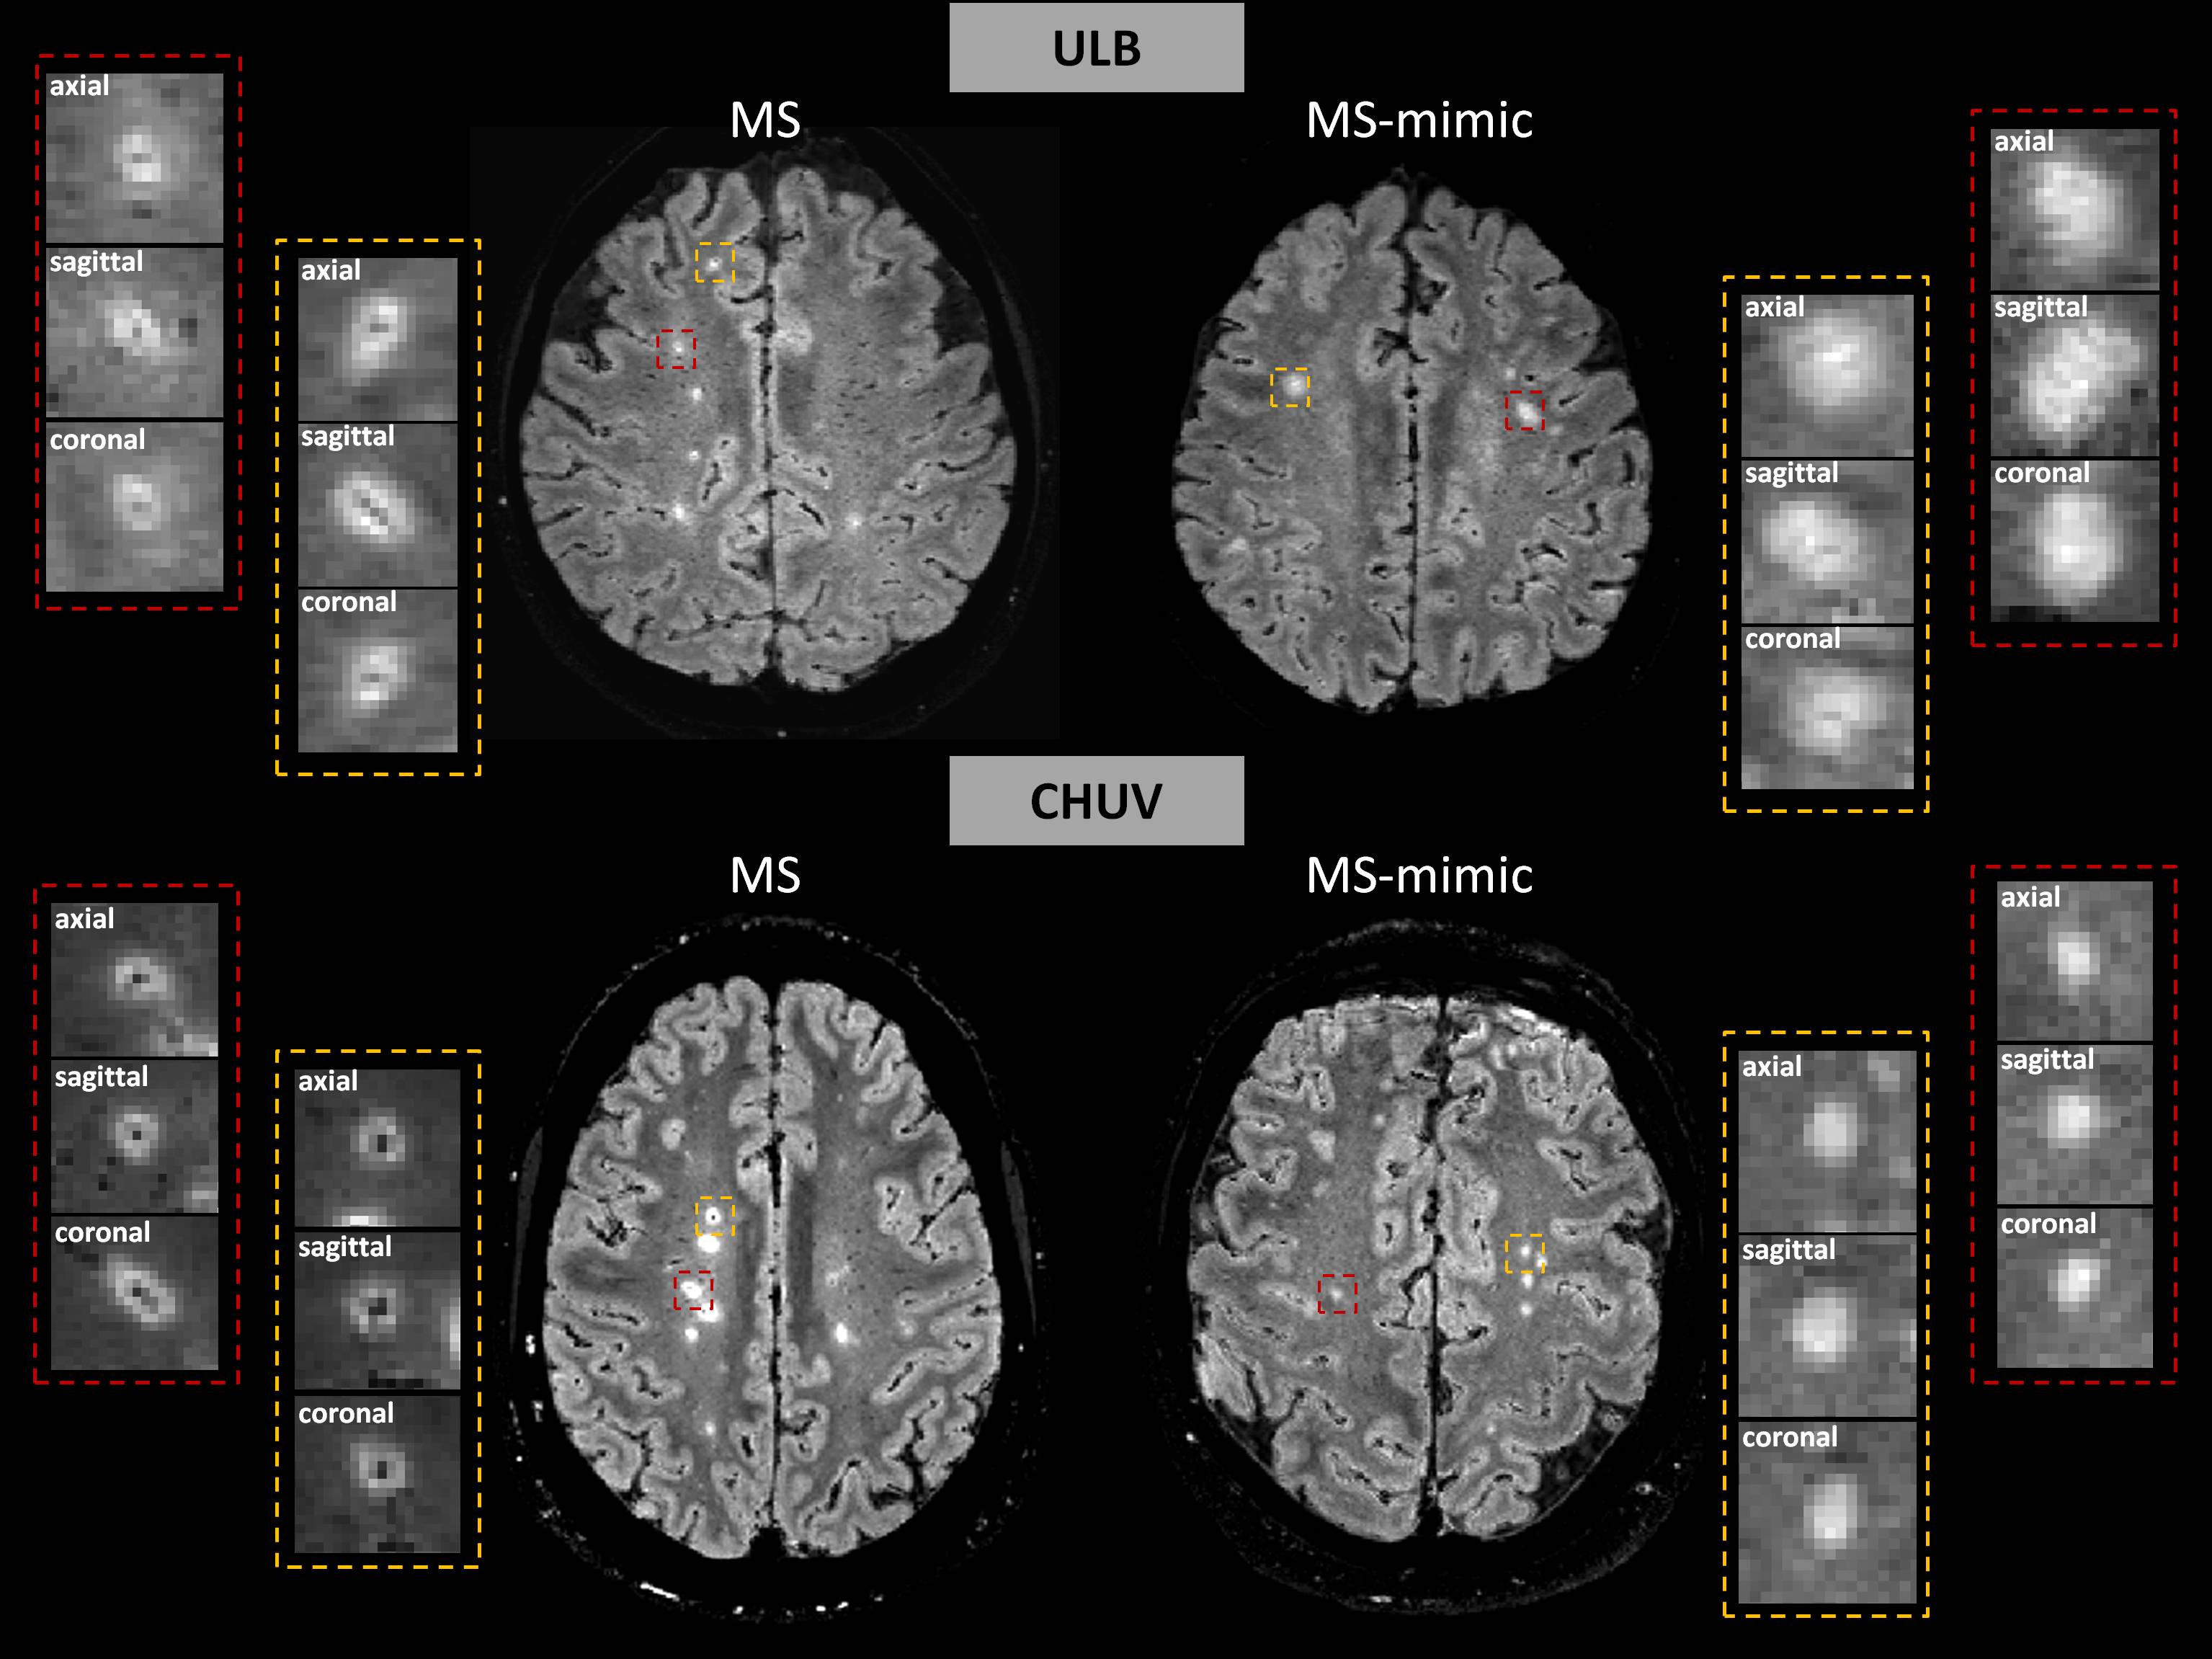
28 subjects (18 with MS and 10 with MS-mimic) from the University Hospital Lausanne, Switzerland (CHUV) underwent imaging in MAGNETOM Skyra or Prismafit 3T scanners (Siemens Healthcare, Erlangen, Germany). 36 subjects (18 MS, 18 MS-mimic) from Hôpital Erasme, Université Libre de Bruxelles, Belgium (ULB) underwent imaging in an Intera 3T (Philips, Best, The Netherlands). The MRI protocol included: 3D T2-FLuid-Attenuated Inversion Recovery (FLAIR, TR/TE/TI=5000/391/1800ms, and TR/TE/TI=4800/373/1600ms for CHUV and ULB, respectively, both with voxel size=1.0x1.0x1.0mm3) and 3D T2*-weighted echo-planar imaging (EPI, TR/TE=65/36ms, voxel size=0.65x0.65x0.65mm3, and TR/TE=53/28ms, voxel size=0.54x0.54x0.55mm3 for CHUV and ULB, respectively). FLAIR* images (Figure 1) were obtained using the reported pipeline7. Manual segmentation and classification of L+ and L- lesions were done by one neurologist and used as a ground truth.
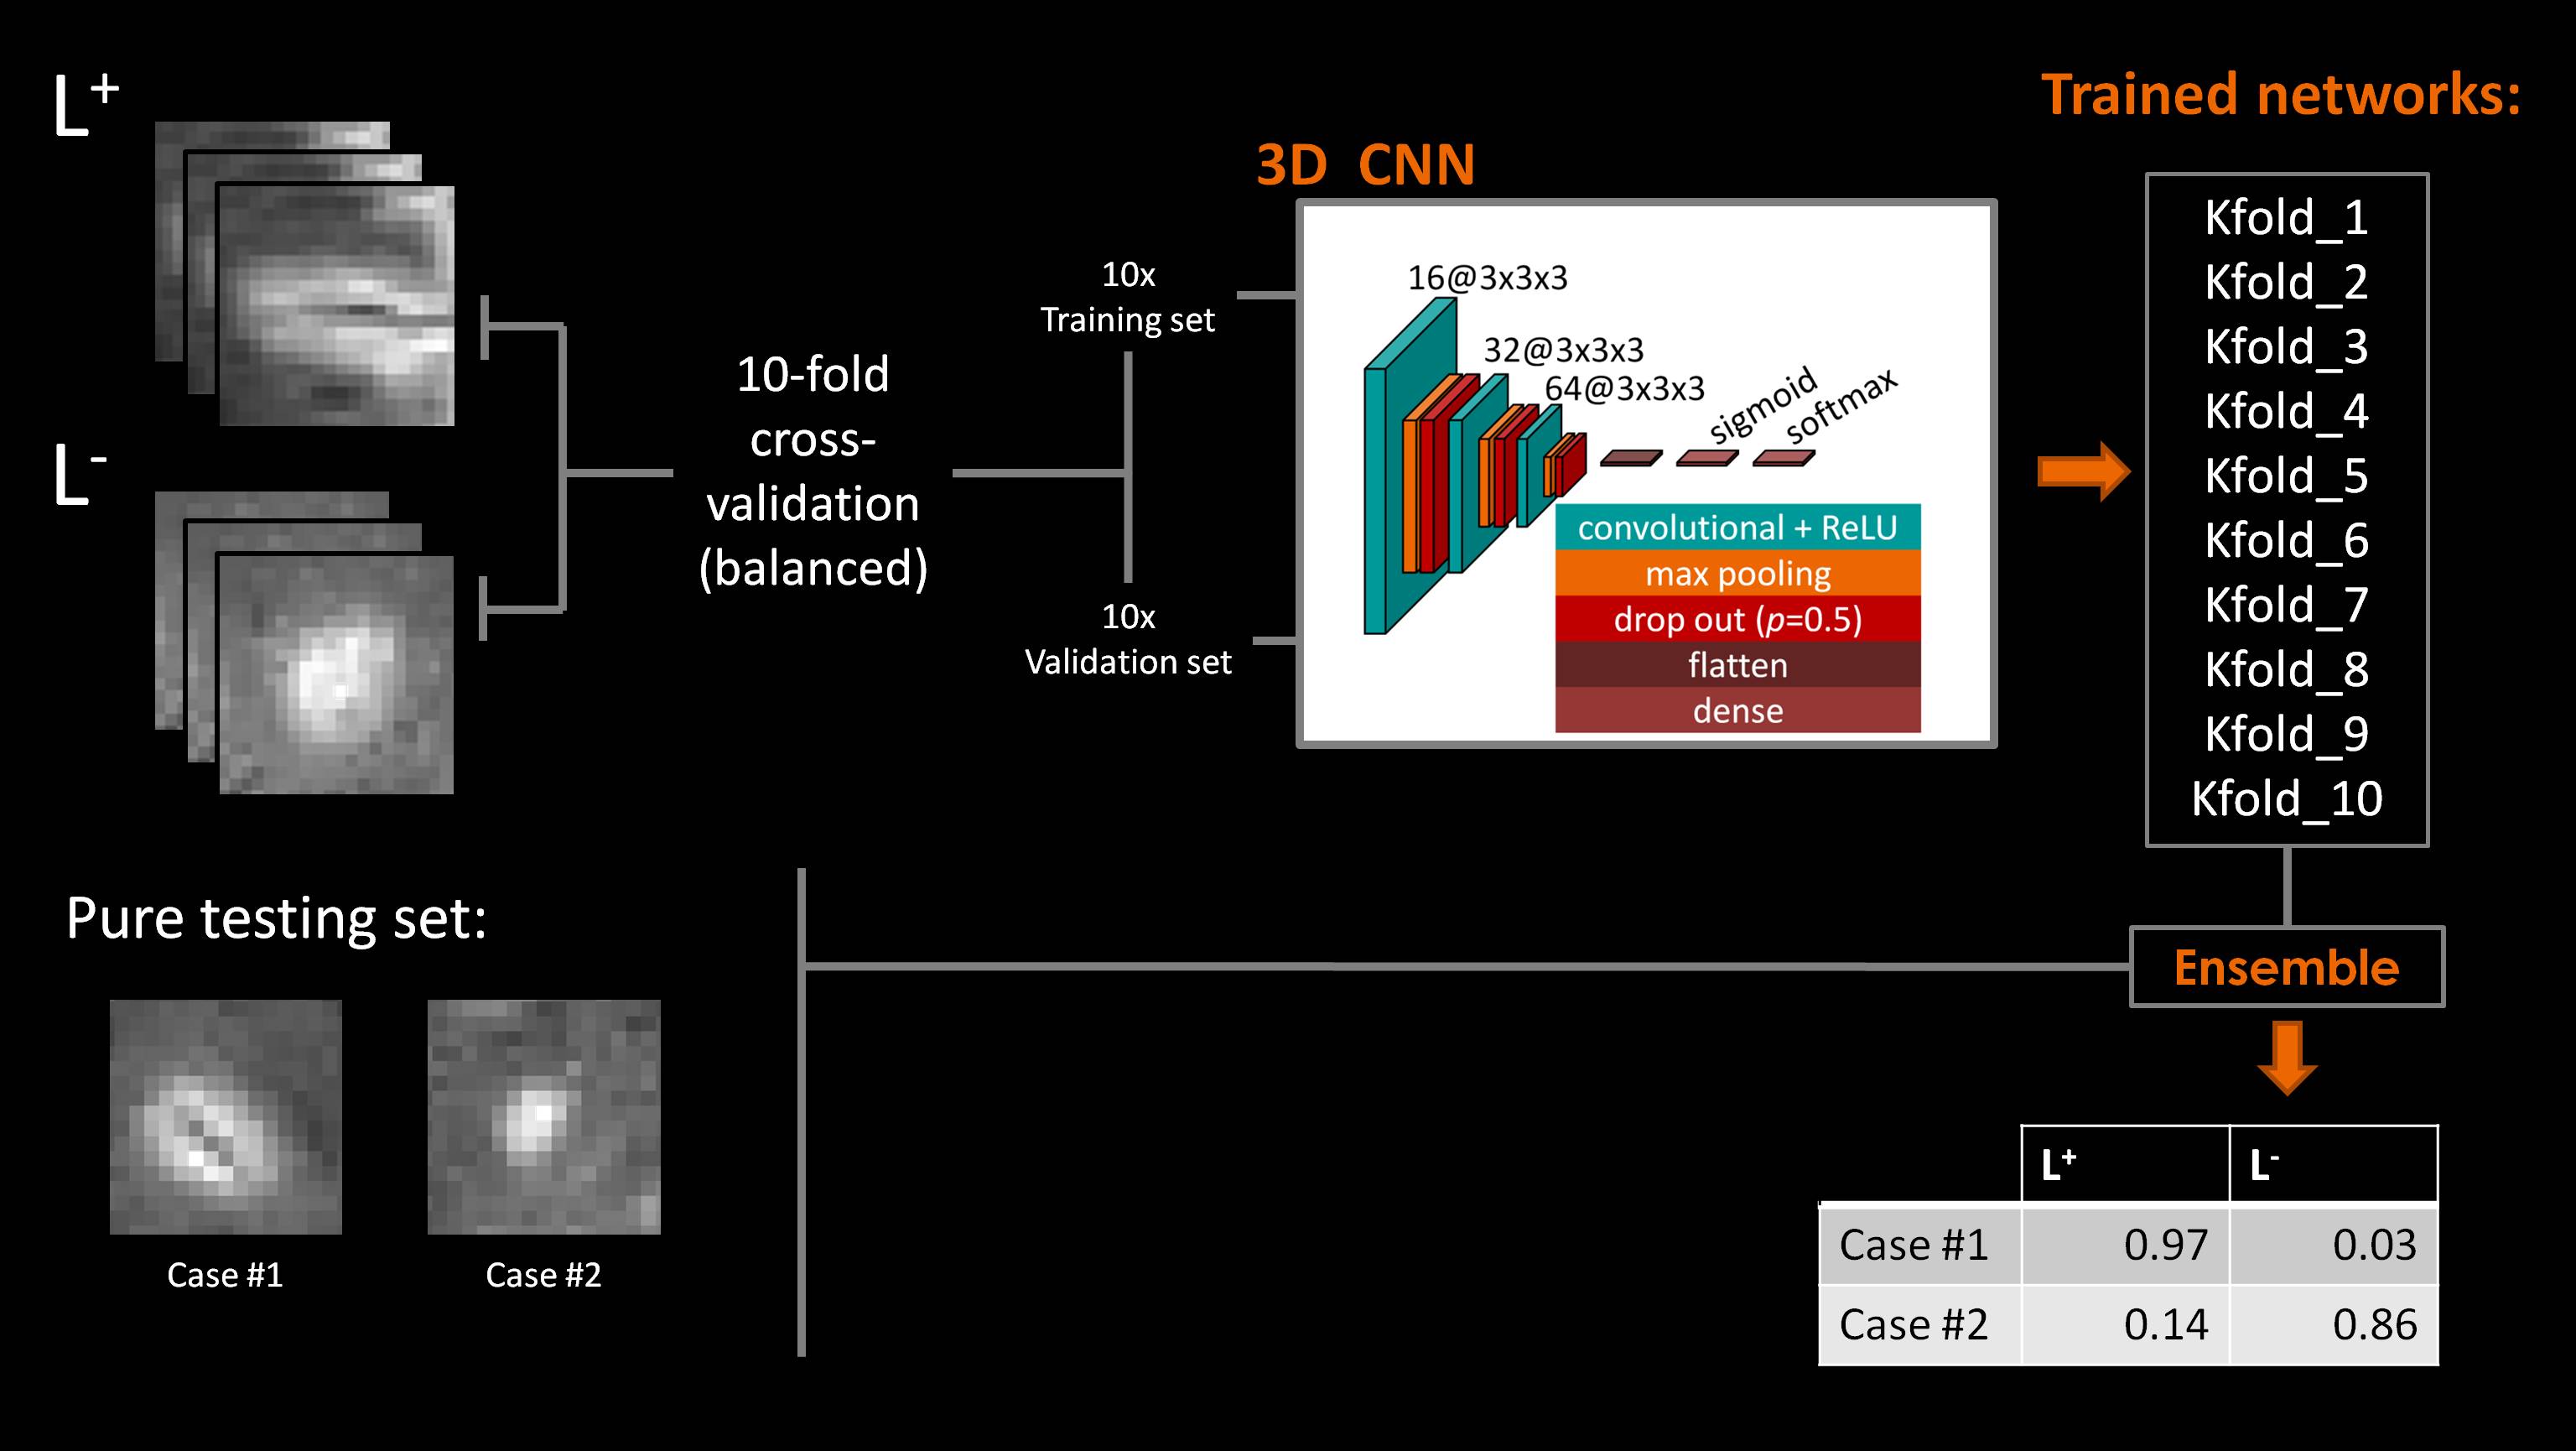
Our method relied on a convolutional neural network with a small architecture of three layers, each with a 3D convolution, followed by a ReLU and dropout (p=0.5). The convolution kernel sizes were (3x3x3x16), (3x3x3x32), (3x3x3x64). This was followed by a fully connected layer of size 32, then a fully connected layer of size 2 with sigmoid activation (Figure 2). The architecture comprised 71810 trainable parameters6. From the multicentre cohort of subjects, 47 (25 MS and 22 MS-mimic) were used to train the network and 17 (11 MS and 6 MS-mimic) used as a pure-testing set. FLAIR* patches (patch-size: 21x21x21 voxels) of L+ and L- lesions were used for training and validation. In total, 673 (375 L+, 298 L-) and 160 (82 L+, 78 L-) patches were obtained for the training and pure-testing sets, respectively (Figure 1). A ten-fold cross-validation technique was used to train networks, where 90% of the lesion patches were used as training set, and 10% as a validation set. Data augmentation based on three 90-degree rotations in one axis was applied to the training and validation sets. We used categorical cross-entropy loss, training with minibatch SGD (Adam) for 200 epochs with a minibatch size of 20, checking for approximate class balance for each resample. The weights were initialised with Xavier Gaussian initialization. The classification results of the pure-testing set were obtained using an ensemble method through the results from each trained network (Figure 2)6.
The performance was evaluated at two different levels:
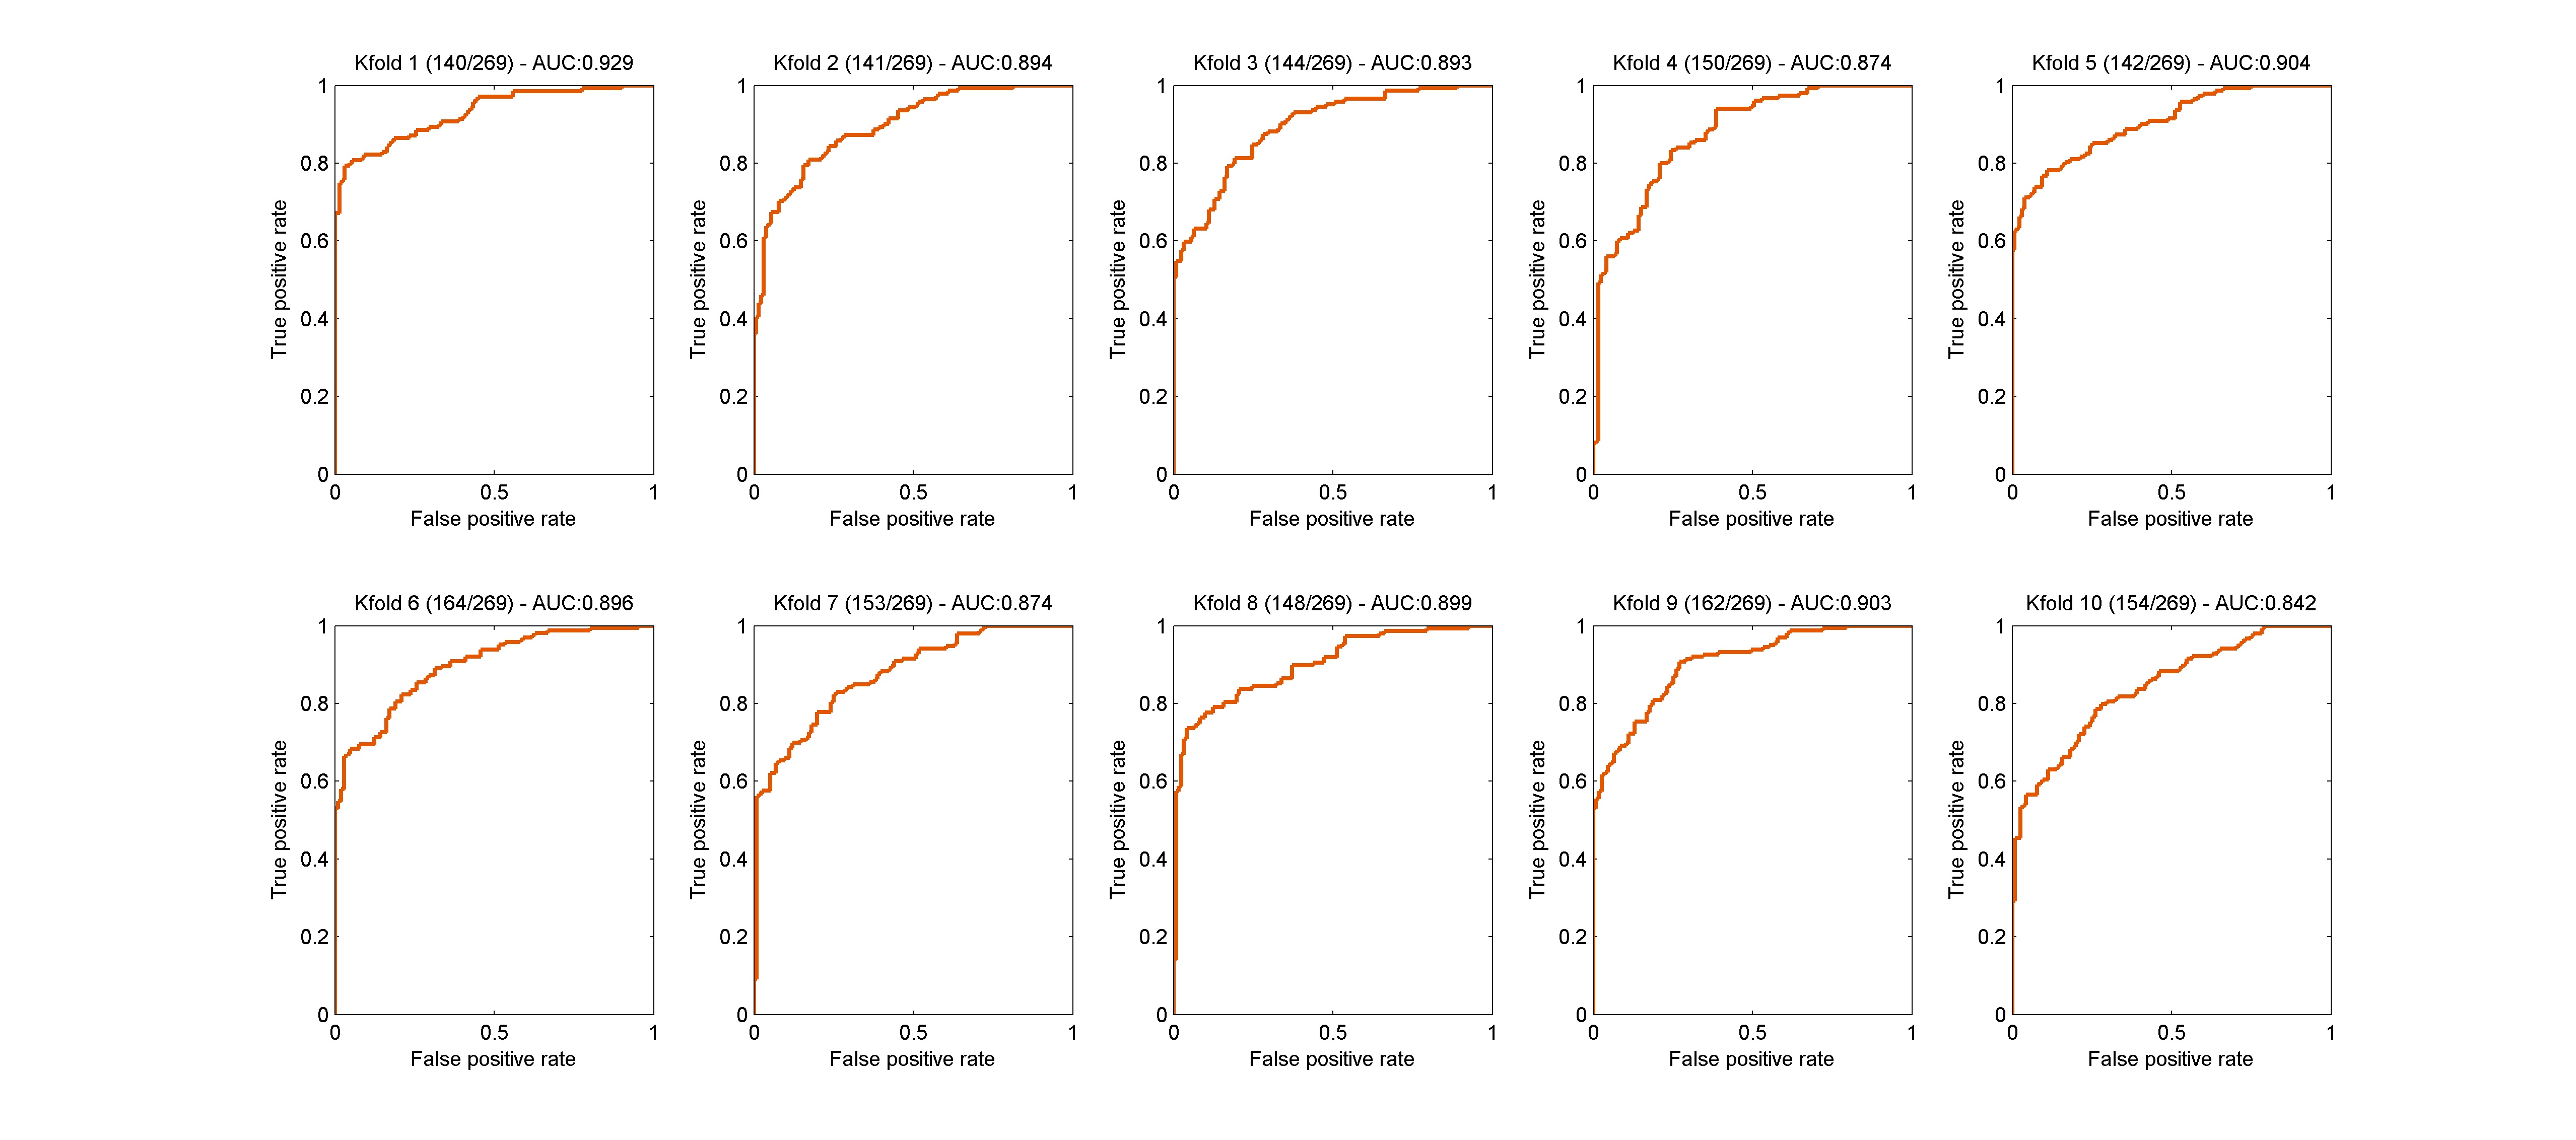
a) Lesion-wise: sensitivity, specificity, and accuracy were computed with respect to the classification of L+ and L- lesions on the validation and pure-testing sets. Receiver operating characteristic (ROC) curve analysis was performed, and area under the curve (AUC) values for each fold were computed for the validation set.
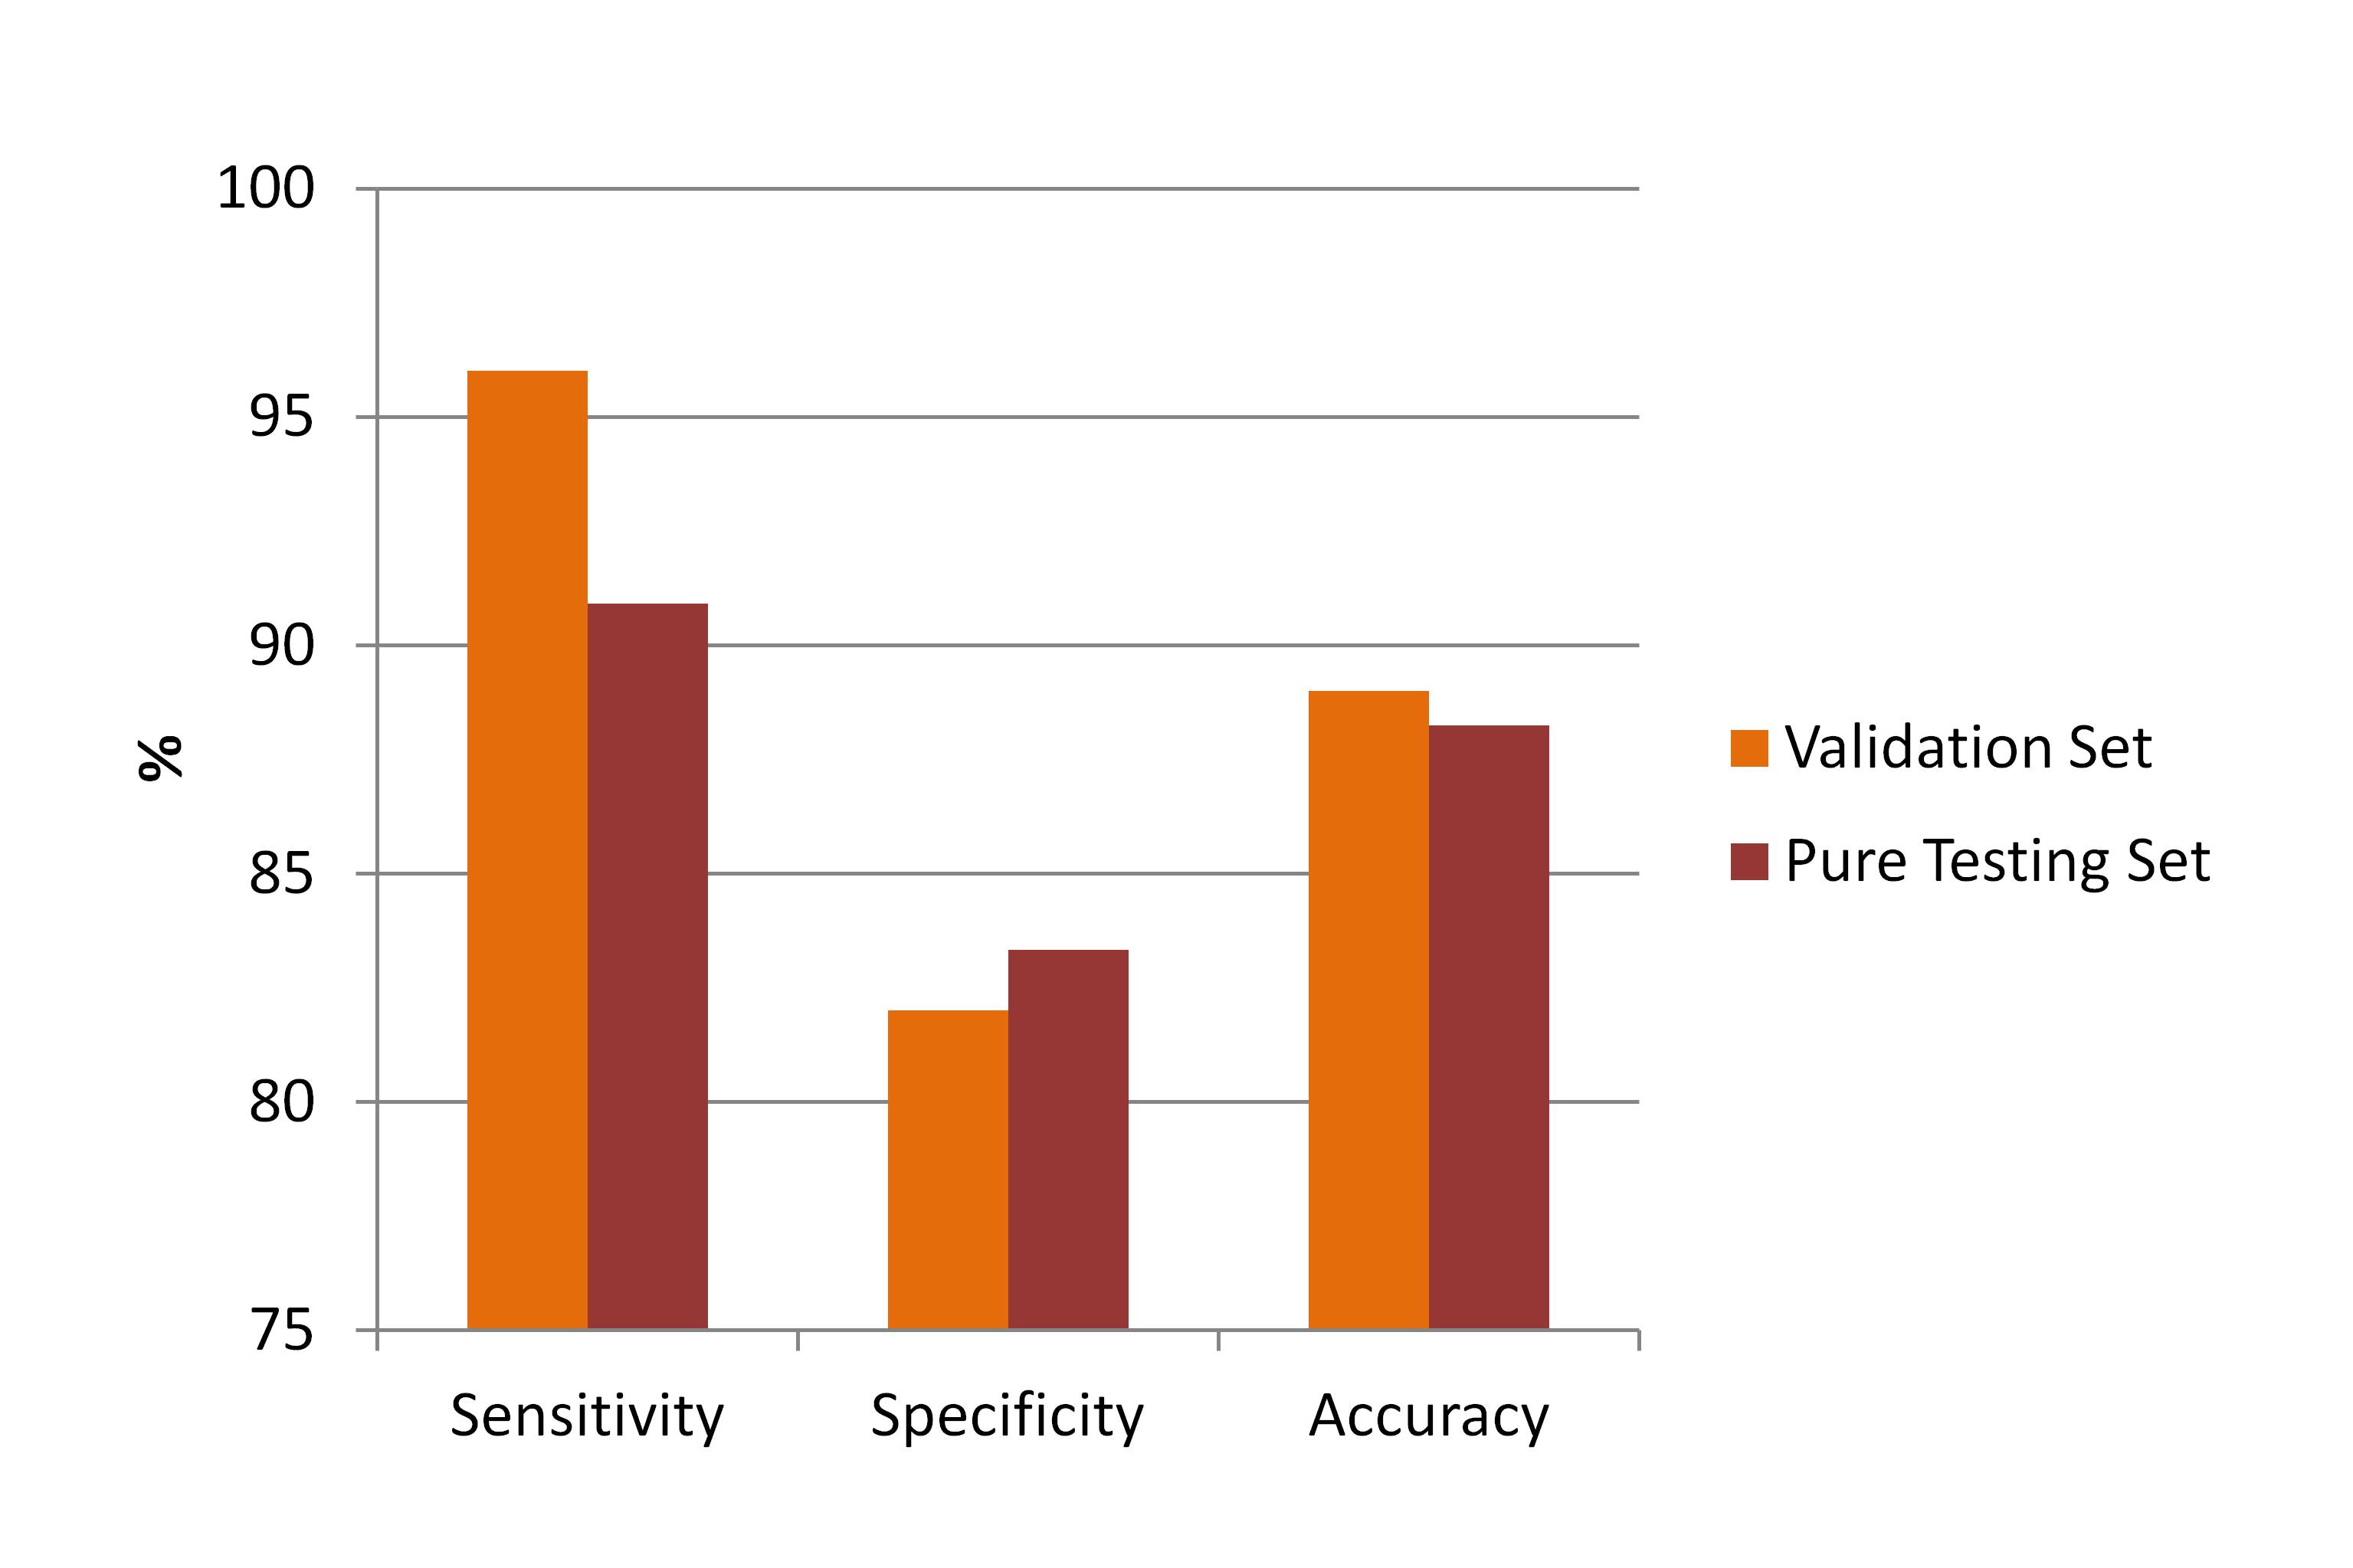
b) Patient-wise: sensitivity, specificity and accuracy were computed regarding the differentiation between MS and MS-mimics. The differentiation was based on the 50% L+ rule2, using the classification results of the validation and pure-testing sets.
Results
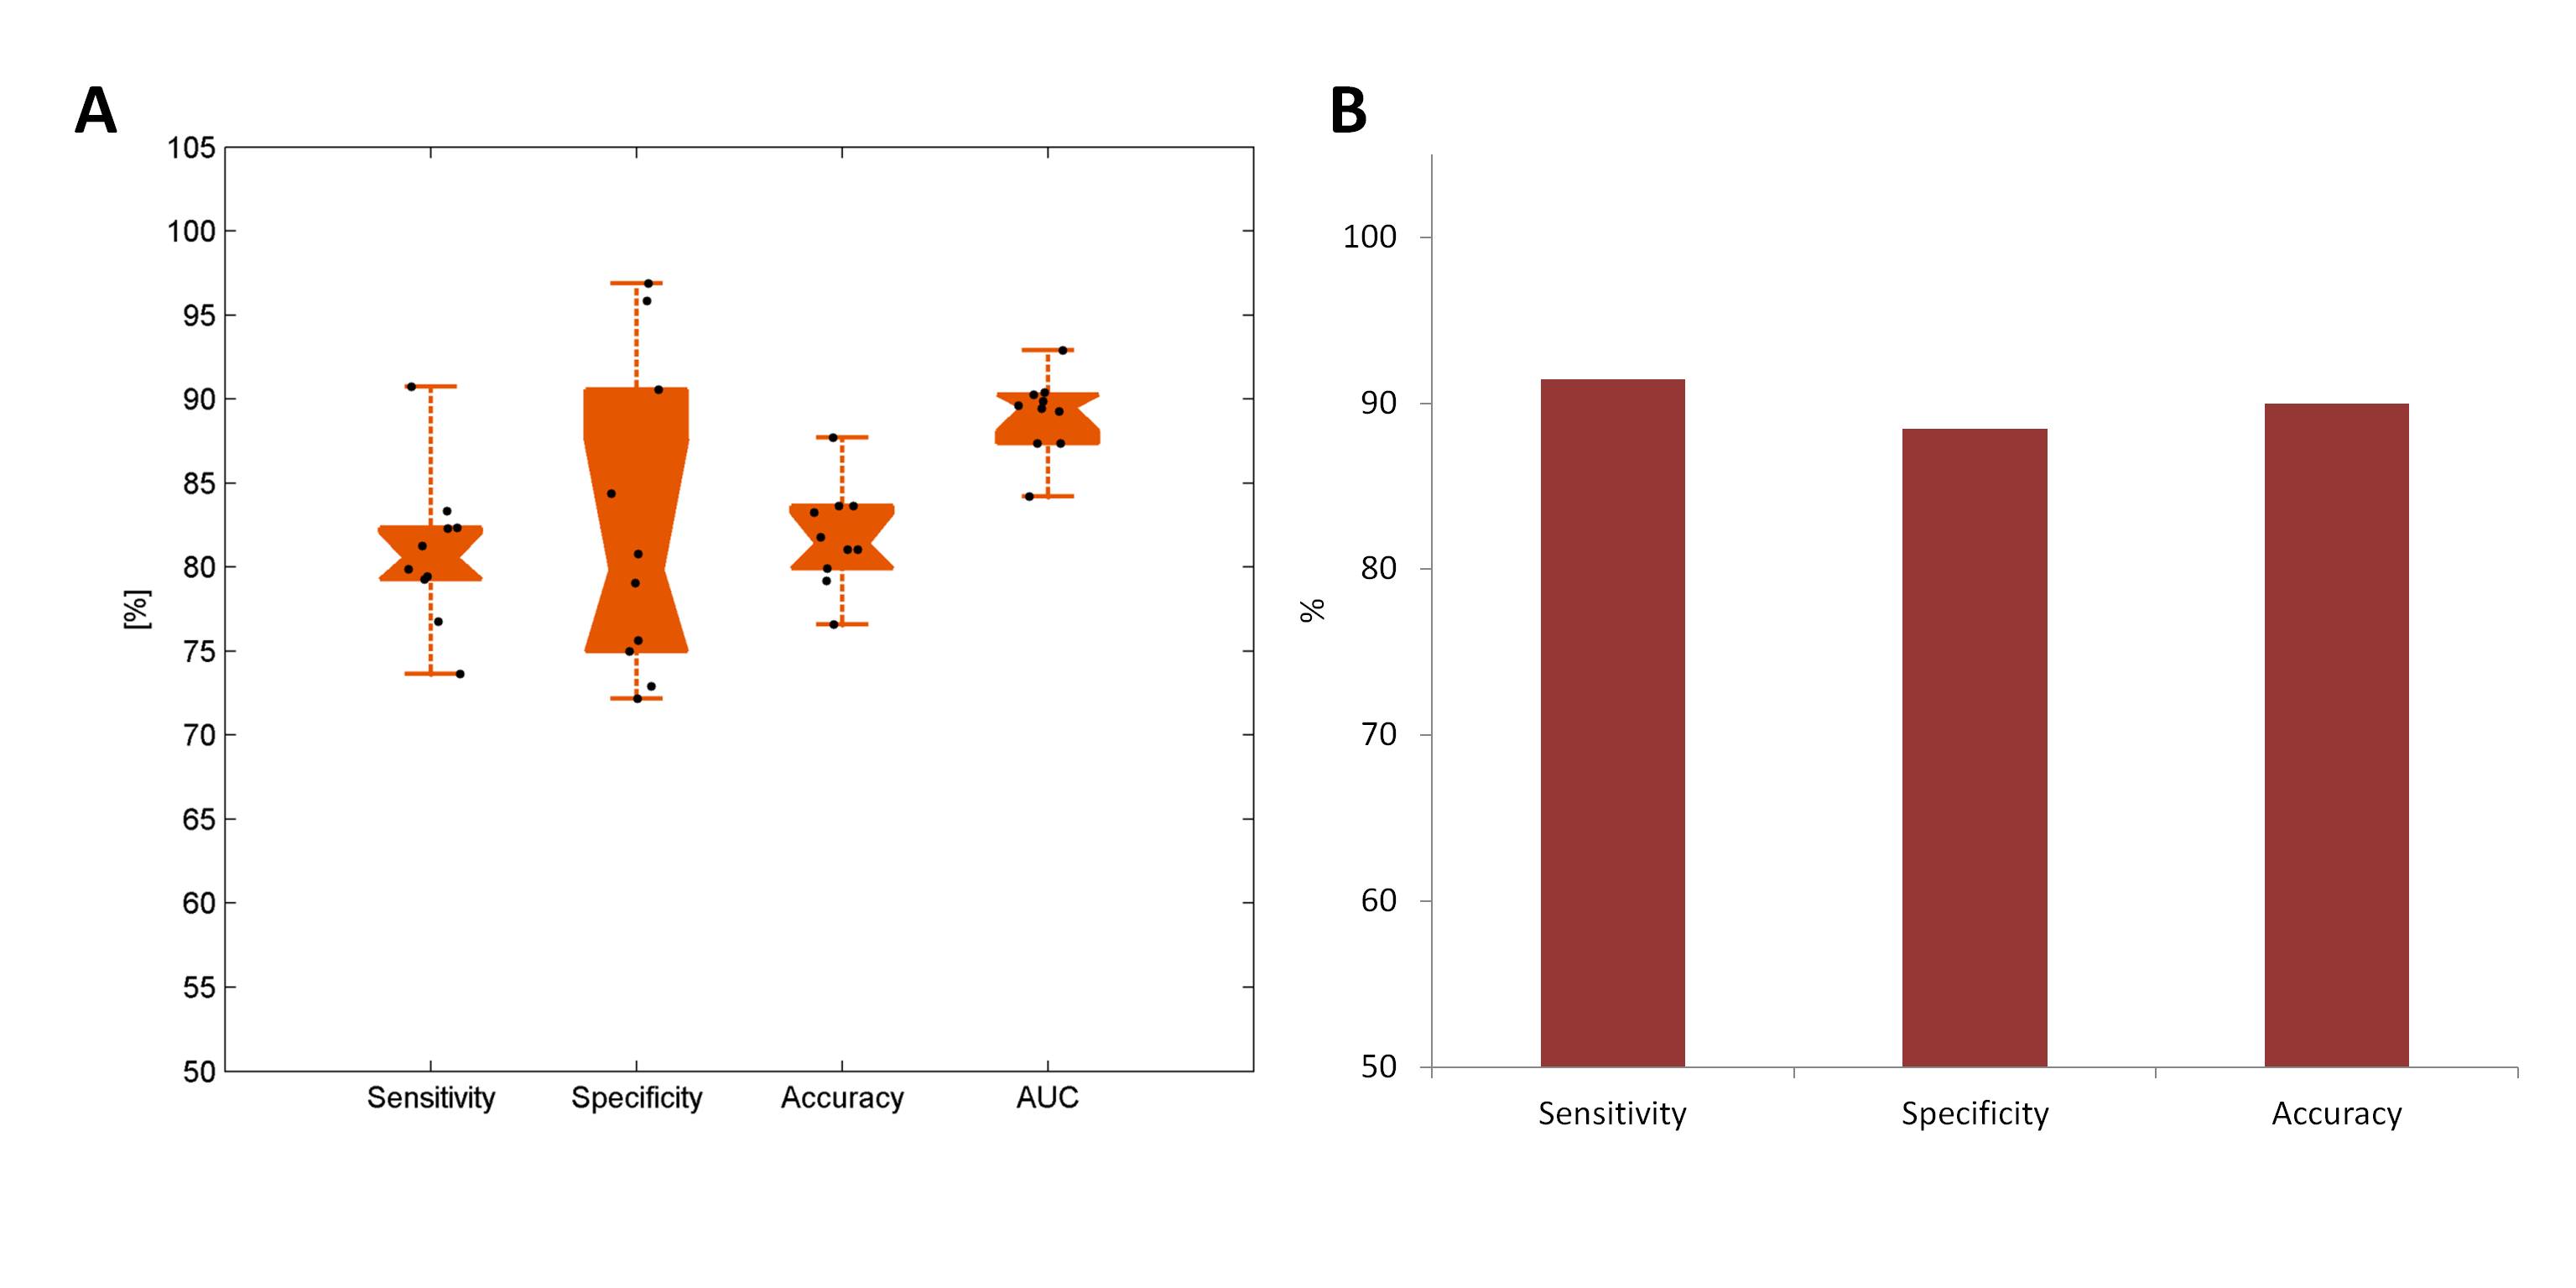
ROC curves for the validation set are presented in Figure 3. As shown in Figure 4A, the method reached medians of 81% (range: 74%-91%) for sensitivity, 80% (range: 72%-97%) for specificity, 81% (range: 77%-88%) for accuracy, and 90% (range: 84%-93%) for AUC, regarding the classification of L+ and L- lesions in the validation set. Similar performance was achieved in the pure-testing set where the method showed 91%, 88%, and 90% of sensitivity, specificity, and accuracy, respectively (Figure 4B). At the patient level (Figure 5), the method was able to differentiate MS from MS-mimics with 96%/91% sensitivity, 82%/83% specificity and 89%/88% accuracy for the validation/pure-testing sets.Discussion
The high performance of the proposed automated classification is promising and shows potential for the method to be used i) in multicentre studies across different platforms, and ii) eventually as a clinical-decision support tool for MS differential diagnosis. Using data from different healthcare units in the training phase makes the method more robust and less site-dependent. Future work will aim at the integration of a robust method for lesion segmentation8 as initial step in order to have a complete and fully automated pipeline.Acknowledgements
No acknowledgement found.References
1. Cortese R, Magnollay L, Tur C, et al. Value of the central vein sign at 3T to differentiate MS from seropositive NMOSD. Neurology. 2018;90(14):e1183-e90.
2. Maggi P, Absinta M, Grammatico M, et al. Central vein sign differentiates Multiple Sclerosis from central nervous system inflammatory vasculopathies. Annals of Neurology. 2018;83(2):283-94.
3. Solomon AJ, Schindler MK, Howard DB, et al. “Central vessel sign” on 3T FLAIR* MRI for the differentiation of multiple sclerosis from migraine. Annals of Clinical and Translational Neurology. 2016;3(2):82-7.
4. Thompson AJ, Banwell BL, Barkhof F, et al. Diagnosis of multiple sclerosis: 2017 revisions of the McDonald criteria. The Lancet Neurology. 2018;17(2):162-73.
5. Sati P, Oh J, Constable RT, et al. The central vein sign and its clinical evaluation for the diagnosis of multiple sclerosis: a consensus statement from the North American Imaging in Multiple Sclerosis Cooperative. Nature Reviews Neurology. 2016;12:714.
6. Fartaria MJ, Richiardi J, Jorge J, et al. An ensemble of 3D convolutional neural networks for central vein detection in white matter lesions. MIDL 2018.
7. Sati P, George IC, Shea CD, et al. FLAIR*: a combined MR contrast technique for visualizing white matter lesions and parenchymal veins. Radiology. 2012;265(3):926-32.
8. Fartaria MJ, Roche A, Meuli R, et al. Segmentation of Cortical and Subcortical Multiple Sclerosis Lesions Based on Constrained Partial Volume Modeling. In: Descoteaux M, Maier-Hein L, Franz A, et al., eds. Medical Image Computing and Computer-Assisted Intervention − MICCAI 2017: 20th International Conference, Quebec City, QC, Canada, September 11-13, 2017, Proceedings, Part III. Cham: Springer International Publishing; 2017:142-9.
Figures