4882
To evaluate the role of machine learning for characterization of breast lesion using multi-parametric MRI.1Centre for Biomedical Engineering, Indian Institute of Technology Delhi, New Delhi, India, 2Department of Radiology, Fortis Memorial Research Institute, Haryana, Gurgaon, India, 3Department of Biomedical Engineering, All India Institute of Medical Science, New Delhi, India
Synopsis
The role of machine learning in medical imaging is increasing day by day. It can help in combining a variety of complementary information obtained using multi-parametric MRI(mpMRI). The objective of this study was to differentiate benign vs. malignant breast tumor using machine learning with optimized feature set obtained from mpMRI data. The study included mpMRI data of 49 patients with breast cancer. Quantitative mpMRI parameters as well as texture features were used as feature set in machine learning. The combination of the wrapper method with SVM resulted in high sensitivity (100%) and specificity (93.75%) in the binary classification of benign and malignant.
Introduction:
Multi-parametric MRI(mpMRI) data is routinely acquired for breast cancer patients. Recent studies have focused on combining mpMRI based parameters to obtain an optimum feature set for machine learning and exploring its clinical potential1,2. Generally, machine learning framework involve feature extraction, feature selection, and classification. Feature selection plays an important role in healthcare application3,4. Complimentary features can improve accuracy of classification. Previous studies have shown the role of texture features in classification of tumor. Various quantitative parameters can be extracted from mpMRI data, which often provide complementary information5,6,7,8,9. The accuracy of machine learning techniques depends upon the robustness of features4. Several studies have been reported to differentiate benign vs malignant using individual features or a different combination of features (like morphology, kinetic curves, semi-quantitative parameters etc.) with varying sensitivity and specificity in reported studies2,4,5. The objective of this study was to investigate the performance of various machine learning classifiers for characterization of the breast lesion (benign vs malignant) based on optimal feature set in terms of accuracy, sensitivity and specificity. This study also investigated the influence of different feature selection strategies to obtain an optimal feature set from mpMRI features for improving the diagnosis of breast cancer patients.Methods:
All MRI experiments were performed at 3T-whole body Ingenia MRI system(Philips-Healthcare, The Netherlands) using a 7-channel biopsy compatible breast coil. Breast mpMRI data of 49 female patients(15 benign, 34 malignant patients) were included in this study. MRI study protocol included conventional MRI images(T1-W, T2-W, PD-W), DWI and DCE-MRI data. FOV=338×338mm, slice thickness=3mm and acquisition matrix 452×338 were used for T1-W, T2-W and PD-W images. In this study, TR/TE=2821ms/30ms, TR/TE=2823ms/100ms and TR/TE=557ms/10ms for PD-W, T2-W and T1-W images respectively. Contrast (Gd-BOPTA (Multihance, Bracco, Italy)) enhanced DCE-MRI was performed using a 3-dimensional fast-field-echo sequence(TR/TE=3.0ms/1.5ms, flip-angle=12o, matrix-size=228*226, acquisition time 222seconds, 40 dynamics and 5.4seconds temporal resolution). DWI was performed using echo-planar imaging sequence sequence (TR/TE=11221ms/75ms, flip angle=90o, matrix size=156*154 and 7 b-values) with different b-values (0, 200, 400, 600, 1000, 1200 and 1,500 s/mm2).
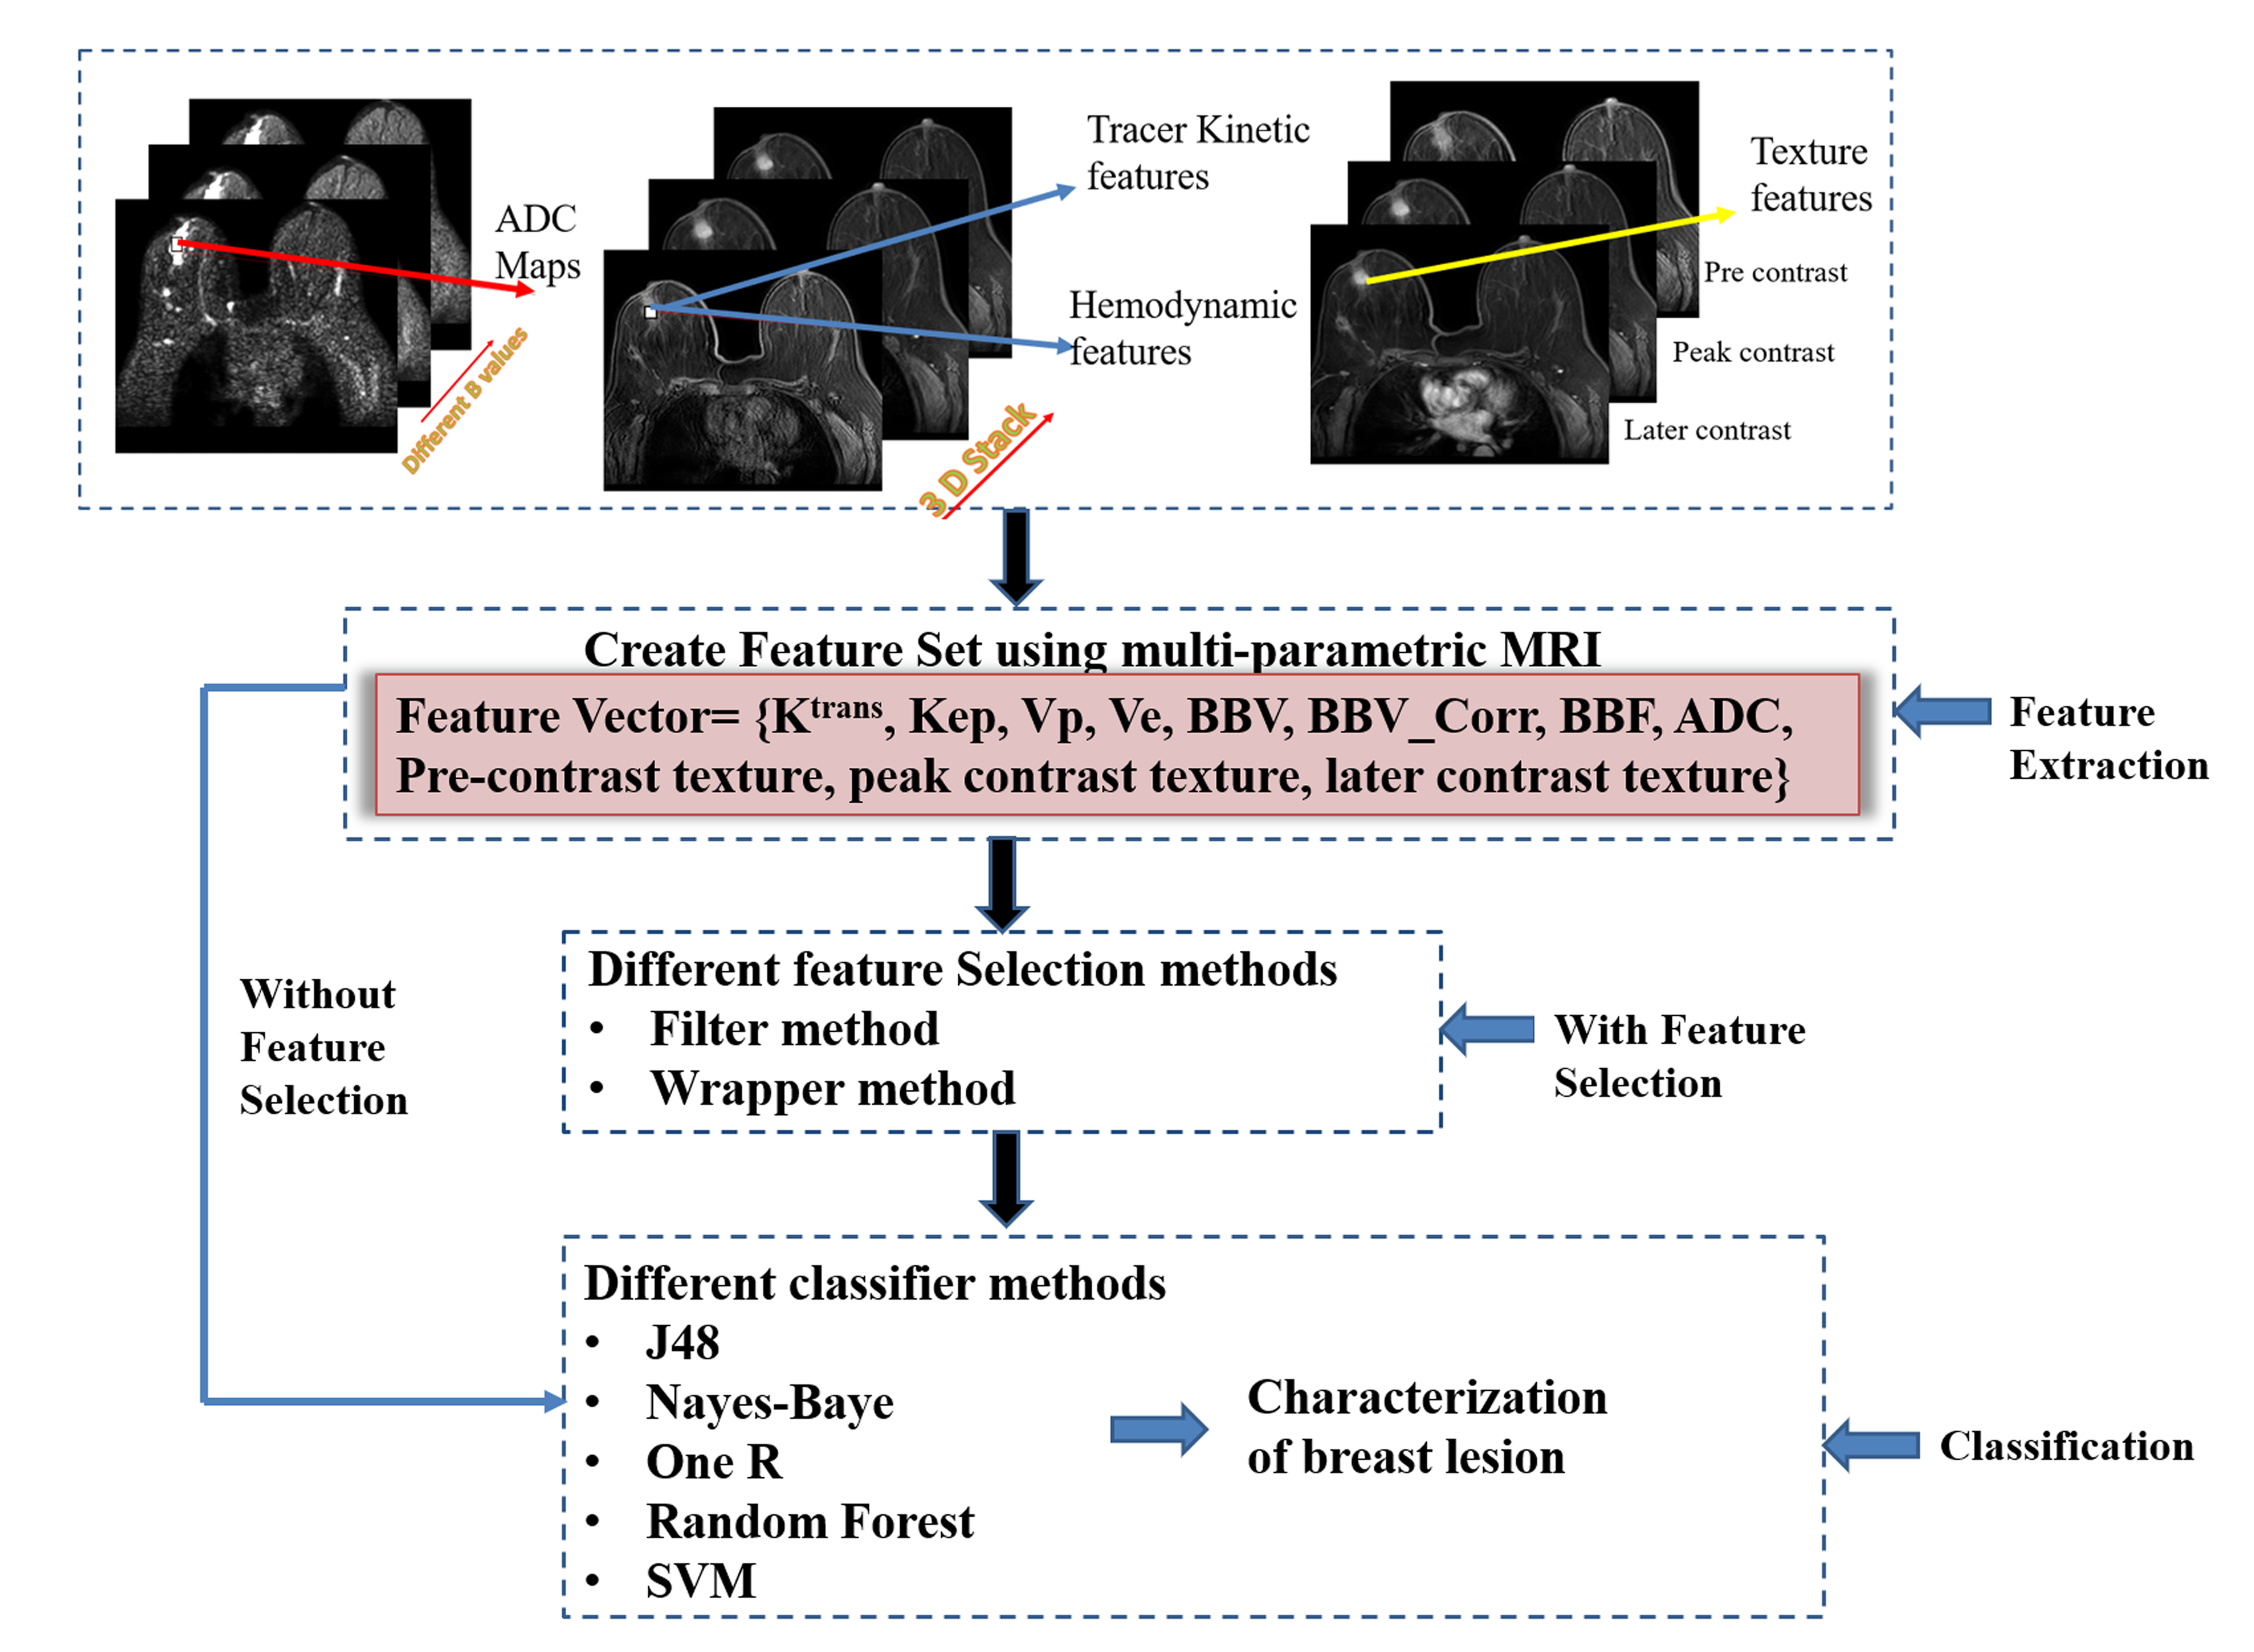
Data processing: A systematic approach for feature extraction using mpMRI data to create a feature vector or set, feature selection and classification was carried out as shown in Figure-1. Tumor tissue was used as a region of interest(ROI). Following mpMRI features from ROI were selected: Tracer kinetics parameters (Ktrans, Kep, Vp, Ve) and hemodynamic parameters(BBV, BBV_Corr, and BBF), computed from DCE-MRI data5; apparent-diffusion-coefficient(ADC)9 parameter, computed using DWI data corresponding to different b-values; Texture features6,7,8 obtained from pre-contrast, 25th, 40th dynamics series of DCE-MRI images. Quantitative parameters from mpMRI data were obtained using in house developed MATLAB based tool. Texture analysis was performed using Radiomics tool (https://github.com/mvallieres/radiomics). The description of these features is shown in Table-I. 40 texture features from each contrast (pre, peak and later contrast respectively) were obtained to create a feature vector. A total of 128 features were used to create a feature vector. The different features selection methods2 (filter and wrapper methods) were applied on feature vector to select the best feature for classification using different classifiers10 with 15-cross-validation to classify the data into benign and malignant. The diagnostic performance of selected features was analyzed using accuracy, sensitivity, specificity with respect to histology result.
Results:
The performance of different classifiers with a combination of different features selection techniques using mpMRI data based features were evaluated with 15-cross-validation, whose AUC was greater than 0.8. The SVM provided superior performance using all mpMRI features (accuracy 91.84%) as well as optimally selected mpMRI features (93.88% accuracy with filter method and 97.96% accuracy with wrapper method) compared to the other classifier in our cohort as shown in Table-2. The combination of SVM (linear kernel) with wrapper method using best-fit feature selection technique, in forward direction, provided highest sensitivity (100%), specificity (93.75%) and accuracy (97.96%) in characterizing between malignant and benign lesions among all other methods.Discussion and Conclusion:
The sensitivity and specificity of individual features for characterization of benign and malignant varied from 57% to 92% and 46% to 89% respectively. For combination of different features, the sensitivity and specificity varied from 70% to 96.49% and 66% to 93.2% respectively in reported studies2,3,4,5,9. Using a combination of SVM and optimal mpMRI features set with wrapper method provided the highest sensitivity (100%), specificity (93.75%) and accuracy of 97.96% as compared to reported studies. These are preliminary results with a small number of patients. More datasets should be investigated in future studies. In conclusion, Quantitative analysis of mpMRI provided optimal selected feature with wrapper method which improved the accuracy in the binary classification of benign vs malignant.Acknowledgements
The authors acknowledge an internal funding support from IIT-Delhi. Authors acknowledge support of Philips India Limited and Fortis Memorial Research Institute Gurugram in MRI data acquisition.The authors thanks Mr. Anirban Sengupta,Subhajit Chatterjee and Mamta Gupta.References
[1] Pinker K, Helbich TH, Morris EA. The potential of multiparametric MRI of the breast. Br Inst Radiol 2017;90:1–17.
[2] Cai H, Peng Y, Ou C, Chen M, Li L (2014) Diagnosis of Breast Masses from Dynamic Contrast-Enhanced and Diffusion-Weighted MR: A Machine Learning Approach. PLoS ONE 9(1): e87387.
[3] Purnami SW, Rahayu SP, Embong A. Feature selection and classification of breast cancer diagnosis based on support vector machines. IEEE 2008; 978:2328–6.
[4] Jiang X, Xie F, Liu L, Peng Y, Cai H, Li L. Discrimination of malignant and benign breast masses using automatic segmentation and features extracted from dynamic contrast-enhanced and diffusion-weighted MRI. Oncol Lett. 2018;16(2):1521-1528.
[5] Thakran S, Gupta PK, Kabra V, Saha I, Jain P, Gupta RK, Singh A, “Characterization of breast lesion using T1-perfusion magnetic resonance imaging: Qualitative vs. quantitative analysis” Diagn Interv Imaging. 2018 Oct;99(10):633-642.
[6] Haralick R, Shanmugam K, and Dinstein I, Textural Features for Image Classication, IEEE Transactions on Systems, Man, and Cybernetics, vol. SMC-3, no. 6, pp. 610-621, Nov. 1973.
[7] Galloway M, Texture analysis using gray level run lengths, Computer Graphics and Image Processing, Volume 4, Issue 2, 1975, Pages 172-179.
[8] Thibault, G., Fertil, B., Navarro, C., Pereira, S., Cau, P., Levy, N., Sequeira, J. and Mari, J.J., Texture indexes and gray level size zone matrix application to cell nuclei classication. 2009. 10. M. Amadasun and R. King, Textural features corresponding to textural properties, in IEEE Transactions on Systems, Man, and Cybernetics, vol. 19, no. 5, pp. 1264-1274, Sep/Oct 1989.
[9] Guo Y, Cai Y-Q, Cai Z-L, Gao Y-G, An N-Y, Ma L, et al. Differentiation of clinically benign and malignant breast lesions using diffusion-weighted imaging. J Magn Reson Imaging 2002;16: 172–8.
[10] Zhang X, Yan LF, Hu YC, et al. Optimizing a machine learning based glioma grading system using multi-parametric MRI histogram and texture features. Oncotarget. 2017;8(29):47816-47830.
Figures