4880
3D Convolutional Networks to predict Total Knee Replacement using Structural MRI1Center for Data Science, New York University, New York, NY, United States, 2Leonard N. Stern School of Business, New York University, New York, NY, United States, 3Courant Institute of Mathematical Sciences, New York University, New York, NY, United States, 4Department of Radiology, New York University Langone Medical Center, New York, NY, United States, 5Center for Musculoskeletal Care, New York University Langone Medical Center, New York, NY, United States, 6Center for Advanced Imaging Innovation and Research (CAI2R) and Bernard and Irene Schwartz Center for Biomedical Imaging, New York University Langone Medical Center, New York, NY, United States, 7The Sackler Institute of Graduate Biomedical Sciences, New York University School of Medicine, New York, NY, United States
Synopsis
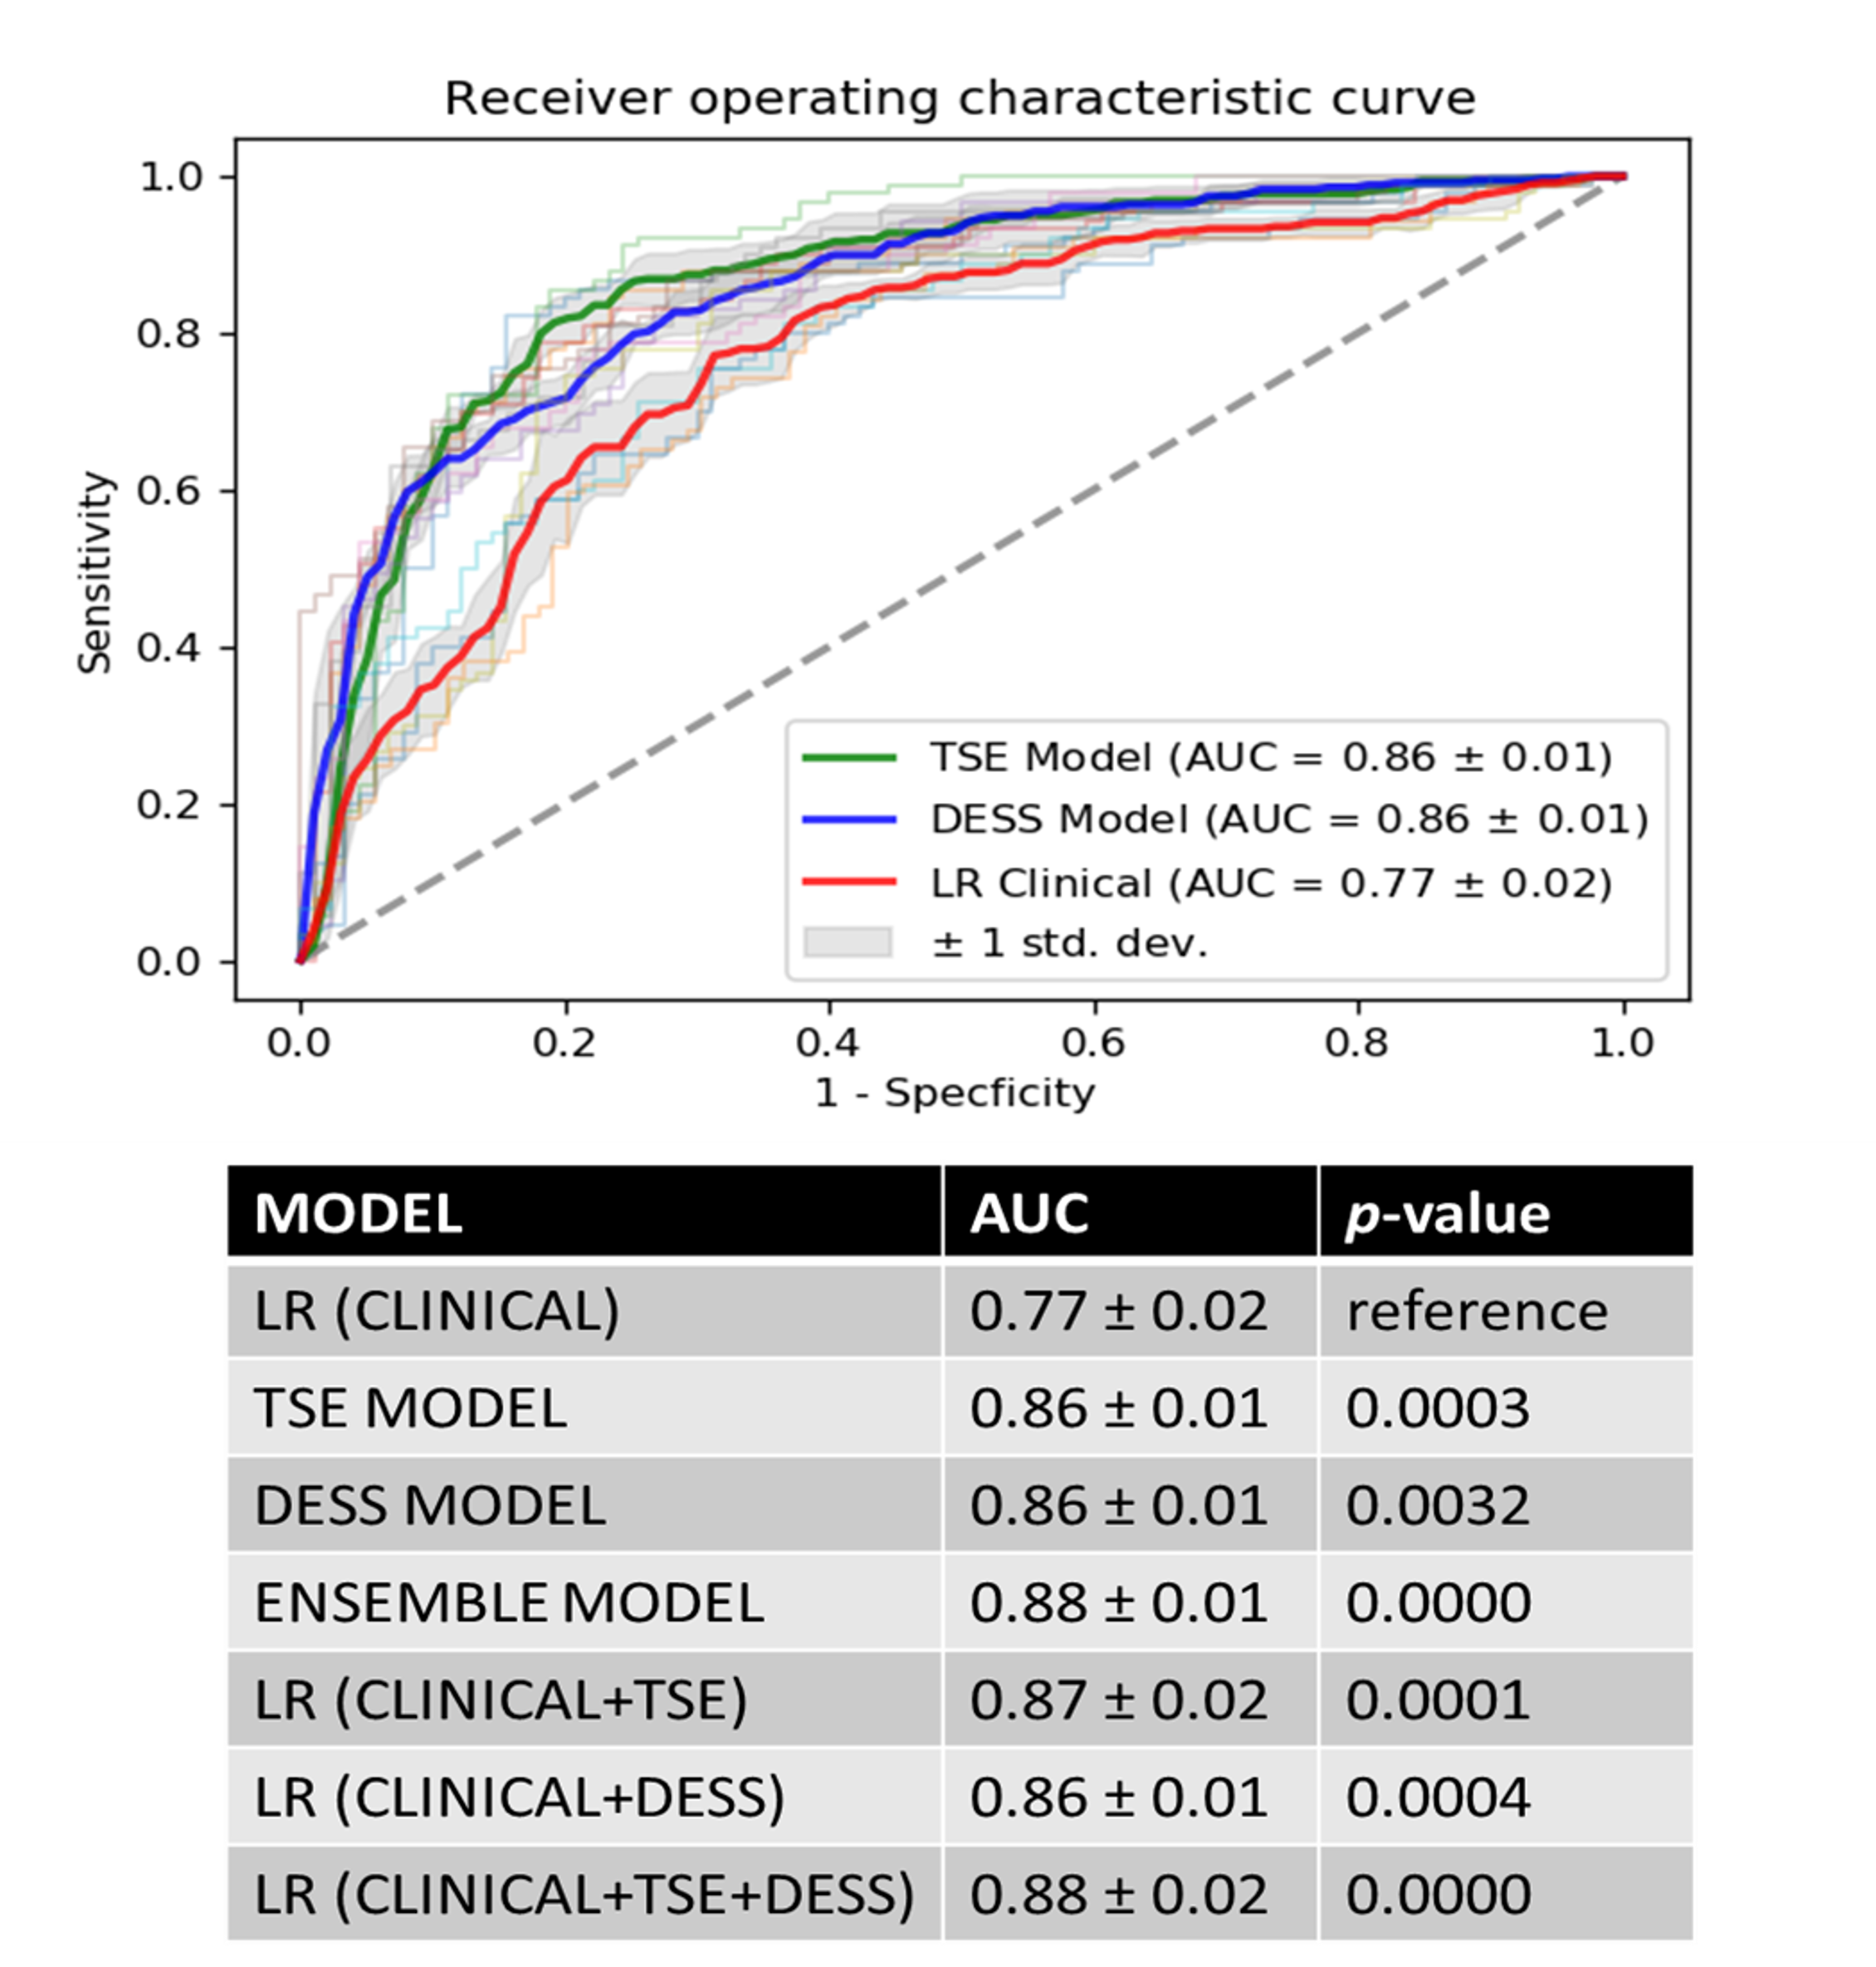
Osteoarthritis (OA) is a chronic degenerative disorder of joints and is the most common reason leading to total knee joint replacement (TKR). In this work, we developed an automated OA-relevant imaging biomarker identification system based on MR images and deep learning (DL) methods to predict knee OA progression. Our results indicate that the combination of multiple MR images with different contrast and resolution provides the best model to predict TKR with AUC 0.88±0.01.
Introduction
OA is the most common form of arthritis and the major cause of physical disability in the elderly. The discovery of imaging-based biomarkers could lead to the identification of new treatment targets and mechanisms for shorter, more efficient clinical trials of possible disease-modifying agents. In recent years, MRI has been increasingly used in OA, since it can visualize all tissues in the knee joint involved in OA, such as cartilage1,2, menisci3, bone2 and soft tissue. Current image analysis methods focus mainly on locations/features4 previously defined to characterize knee joint health separately while neglecting the potential effects of a constellation of locations/features yet to be discovered. In this study, we used DL methods to identify OA-relevant imaging biomarkers directly from knee MR images. Our aim is to predict the outcome of OA as a subject’s probability of TKR within nine years directly from structural MR images with different contrast and resolution.Dataset and Methods
Sagittal intermediate-weighted fat-saturated Turbo Spin Echo(TSE) images and sagittal 3D double-echo steady-state (DESS) with water excitation images from Osteoarthritis Initiative5 are used for this study. TSE images provides information about cartilage loss, ligament integrity, meniscal tears and subchondral bone marrow. DESS images provide information about total joint cartilage morphology, bone area and shape, and osteophytes. Table 1 shows the acquisition parameters of both sequences.
718 case-control pairs (age: 63±12 years, BMI: 29±6.6 kg/m2, 274/444 male/female split) were selected from OAI dataset by propensity score matching6 on individuals based on the baseline variables: age, BMI, gender and race. Cases were defined as individuals who received a medically confirmed TKR after baseline. We defined controls as individuals who did not receive a TKR in either knee on the 108-month visit.
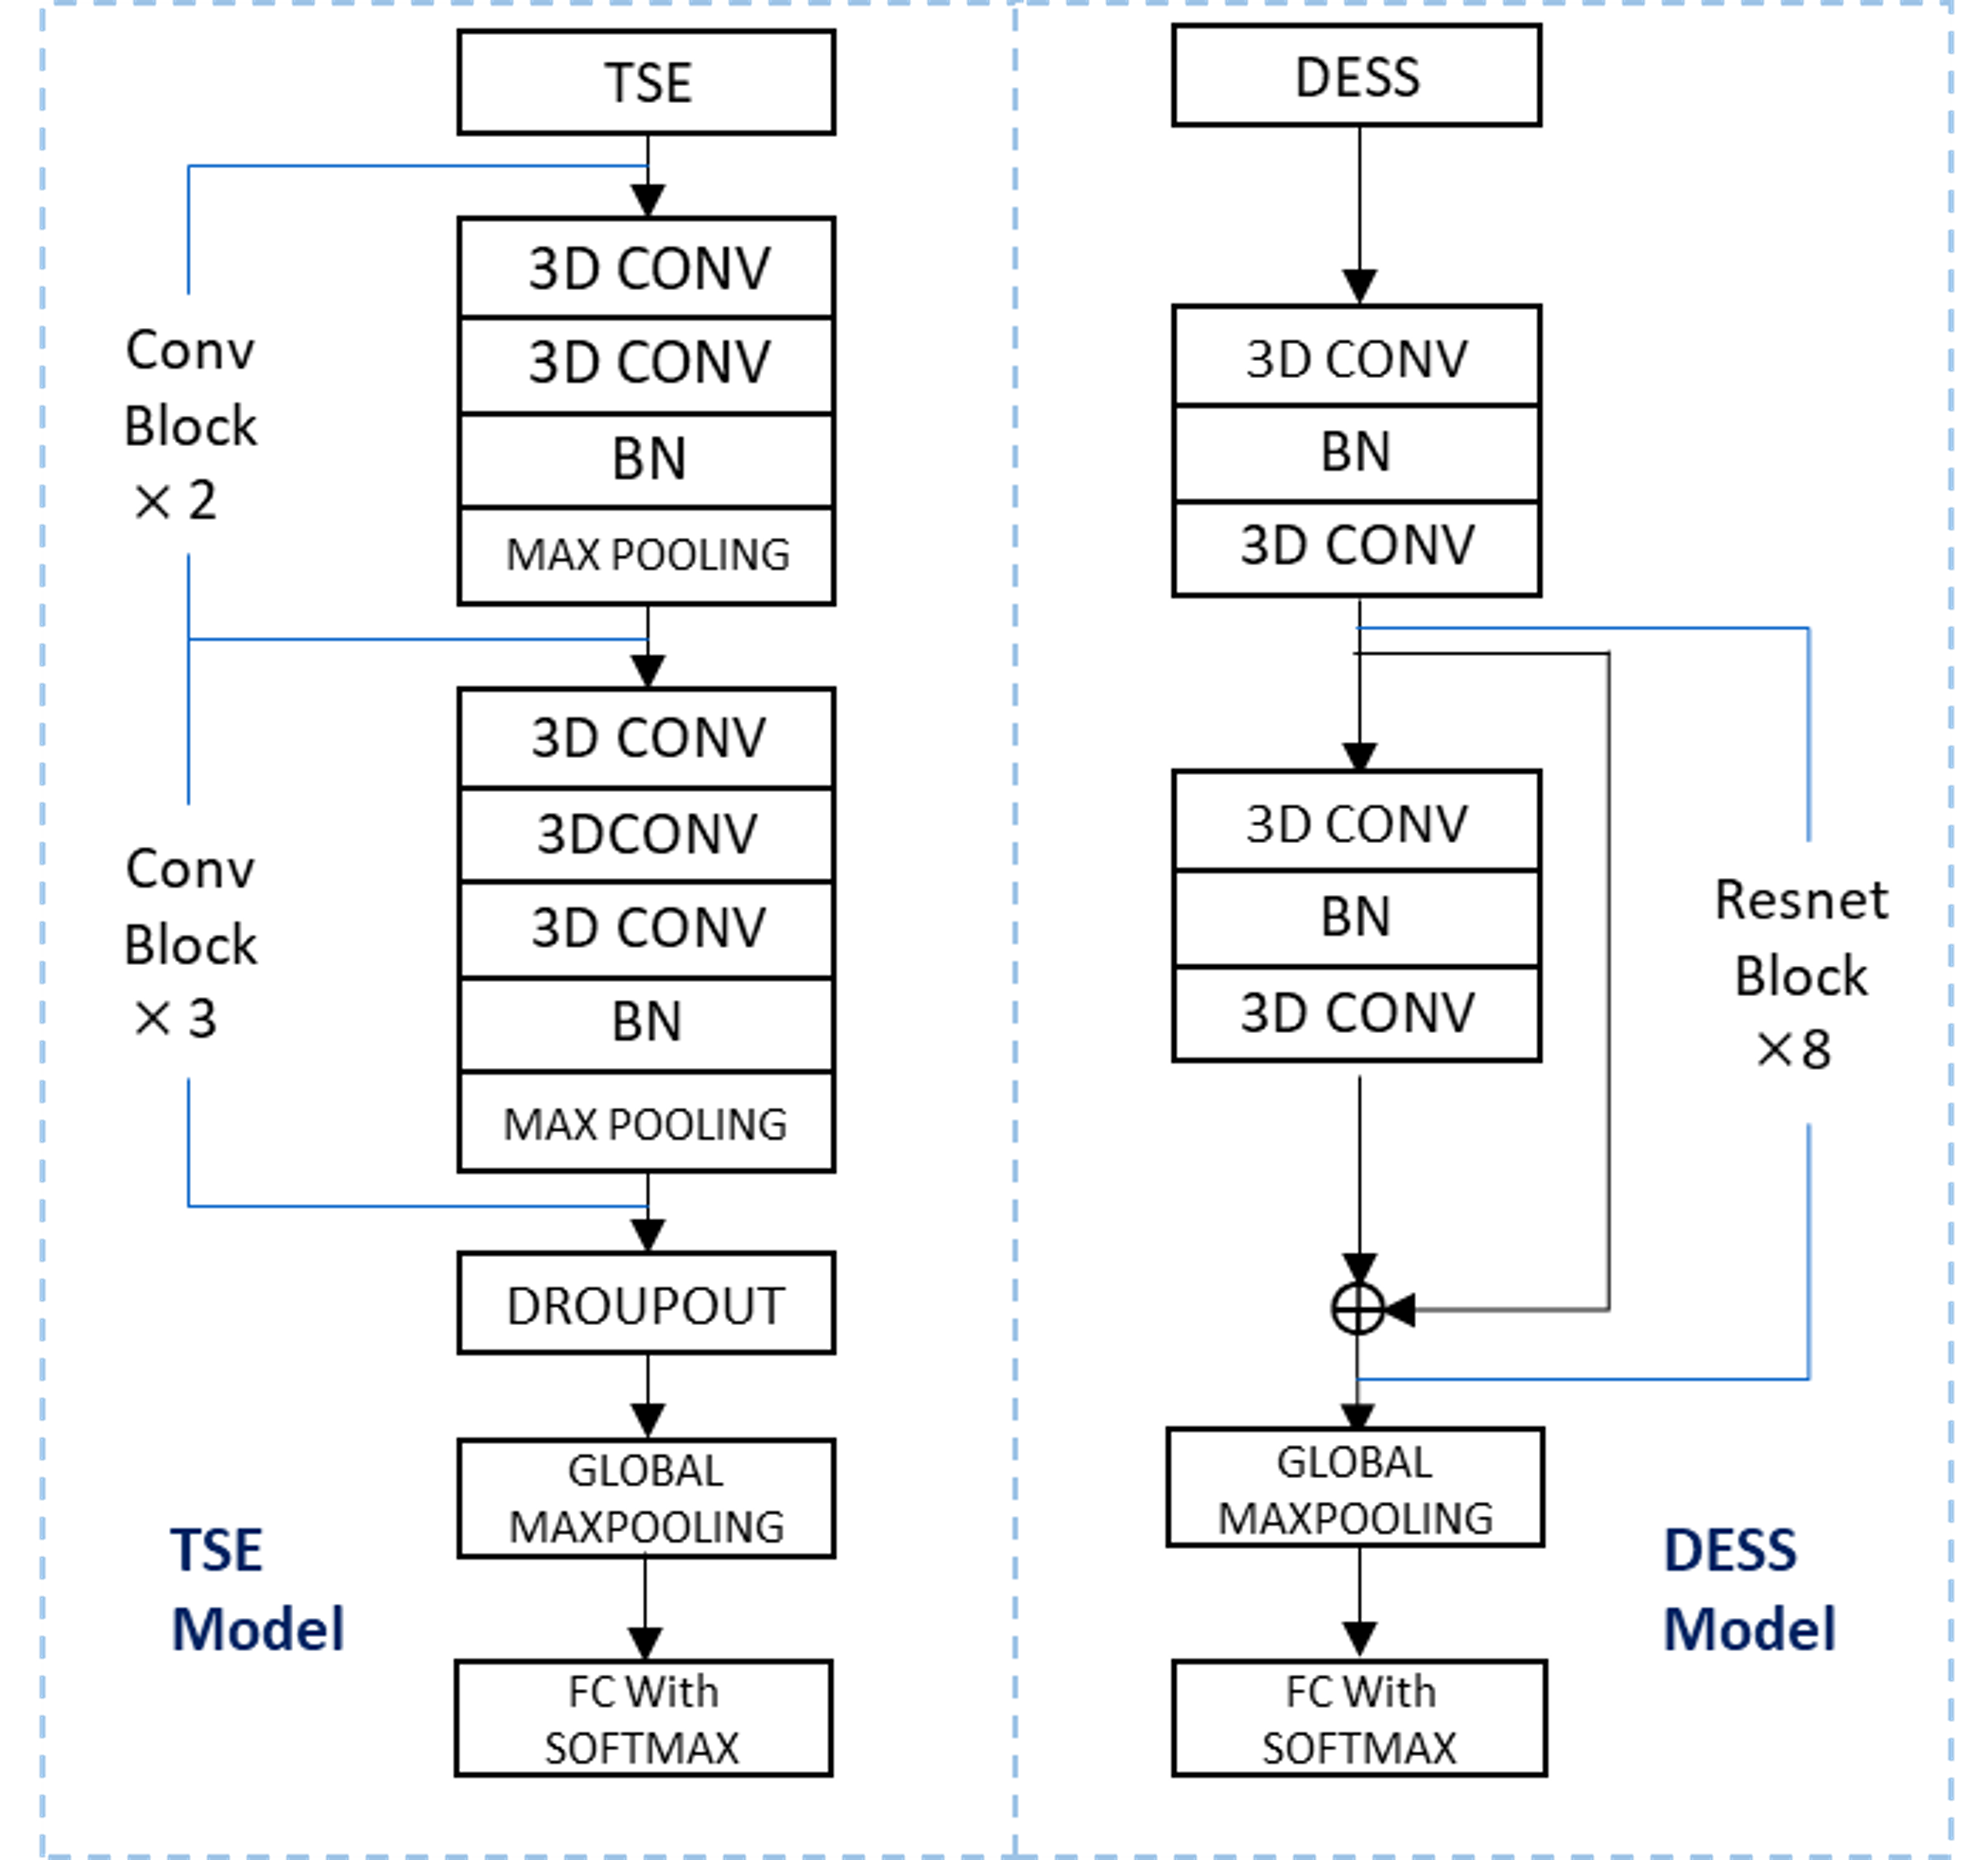
We developed two 3D models with a binary target variable to predict TKR using structural MRI. TSE images were used to design TSE-model using 5 consecutive convolution blocks. DESS images were used to design DESS-model using 8 consecutive resnet blocks7 (Figure 1). Our third model combines the output of first two models by averaging the subjects probability of receiving TKR (Ensemble-model). Using the demographic and clinical data, we developed a reference logistic regression model (LR-clinical)8 with baseline age, gender, race, BMI, KOOS Quality of Life score9 and WOMAC pain score10 as features. In order to understand the CNN’s learning behavior, we presented occlusion maps to get the discriminative image regions used by a CNN to identify the subjects TKR outcome.
Result
Receiver operating curve (ROC) analysis of designed models is shown in Figure 2. Both TSE and DESS models achieved the area under the ROC curve (AUC) of 0.86±0.01 that is significantly higher than the LR-clinical model (AUC: 0.77±0.02, p<0.01). Incorporating the output of the DL models into LR-clinical model improved the prediction performance (AUC: 0.88±0.02).
Figure 3 and 4 shows a visualization of the regions in which TSE-model and DESS-model uses to make a decision with high impact, respectively. The heat map overlaid on the exemplary MR images were generated by systematically occluding the portions of the input image and monitoring the output of a classifier.11 Figure 4 clearly shows that the TSE-model model pays attention to the locations on which where OA has immediate impacts, such as cartilage, as the probability of the correct class drops significantly. More interestingly, as indicated by the green arrow in the second row, TSE-model also uses the information from the front of the knee cap where prepatellar bursitis was diagnosed for this patient. For this patient, we found that both cartilage and bursa were playing a role in models decision for TKR probability. In addition, DESS-model incorporates the complementary information from cartilage, posterior intercondylar notch and posterior cruciate ligament to predict the TKR outcome for the Subject 2 (Figure 4).
Discussion and Conclusion
We present an automated method to identify OA-relevant imaging biomarkers for the prediction of TKR probability using 3D CNN and structural MR images. Our preliminary results suggest that the use of 3D CNNs provides a significantly better estimation of TKR within 9 years compared to a model using demographic and clinical information. This was achieved by extracting an ensemble of features directly from MR images without specifying the locations/features from the knee. Moreover, combining MR images with different contrast and resolution helped improving the predictive power of DL models. In the future, we plan to design a general model to incorporate other available MR imaging sequences from OAI’s dataset into our CNN-based modelling approach. In addition, we would like to see how DL models perform against quantitative mean cartilage thickness change over 2 years calculated in the central medial tibiofemoral compartment.12Acknowledgements
This work was performed under the rubric of the Center for Advanced Imaging Innovation and Research (CAI2R, www.cai2r.net), an NIBIB Biomedical Technology Resource Center (NIH P41 EB017183).References
1. Carballido-Gamio J et al. Magn Reson Med. 2011;65(4):1184-1194. doi:10.1002/mrm.22693
2. Kazakia GJ et al. Osteoarthritis Cartilage. 2013;21(1):94-101. doi:10.1016/j.joca.2012.09.008
3. Wang L and Regatte RR. J Magn Reson Imaging. 2014;00. doi:10.1002/jmri.24677
4. Neogi T et al. Arthritis Rheum. 2013;65(8):2048-2058. doi:10.1002/art.37987
5. Peterfy CG et al. Osteoarthr Cartil. 2008;16(12):1433-1441. doi:10.1016/j.joca.2008.06.016
6. Rosenbaum PR and Rubin DB. Biometrika (1983) 70:4155
7. He, Kaiming, et al. "Deep residual learning for image recognition." Proceedings of the IEEE conference on computer vision and pattern recognition. 2016
8. Hochberg, M.C. et al. Osteoarthritis and Cartilage (2013) Volume 21, S11.
9. Roos EM, Roos HP, Lohmander LS, Ekdahl C, Beynnon BD. Knee Injury and Osteoarthritis Outcome Score (KOOS)—Development of a Self-Administered Outcome Measure. J Orthop Sport Phys Ther. 1998;28(2):88-96. doi:10.2519/jospt.1998.28.2.88
10. Bellamy N, Buchanan WW, Goldsmith CH, Campbell J, Stitt LW. Validation Study of WOMAC: A Health Status Instrument for Measuring Clinically Important Patient Relevant Outcomes to Antirheumatic Drug Therapy in Patients with Osteoarthritis of the Hip or Knee. J Rheumatol. 1988;15(12):1833-1840. doi:10.1186/1471-2474-13-168.
11. Zeiler, M. D., & Fergus, R. (2014). In European conference on computer vision (pp. 818-833). Springer, Cham.
12. Eckstein F, Kwoh CK, Boudreau RM, et al. Quantitative MRI measures of cartilage predict kneereplacement: A case-control study from the Osteoarthritis Initiative. Ann Rheum Dis. 2013;72(5):707-714. doi:10.1136/annrheumdis-2011-201164.
13. DeLong ER, DeLong DM, Clarke-Pearson DL. Comparing areas under two or more correlated reciever operating characteristics curves: a nonparamentric approach. Biometrics. 1988;44(3):837–845.
Figures