4878
Characterizing MRI Biomarkers for Conversion Prediction of Preclinical Mild Cognitive Impairment1School of Computer Science, Northwestern Polytechnical University, Xi'an, China, 2Department of Radiology and BRIC, University of North Carolina at Chapel Hill, Chapel Hill, NC, United States, 3School of Medicine, Shanghai Mental Health Center, Shanghai Jiao Tong University, Shanghai, China
Synopsis
Identifying subjects at the stage of preclinical mild cognitive impairment (pre-MCI) is fundamental for early intervention of pathologic cognitive decline. This study aims to investigate the progression from cognitive normal (CN) and subjective cognitive decline (SCD) to MCI, by characterizing imaging biomarkers in brain MRI data via a deep-learning framework. This deep-learning framework is designed to first evaluate the discriminative capability of regions-of-interest (ROIs) in brain MR images, and then to predict the progression of CN/SCD subjects to MCI within 36 months. The results suggest that brain structure changes at the pre-MCI stage can be objectively detected in MR images by our method.
Background
Identifying subjects at the stage of preclinical mild cognitive impairment (pre-MCI), such as subjective cognitive decline (SCD), is fundamental for early intervention of pathologic cognitive decline1. Extensive studies have shown that structural magnetic resonance imaging (MRI) provides objective biomarkers for automated diagnosis of Alzheimer’s disease (AD) and its prodromal stage (i.e., MCI). However, most of the previous studies do not focus on the pre-MCI stage (e.g., SCD). For early treatment, it’s essential to characterize MRI biomarkers for measuring the difference between cognitive normal (CN) subjects who would convert to MCI and those who would not convert to MCI. This study aims to investigate a deep-learning-based framework for conversion prediction of pre-MCI (i.e., the progression from CN/SCD to MCI), by characterizing imaging biomarkers in brain MRI data.Method
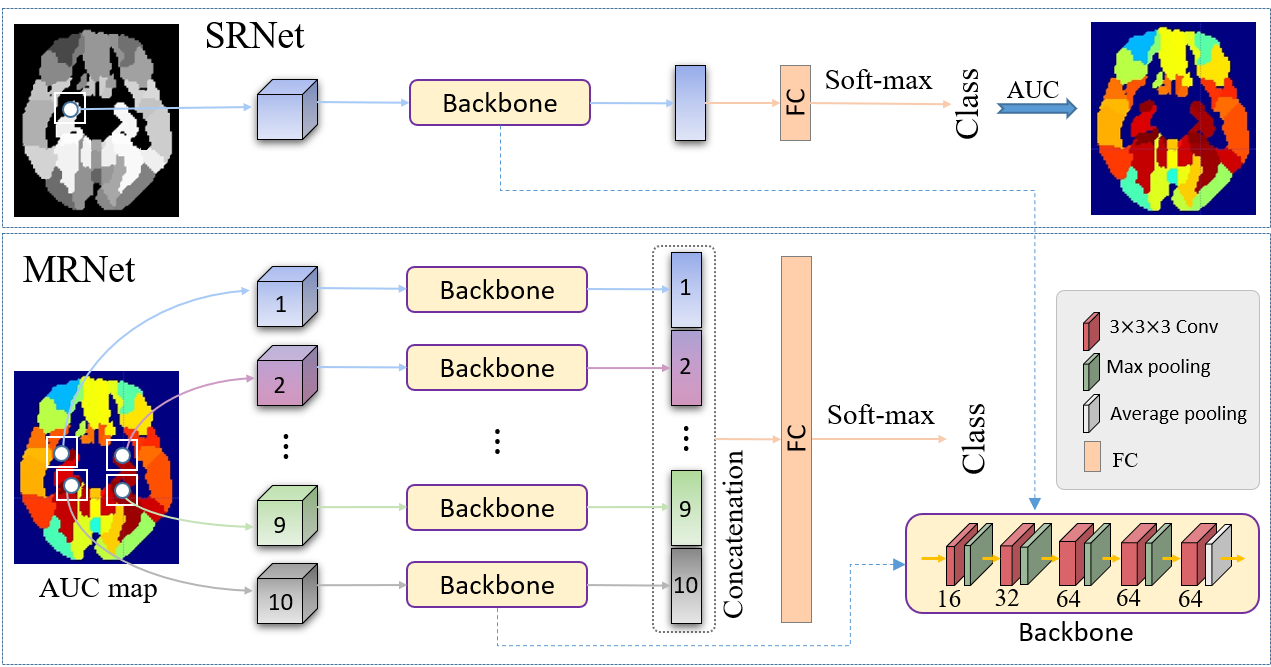
Motivated by previous disease diagnosis systems with MRI2, we create a unique deep-learning framework for pre-MCI conversion prediction, by evaluating the discriminative capability of single region-of-interest (ROI) or multiple ROIs in the brain. Our framework is illustrated in Fig. 1, including two steps: 1) a single-ROI-based network (SRNet) with a backbone module for locating the informative regions in the brain, and 2) a multi-ROI-based network (MRNet) with 10 backbone modules for pre-MCI conversion prediction. The backbone modules in both SRNet and MRNet share the same structure, containing five 3x3x3 convolutional layers (with ReLU), and the channels for these convolutional layers are 16, 32, 64, 64 and 64, respectively. The former 4 convolutional layers are followed by max-pooling with a 2-voxel stride, and the 5th is followed by average pooling. The input of each backbone is a local patch (32x32x32), and the output is a 64-dimensional vector.
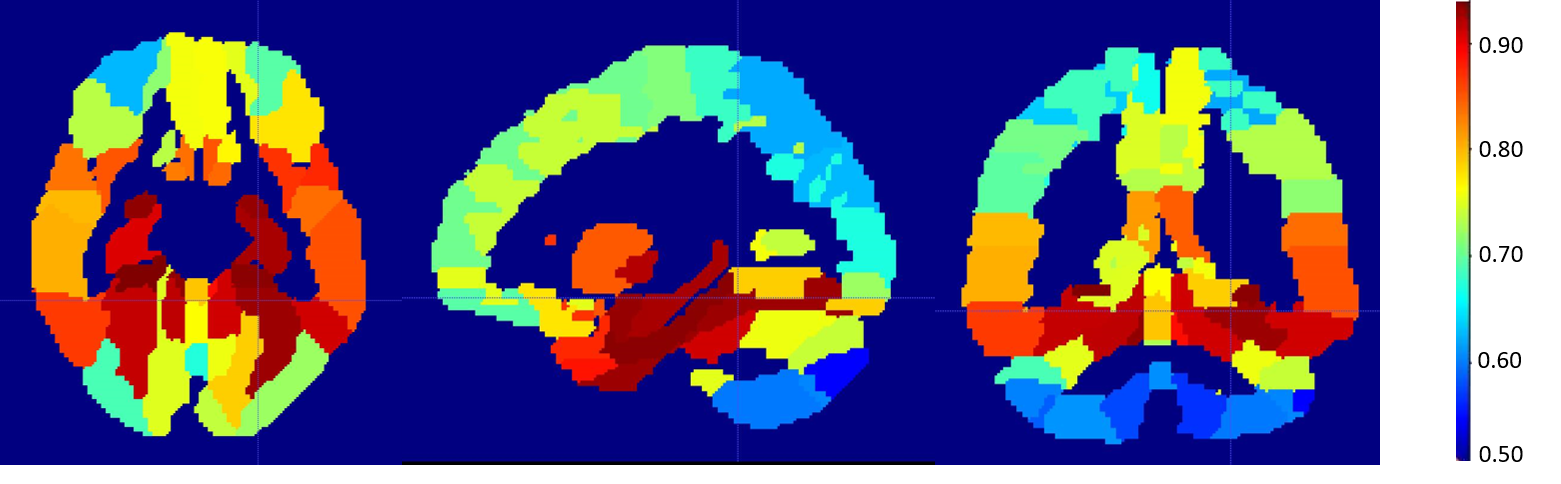
In the 1st step, we design the SRNet to evaluate the discriminative capability of each of the 116 ROIs in the AAL template3. The SRNet contains a single backbone (corresponding to an ROI) and 1 fully-connected (FC) layer followed by the soft-max activation. We first train each SRNet for each ROI based on the patches extracted from the centroid of this ROI to record the AUC value in AD vs. CN classification. We then rank these ROIs according to their discriminative capabilities (regarding AUCs) and select 10 top-AUC ROIs as brain locations.
In the 2nd step, we train the MRNet for pre-MCI conversion prediction. The MRNet first stacks 10 backbones and then concatenates their outputs for a subsequent FC layer. These 10 parallel backbones share the same parameters. Its input consists of 10 local patches centered at pre-selected ROIs in each MRI, while its output is the corresponding class label.
We use 845 subjects with baseline MRI in ADNI-14 to train SRNet and MRNet. All images are processed with skull-stripping and spatial normalization. To balance the sample size in each category, we use both AD and progressive MCI (within 3 years) patients as positive samples, while CN and stable MCI (within 3 years) subjects as negative samples. The output of MRNet is the probability of each subject converting to AD within 3 years. We then apply the model trained on ADNI-1 to ADNI-2 (with 321 subjects, including 209 CNs and 112 SCDs). Among these 321 testing subjects, 18 CN (pCN) and 11 SCD (pSCD) subjects are absolutely converted to MCI within 3 years, 113 CN (sCN) and 5 SCD (sSCD) subjects are absolutely not converted to MCI, and the remaining CN (rCN) and SCD (rSCD) subjects are unsure due to lacking the 3rd-year scans.
Result
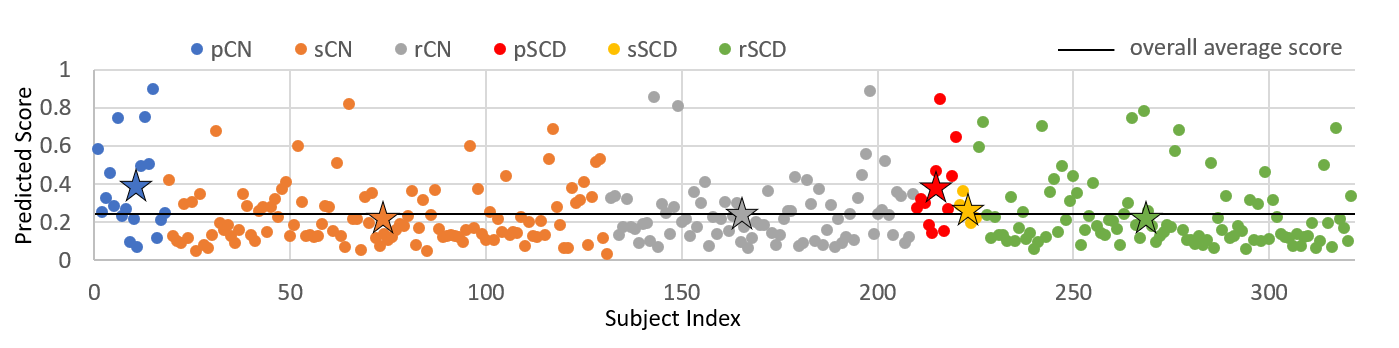
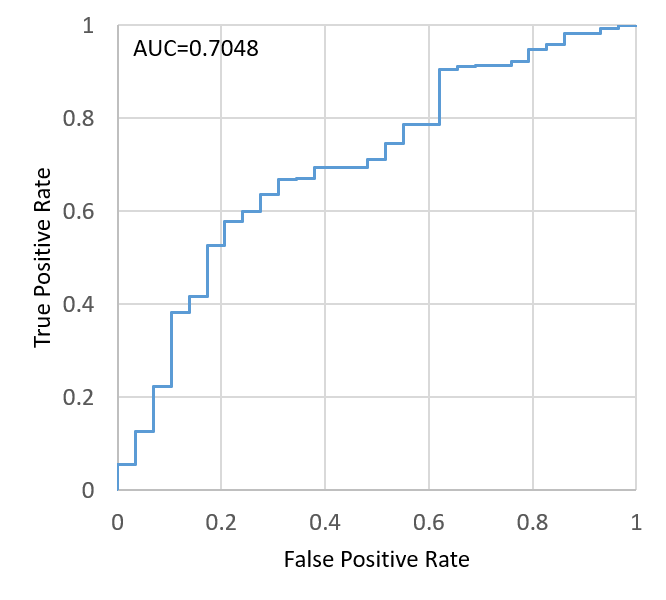
We illustrate the probability scores of all testing subjects estimated by our method in Fig. 3, where the subjects are roughly sorted by their stages. The overall average score is 0.2449, while those of pCN, sCN, pSCD and sSCD groups are 0.3763, 0.2240, 0.3688 and 0.2663, respectively. We can see that the average scores of pCN and pSCD are obviously higher than those of other groups. We further test the hypothesis that pCNs and pSCDs have higher scores than the others, which is supported by the resulting p-value of 0.0027. The receiver operating characteristic (ROC) curve is provided in Fig. 4. The AUC value is 0.7048, and the SPE and SEN are 0.6667 and 0.6897 (with the threshold of the overall average score). These results suggest that the brain structure changes at the pre-MCI stage can be objectively detected in MR images by our method.Conclusion
This study develops an ROI-based deep-learning framework to predict the progression of CN/SCD subjects to MCI within 36 months. Experimental results suggest that our method can identify the CN/SCD subjects who would be diagnosed as MCI within 3 years, which is helpful for early diagnosis.Acknowledgements
This research was supported in part by NIH grants EB008374, AG041721, AG042599, EB022880, in part by the National Natural Science Foundation of China under Grants 61471297 and 61771397, and in part by Innovation Foundation for Doctor Dissertation of NPU under Grants CX201835. Data collection and sharing for this project was funded by the Alzheimer’s Disease Neuroimaging Initiative (ADNI).References
1. A.J. Mitchell et al., Acta Psychiatrica Scandinavica 130 (2014), 439-451.
2. M. Liu et al., Med. Image Anal. 43 (2018), 157–168.
3. N. Tzourio-Mazoyer et al., NeuroImage 15 (2002), 273-289.
4. C.R. Jack et al., J. Magn. Reson. Imaging 27 (2008), 685–691.
Figures