4877
Deep neural network processing of original DCE-MRI data for survival prediction1St Jude Children's Research Hospital, Memphis, TN, United States
Synopsis
DCE-MRI is a valuable tools in many clinical applications, but data analysis is complex. The purpose of this study was to assess whether the original DCE images without complex modeling can be used to predict the clinical results of osteosarcoma using deep convolution neural network (DCNN). We also assess whether the prediction from original images were different from those using the kinetic parameters. We found that DCNN can predict overall survivals with an accuracy of about 0.8 using a set of 2D DCE tumor images, which is not significantly different from results based on kinetic parameter maps.
Introduction
DCE-MRI was commonly used to assess clinical results such as response, overall survival, and event free survival (EFS). DCE-MRI data analysis is complex requiring the choice of the kinetic models, the selection of arterial input function (AIF), and accuracy of the intrinsic baseline T1 maps1. Osteosarcoma (OS) is the most common bone tumor in children. Due to the high heterogeneity of OS, no reliable earlier biomarker was reported before for the clinical results2,3. Deep convolution neural networks (DCNN) are well suited to classify the images and predict the results4. In this study, we developed a DCNN with 26 layers to investigate whether we can predict the clinical results of OS subjects directly from one slice of DCE-MRI tumor images without complex processing. We compared the results with those based on kinetic parameters (ktrans, kep, ve, and vp) from the pharmacokinetic model.Methods
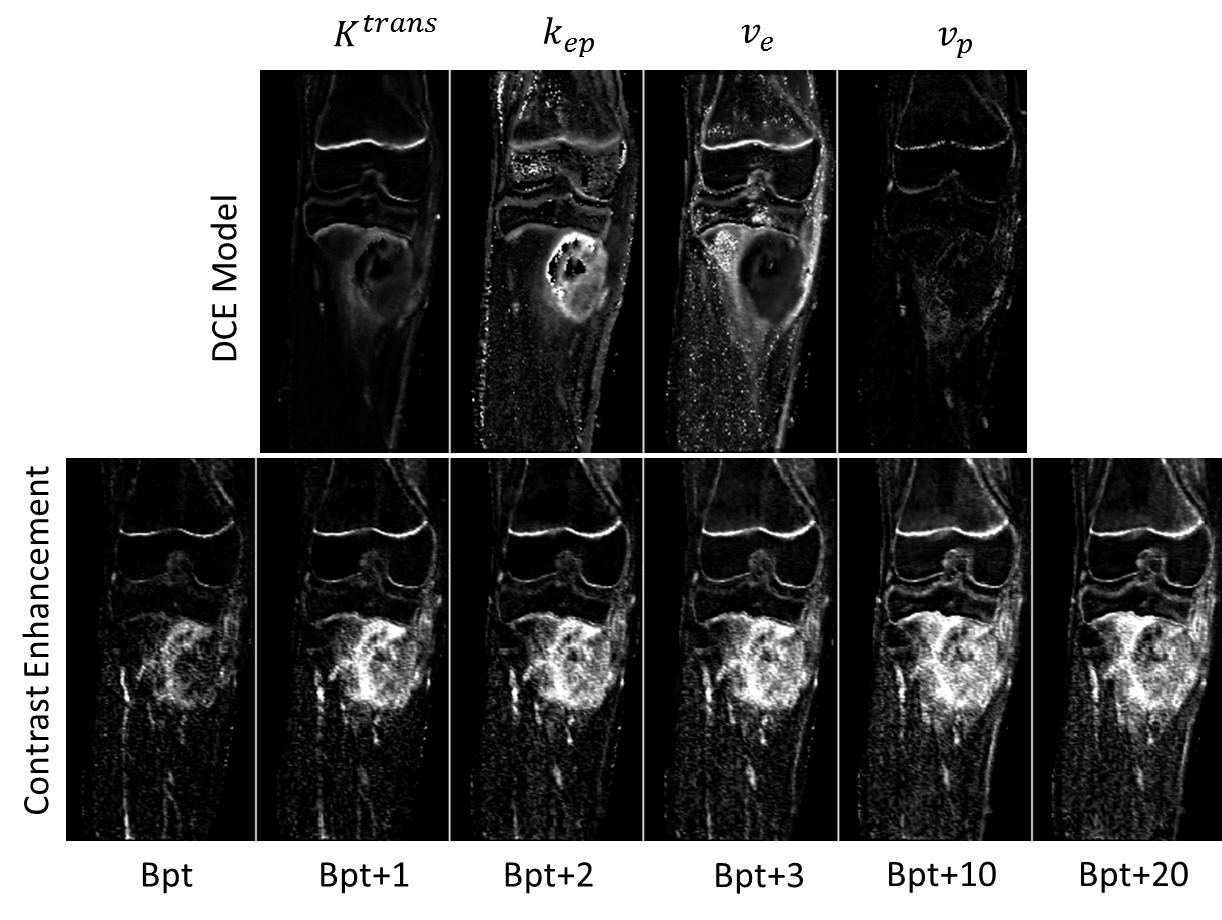
In a retrospective study, 37 pediatric patients with OS untreated on a phase II trial were included. DCE-MRI data were acquired at different stages to monitor the treatment before surgery. In this study, four serial DCE-MRI examinations at the baseline, on day-2, on day1, and day5 were included for DCNN training (all these exams were all within about 7 days of the first treatment). All 37 patients had at least one of the above four DCE-MRI examinations. DCE-MRI data were acquired on a 1.5 T Siemens MRI scanner. 16 slices covered all or part of tumors. The total acquisition had 50 phases with temporal resolution of 7 seconds. DCE-MRI Data were preprocessed in two ways: 1), the pre-contrast image was subtracted from each of the dynamic images (original data); 2), the data were fitted using a two-compartment pharmacokinetic model to generate four parametric maps (the model data): Ktrans, kep, ve, and vp1. Histologic response was assessed at week 10 after definitive surgery. Responders were defined as ≥ 90% necrosis and nonresponders as < 90%.
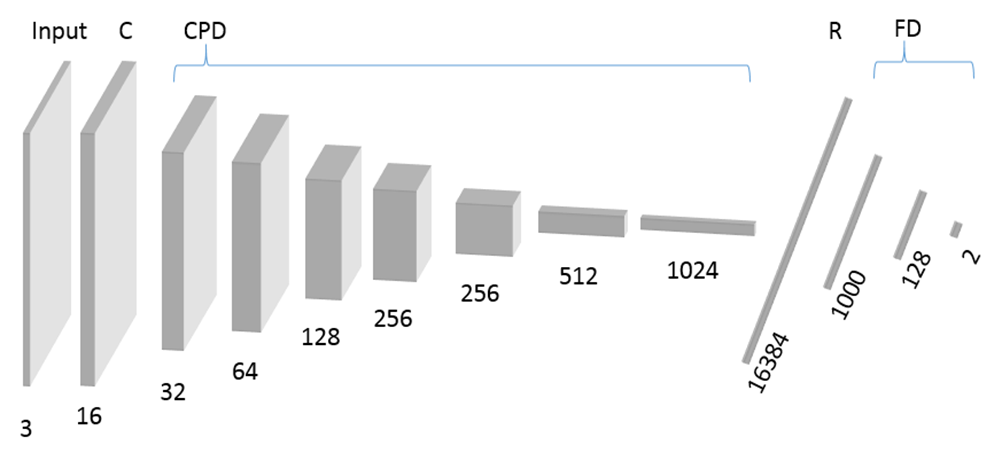
We built and trained a DCNN net with 26 layers in Figure 1. The software include Keras and tensorflow. All DCE data were divided into training (~80%) and testing (~20%) sets for each of three cases: 1) responders vs. non-responders, 2) EFS survivors vs. non-event free patients, 3) overall survivors vs. expired patients. Multiple slices (3 to 12) were selected covering the central part of tumor, which were further augmented using rotation and shift with a factor of 32. Total number of training and testing data sets were 20000 vs. 5664 for response, 21312 vs. 5024 for EFS, 20384 vs. 5952 for overall survival. Two epochs and a batch size of 150 were used in training. In addition, a tumor mask was applied to the images and used for a separate training and testing. The training were repeated five times to test the stability of the prediction.
Results
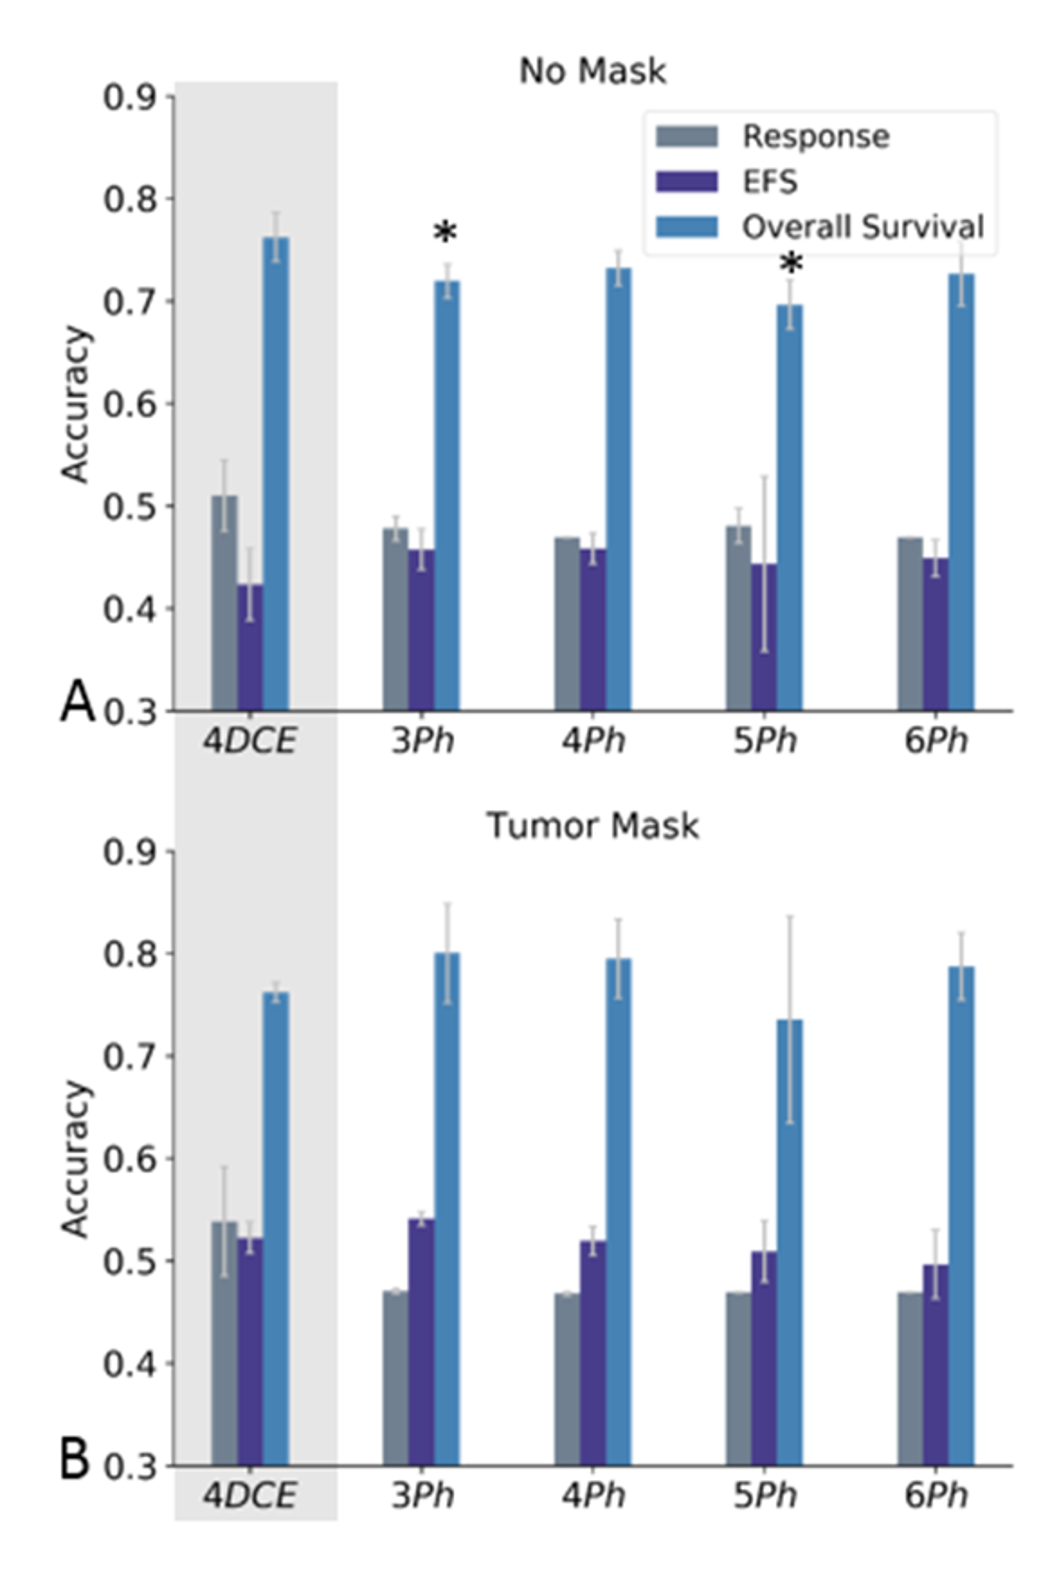
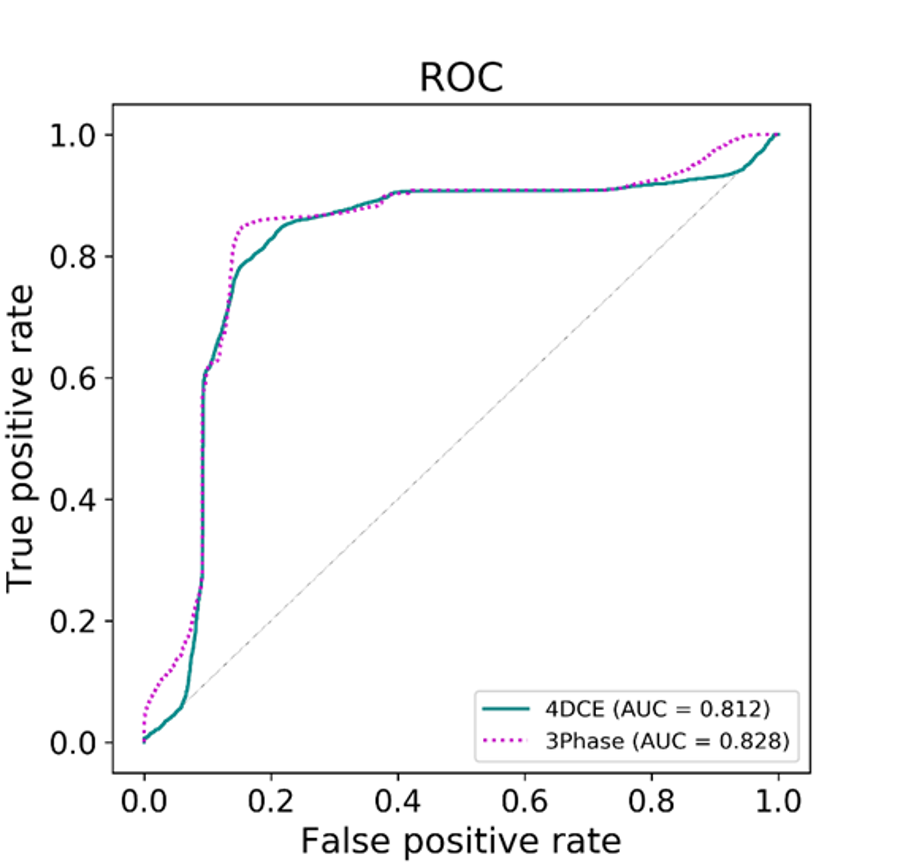
Figure 2 shows examples of input data: the model data and the original data. The number of channels for the input data were four for the model data, and 3 to 6 for the original data. Figure 3 shows the results of prediction using images without a tumor mask (A) and with a tumor mask (B). We can predict overall survival accurately using either data set. The prediction using three or five phases of the original data may be significantly lower than the model results without a tumor mask. However, there is no significant difference between two results when using a tumor mask in Figure 3B. We cannot accurately predict response and EFS using either data set. We didn’t achieve better accuracy using more phases of the original data. In addition, ROC analysis were used to assess the accuracy of prediction of overall survival with both types of data. The selected ROC curves were computed and shown in Figure 4. The AUC of 0.812 using the model data (4DCE) is close to 0.828 using 3 phases of the original data (3Phase).Discussion / Conclusion
Our results reveal that the DCNN can predict the overall survival accurately using both raw dynamic images and modeled data, which haven’t been accomplished before. The DCNN using the original DCE data can achieve similar accuracy to those using the model data. By using the deep neural network, the complex DCE-MRI processing using a pharmacokinetic model may not be necessary for predicting clinical results. In conclusion, DCNN is a promising tool to predict overall survival of OS subjects using the original DCE-MRI data.Acknowledgements
No acknowledgement found.References
1. Tofts PS, et al. Estimating kinetic parameters from dynamic contrast-enhanced T1-weighted MRI of a diffusible tracer: standardized quantities and symbols. JMRI, 1999; 10(3):223-232.
2. Reddick WE, et al. Dynamic magnetic resonance imaging of regional contrast access as an additional prognostic factor in pediatric osteosarcoma. Cancer, 2001;91(12):2230-2237.
3. Guo J, et al. Assessing vascular effects of adding bevacizumab to neoadjuvant chemotherapy in osteosarcoma using DCE-MRI. BJC, 2015; 113:1281-1288.
4. LeCun Y, et al. Deep learning. Nature,2015; 521:436–444
Figures