4875
Automatic detection of age- and sex-related differences in human brain morphology1Department of Radiology and Hotchkiss Brain Institute, University of Calgary, Calgary, AB, Canada, 2School of Electrical and Computer Engineering, University of Campinas, Campinas, Brazil, 3Institute of Physics IFGW, University of Campinas, Campinas, Brazil, 4Brazilian Institute of Neuroscience and Neurotechnology, University of Campinas, Campinas, Brazil, 5Institute of Systems Engineering and Information Technology, Universidade Federal de Itajubá, Itajubá, Brazil, 6Department of Computer Science, Universidade Federal de São Carlos, São Carlos, Brazil, 7Department of Computing Science, University of Alberta, Edmonton, AB, Canada, 8Department of Radiology, University of Calgary, Calgary, AB, Canada, 9Seaman Family Centre, University of Calgary, Calgary, AB, Canada
Synopsis
Research on neurological and mental disorders has shown the diagnostic potential of volumetric brain analysis, also evidencing differences of human brain structures regarding sex and aging in normal subjects. This study aims at identifying the most important volumetric sex- and age-related differences of brain structures using machine learning approaches. It was found that the most important brain structures were different for age- and sex-related differences, which should be taking into account when diagnosing neurological and mental disorders based on morphological features.
Introduction
Multiple previous studies identified age- and sex-related differences of the human brain Understanding those differences is important when diagnosing, studying, and treating neurological and mental disorders. For example, atrophy of brain structures like the hippocampus, amygdala, and temporal lobe is known to be related to Alzheimer's and Parkinson's disease5, but can also be attributed to normal aging3. Additionally, volumetric differences of brain structures such as the amygdala, hippocampus, and insula have been described comparing males and females2. However, these structures are also known to be affected by the development of neuropsychiatric conditions, e.g. autism, depression, schizophrenia, and others2. Thus, age- and sex-related differences need to be considered when diagnosing any mental or neurological disease. The aim of this work is to identify the most important age- and sex-related volumetric differences in human brain structures by using a machine learning approach.Materials and methods
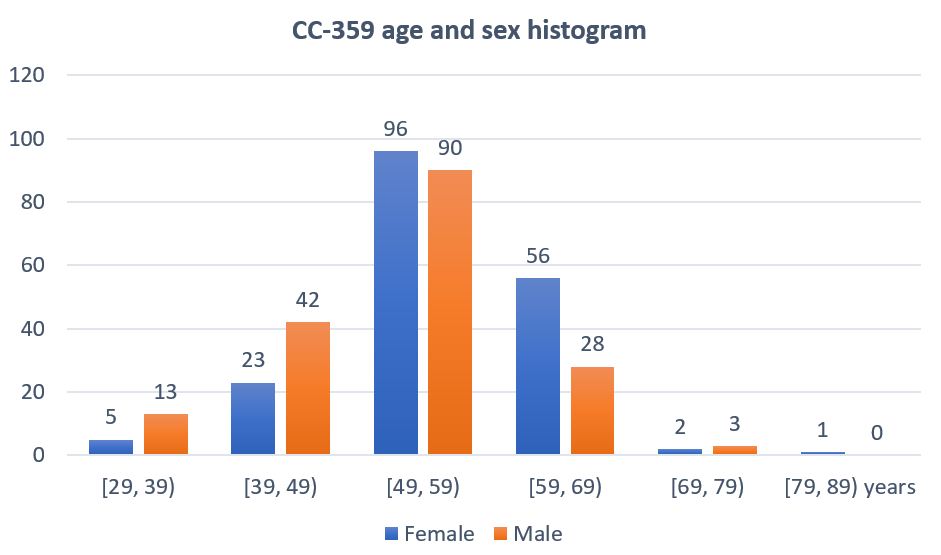
The Calgary-Campinas-359 (CC-359) database6 was used for this study. It contains 359 T1-weighted magnetic resonance (MR) volumetric brain images from healthy subjects of different sex (176 male and 183 female) and age (29 to 71 years). Its distribution is shown on Figure 1.The T1-weighted MR images were processed using the Freesurfer software, version 6.0.07. It combines an atlas-based method8 with the watershed algorithm to identify and calculate the volume of 37 brain structures, such as the amygdala, hippocampus, insula, and others. The volumetric measurements were used as features for an age prediction and sex classification using the machine learning software tool Weka, version 3.99. Multiple machine learning approaches were evaluated for the two problems, whereas sex was used as an additional feature for the age estimation while age was used as an additional feature for the gender classification. The best machine learning approach (classification for gender and regression for age prediction) was identified by evaluating and comparing the accuracies for the sex classification or mean absolute age prediction error using 5-fold cross validation. The relevance of of the morphological features were determined for the best age-prediction and sex-classification machine learning model for qualitative analysis.Results
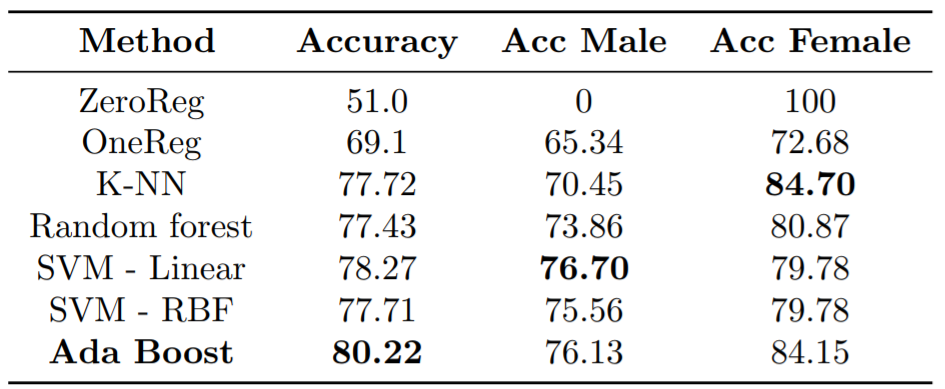
For sex classification, the AdaBoost classifier11 reached the highest accuracy of 80.22%. Accuracy results for other classifiers can be seen on Figure 2. The top five most important volumetric features the AdaBoost classifier selected (in descending order) are the total volume of the brain, the right ventral part of the diencephalon, the left putamen, the optic chiasm, and the posterior region of the corpus callosum. Statistical analysis showed that the first four volumes are larger in male subjects.
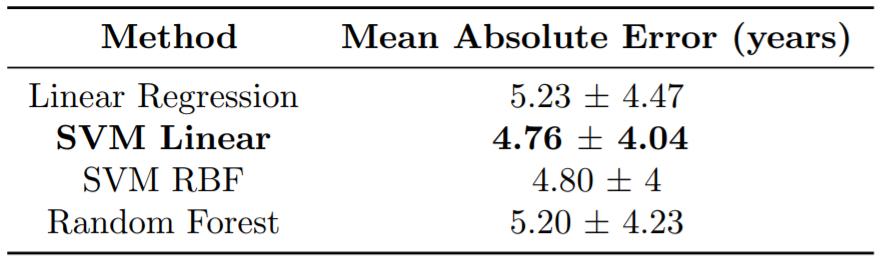
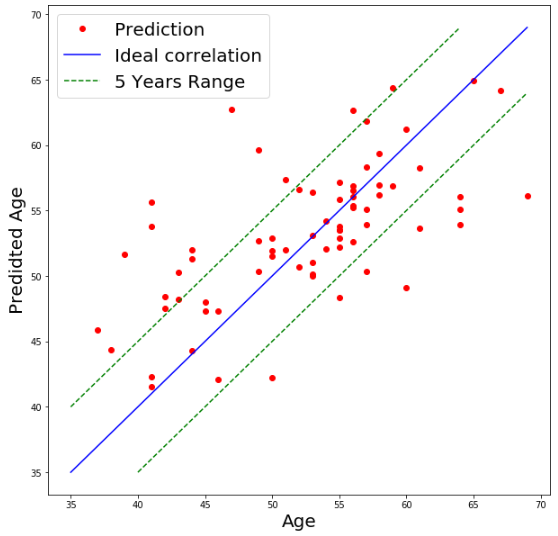
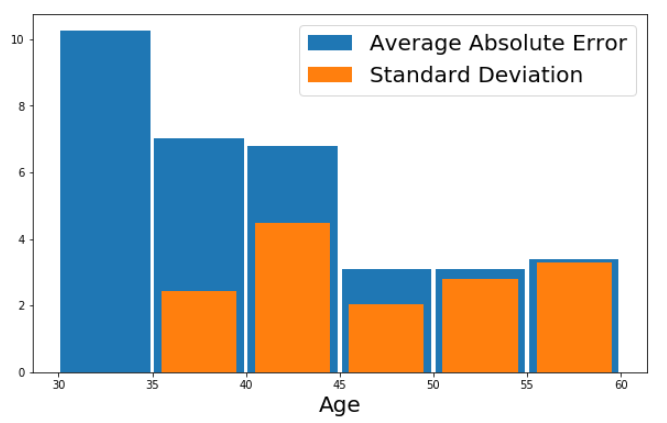
For the age prediction problem, the best regression model was the Support Vector Machine (SVM), with a linear kernel. Mean absolute errors for other regression models can be seen on Figure 3. The SVM model was able to predict the brain age with a mean absolute error of 4.76 years. A plot of the results can be seen in Figure 4, and the SVM mean absolute error, calculated for different age ranges, is depicted in Figure 5. In this case, the most relevant volumeric features were the lateral occipital cortex, transverse temporal cortex, rostral middle frontal cortex, and absolute brain volume.
Discussion
In case of sex classification, it was found that four of the top five most discriminant features between females and males presented larger volumes in males, while the last one was larger in females. There is controversy in scientific literature regarding which structures present larger volumes depending on the sex of the subject2. However, it should be noted that the Adaboost algorithm could automatically identify the importance of the volume of structures such as the whole brain, putamen, and corpus callosum, which is in line with previous research2. In the experiments related to age regression, it was observed that the developed method results in a low mean age prediction error, especially in the age range that contains more samples in the database, as it can be seen in Figure 5.Conclusion
The present work shows the utility of medical image processing methods to automatically identify age- and sex-related volumetric differences of human brain structures. In experiments conducted on a cohort of 359 healthy subjects, the algorithms could successfully identify the sex and age of the subjects, with accuracy of 80.22% and mean absolute error of 4.76, respectively. Additionally, the algorithms identified the most important features to differentiate the age and sex of the subject, which agree with previous results published in scientific literature.Acknowledgements
No acknowledgement found.References
1) Cosgrove, K. P., Mazure, C. M., and Staley, J. K. (2007). Evolving knowledge of sex differences in brain structure, function, and chemistry. Biological psychiatry, 62(8), 847-855.
2) Ruigrok, A. N., Salimi-Khorshidi, G., Lai, M. C., Baron-Cohen, S., Lombardo, M. V., Tait, R. J., and Suckling, J. (2014). A meta-analysis of sex differences in human brain structure. Neuroscience and Biobehavioral Reviews, 39, 34-50.
3) Good, C. D., Johnsrude, I. S., Ashburner, J., Henson, R. N., Friston, K. J., and Frackowiak, R. S. (2001). A voxel-based morphometric study of ageing in 465 normal adult human brains. Neuroimage, 14(1), 21-36.
4) Fjell, A. M., and Walhovd, K. B. (2010). Structural brain changes in aging: courses, causes and cognitive consequences. Reviews in the Neurosciences, 21(3), 187-222.
5) Hu, M. T. M., White, S. J., Chaudhuri, K. R., Morris, R. G., Bydder, G. M., and Brooks, D. J. (2001). Correlating rates of cerebral atrophy in Parkinson’s disease with measures of cognitive decline. Journal of neural transmission, 108(5), 571-580.
6) Souza, R., Oeslle, L., Garrafa, J., Gobbi, D., Saluzzi, M., Appenzeller, S., Rittner, L., Frayne, R., and Lotufo, R. (2017). An open, multi-vendor, multi-field-strength brain MR dataset and analysis of publicly available skull stripping methods agreement. NeuroImage, 170, 482-494.
7) Dale, A. M., Fischl, B., and Sereno, M. I. (1999). Cortical surface-based analysis: I. Segmentation and surface reconstruction. Neuroimage, 9(2), 179-194.
8) Fischl, B., Salat, D. H., Busa, E., Albert, M., Dieterich, M., Haselgrove, C., van der Kouwe, A., Killiany, R., Kennedy, D., Klaveness, S., Montillo, A., Makris, N., Rosen, B., and Dale A. M. (2002). Whole brain segmentation: automated labeling of neuroanatomical structures in the human brain. Neuron, 33(3), 341-355.
9) Eibe, F., Hall, M. A., and Witten, I. H. (2016). The WEKA Workbench. Online Appendix for Data Mining: Practical Machine Learning Tools and Techniques. Morgan Kaufmann.
10) Kluyver, T., Ragan-Kelley, B., P´erez, F., and Granger, B. (2016). Jupyter Notebooks – a publishing format for reproducible computational workflows. Positioning and Power in Academic Publishing: Players, Agents and Agendas, 87-90.
11) Freund, Y., and Schapire, R. E. (1997). A decision-theoretic generalization of on-line learning and an application to boosting. Journal of computer and system sciences, 55(1), 119-139.
Figures