4861
Fetal Pose Estimation via Deep Neural Network by Detection of Fetal Joints, Eyes, and Bladder1Department of Engineering Physics, Tsinghua university, BeiJing, China, 2Department of Electrical Engineering and Computer Science, Massachusetts Institute of Technology, Cambridge, MA, United States, 3Harvard Medical School, Boston, MA, United States, 4Fetal-Neonatal Neuroimaging and Developmental Science Center, Boston Children’s Hospital, Boston, MA, United States, 5Institute for Medical Engineering and Science, Massachusetts Institute of Technology, Cambridge, MA, United States
Synopsis
Neural networks and deep learning have achieved great success in human pose estimation through the identification of key human points in conventional photography and video. We propose fetal pose estimation in a time series of
Introduction
Estimation of fetal pose in MRI (Fig 1) has applications from motion tracking during imaging to retrospective motion analysis, and kinematic modeling of fetal movement. In an ongoing study of placenta1 with EPI time series (110 subjects, 300-500 EPI volumes each, 20-30 minute observations), yielding over 44,000 volumes. Manual labeling of features for pose estimation is prohibitive and here we propose deep neural networks to identify key points. We exploit texture information at various scales and correlation among features. We draw on applications of neural networks for human pose estimates in sports and surveillance. The networks were trained to detect 15 fetal features and network performance was evaluated on in vivo time series EPI volumes.Method
Multislice EPI imaging (matrix size = 120*120*80, resolution = 3mm*3mm*3mm, TR = 3.5s) were acquired of the pregnant abdomen for fetuses at gestational age between 25 and 35 weeks. Fifteen features (ankles, knees, hips, bladder, shoulders, elbows, wrists and eyes) were labeled manually for 969 volumes in two datasets, with observations over a 20-minute and a 30-minute MRI scan. We used 550 volumes as a training set and the others for testing.
The label is of an exponential distribution. The maximum intensity is 10 and σ=2 with no truncation.
Deep neural networks were trained to generate a heatmap for each target feature, which is the pixel-wise likelihood of feature locations. Two different 3D convolutional networks, hourglass2 and Unet3 (Fig 2), were applied and evaluated in our experiments. Both architectures have an encoder with multiple scales of view and abstractions of the original data. Further, each network produces a summary of highly abstracted feature maps that encode the correlation among joints, as well as a decoder that recovers the highly abstracted feature maps to heatmaps at the original image resolution.
The two networks were trained with mean squared error loss function using an Adam optimizer with a learning rate of 1e-4 and a training batch size of 5. The training is performed on a NVIDIA 1080Ti GPU. To manage memory limitations of the current GPU cards, in the training process the input volume was randomly cropped to 64*64*64 voxels. This can also serve as a data augmentation method. In testing, a sliding window is applied to the whole volume and patches of heatmap are predicted by the networks. These patches of heatmaps are then aggregated to generate the entire heatmap. Final joint detection is provided by the maximum activations across each heatmap. For evaluation, we adapted as a metric the percentage of correct keypoints, or PCK, as is widely used in human pose estimation benchmarking. PCK(r) is defined as the percentage of predicted joints whose distance from ground truth is less than r. We used r=6mm as the threshold to calculate the number of well detected(distance <=r) and bad detected(distance>r) of two networks and used a chi-squared test to get the p-values to see whether there is a difference in performance of two networks.
Results and Discussion
Figure 3 shows the result of one example of output heatmaps. As can be seen from the PCK curve results in figure 4, given the size of the joints and a tolerable point shift, the proposed deep neural network shows promising performance of joint detection and therefore can be potentially applied in future works related to fetal motion model.
Figure 4 compares the performance of the hourglass and Unet networks. Both networks perform well on key points such as bladder and eyes that have relatively stable shape and relatively limited range of motion. In contrast, for key points such as elbows and wrists, both networks have lower detection accuracy due to the frequent and substantial movement of these joints that are smaller-scale and lower-contrast features in the low-resolution EPI volumes. P-value of left elbows shows there is a detecting difference between two networks.
Figure 5 shows the performance of the networks when evaluated on fetuses that are not in the current training set and have different length of limbs and movements. Under these conditions, the networks experience failure in detection of key points, indicating that they lack generalization and more training exposure is required for a more robust performance.
Conclusions
Deep neural networks are able to identify key features for fetal pose estimation from time frames in low-resolution, volumetric EPI data of pregnant mothers. Future work will focus on improving network generalization and performance for the more challenging features, such as wrists and elbows, which may benefit from more annotated data and a stacked or regression network4 concatenated to the current structures.Acknowledgements
NIH R01 EB017337, U01 HD087211.References
1. Luo J, Abaci Turk E, Bibbo C, Gagoski B, Roberts DJ, Vangel M, et al. In Vivo Quantification of Placental Insufficiency by BOLD MRI: A Human Study. Sci Rep 2017;7:3713.
2. Newell A., Yang K., Deng J. (2016) Stacked Hourglass Networks for Human Pose Estimation. In: Leibe B., Matas J., Sebe N., Welling M. (eds) Computer Vision – ECCV 2016. ECCV 2016. Lecture Notes in Computer Science, vol 9912. Springer, Cham
3. Ronneberger O., Fischer P., Brox T. (2015) U-Net: Convolutional Networks for Biomedical Image Segmentation. In: Navab N., Hornegger J., Wells W., Frangi A. (eds) Medical Image Computing and Computer-Assisted Intervention – MICCAI 2015. MICCAI 2015. Lecture Notes in Computer Science, vol 9351. Springer, Cham
4. Bulat A., Tzimiropoulos G. (2016) Human Pose Estimation via Convolutional Part Heatmap Regression. In: Leibe B., Matas J., Sebe N., Welling M. (eds) Computer Vision – ECCV 2016. ECCV 2016. Lecture Notes in Computer Science, vol 9911. Springer, Cham
Figures

Illustration of joints labeled using point cloud.
This is an example of the joints labeled of one dataset shown in point cloud distribution. The annotation of 1 to 15 is: left eye, right eye, left shoulder, right shoulder, left elbow, right elbow, left wrist, right wrist, bladder, left hip, right hip, left knee, right knee, left ankle, right ankle. In this dataset, according to the joints labeled, the fetus is sucking his thumb.

Illustrations of the applied hourglass (upper) and Unet (lower) networks.
For both networks, the input is is the matrix of 64*64*64 with normalization. The output is fifteen heat maps where each one indicates the location of the specific joint that this heatmap is detecting. If the network can detect one joint, there will be a hot spot on the heatmap, otherwise there will be no heat spot or a heat spot with low intensity.

Example of heat map output.
The right-side images are the slices of the output heatmap with a maximum intensity which indicates the location of the joint that is detected. The left-side images are the corresponding slices of the data. The Maximum intensity of the groundtruth is 10.

Percentage of key points, or PCK, curves at baseline and P-values.
The picture shows 4 PCK results of hourglass(hg) and Unet. Max evaluation uses the point with maximum intensity as the detected point. Mean evaluation uses a Gaussian distribution mask on the point with maximum intensity and calculates the average point location of the entire output heatmap using the mask and intensity as weight. The performance of bladder and eye is comparatively good while that of left elbow and right wrist is worse. P-value of left elbow shows there is detecting a difference between two networks.
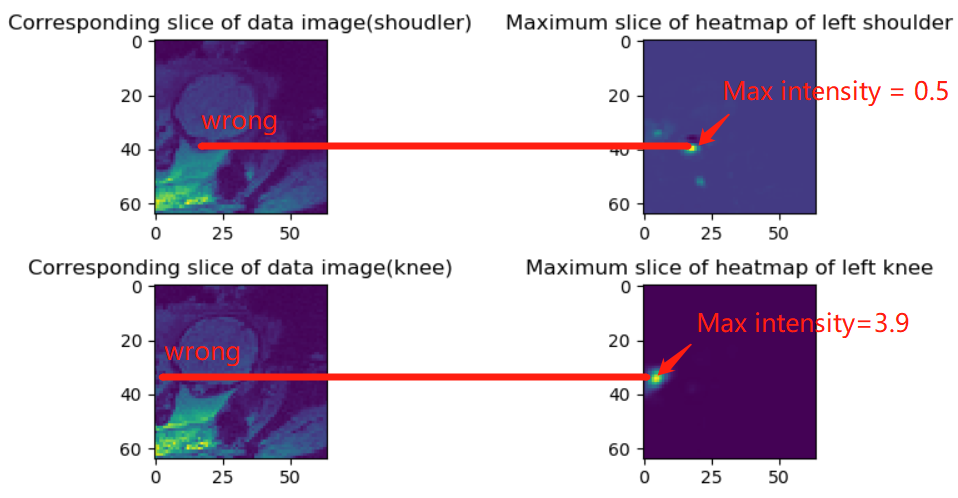
Illustration of wrong detection on a new dataset.
The heatmap(up and left) has a low maximum intensity which means it fails to detect the left shoulder. The heatmap(down and right) has a heat spot but in a wrong location meaning it fails to detect the knee. The pictures show the limitation of current networks of generalization. The Maximum intensity of the groundtruth is 10.