4852
Deep Residual Neural Networks for QSM Background Removal1Joint Department of Biomedical Engineering, Marquette University and Medical College of Wisconsin, Milwaukee, WI, United States, 2Department of Radiology, Medical College of Wisconsin, Milwaukee, WI, United States
Synopsis
Quantitative Susceptibility Mapping (QSM) is a MR post-processing technique that estimates underlying tissue magnetic susceptibilities. In QSM processing pipelines, background field removal is of vital importance to obtain local tissue field estimates for precise susceptibility quantification. Existing background field removal methods such as SHARP, RESHARP, PDF, and LBV can effectively remove the background field. However, they struggled in clinical applications with large slice thickness and resulting non-isotropic resolutions. To address the limitations of these existing pre-processing methods in clinical QSM practice, a deep-learning-based method was proposed to approximate the underlying tissue field maps from total field maps. In-vivo datasets acquired using clinical SWI protocol demonstrated the improved performance of this approach, compared to conventional existing methods.
Purpose
Quantitative Susceptibility Mapping (QSM) is a MR post-processing technique that estimates tissue magnetic susceptibilities1. Background field removal is an important pre-processing step required before QSM inversion. Existing background removal methods such as (1) SHARP2, (2) regularization enabled SHARP (RESHARP)3, (3) PDF4, (4) LBV5 have demonstrated excellent capabilities for background removal. However, in clinical applications, large slice thickness and non-isotropic acquisition resolutions greatly hinder the performance of existing methods. This results in imperfect background field removal and inaccurate susceptibility estimation in particular regions, such as those close to skull and sinus cavities. In this work, we propose a deep-learning-based QSM background removal algorithm to overcome these current limitations.Methods
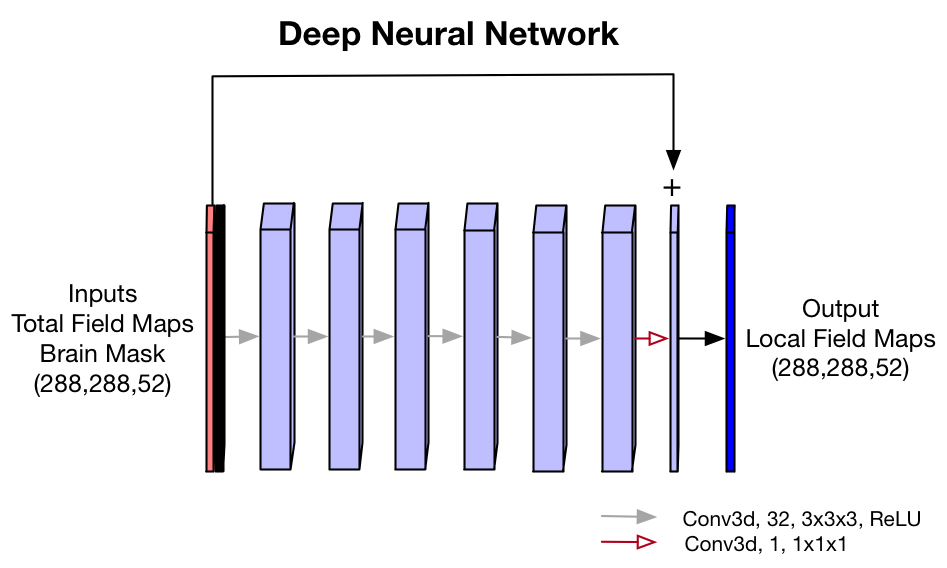
- Neural Network: A 3D convolutional residual neural network was trained to perform background removal, showed in Fig.1. The network takes in unwrapped total field maps and brain masks as inputs, and outputs local tissue field maps estimates.
- Training: 5000 simulated datasets were used to do training. The forward field map of the brain susceptibility map estimates was used as the local brain tissue field, and a background field map using simulated background susceptibility distribution generated from brain masks with binary susceptibility settings (separated by 9.2 ppm). L1 and gradient difference losses between the label and output were utilized as loss function. RMSprop optimizer was used in the deep learning training.
- Datasets: One hundred clinical SWI scans using susceptibility-weighted MR sequences at 3T with data acquisition parameters: in-plane data matrix = 288x224, FOV = 22 cm, slice thickness = 3mm, autocalibrated parallel imaging factors = 2x1, number of slices = 46-54, number of echoes = 7, echo spacing = 4.1ms, flip angle = 15˚, TR = 39.7ms, total scan time around 2.5 min.
- Data processing: Complex multi-echo images were reconstructed from saved raw k-space data, with reconstruction matrix size 288x288, voxel size 0.76x0.76x3.0mm3. The phase images were calculated using the multi-echo real and imaginary images. The Laplacian-based phase unwrapping was applied to remove the phase wraps. Brain masks were obtained using in-house 2D brain extraction neural network with magnitude images as input. Using the unwrapped total field maps and brain masks, we did background removal using SHARP, RESHARP, PDF, LBV, and our proposed method. The QSM toolbox6 was used to calculate SHARP, RESHARP, PDF and LBV background removal. For SHARP, a commonly used magnitude threshold of 0.05 was implemented. For SHARP and RESHARP, spherical kernel radius was set as 6mm.
- Evaluation: To evaluate the model, we examined the background removal results in axial, coronal and sagittal planes. In addition, QSM inversion of each field was performed using a locally developed QSM inversion neural network.
Results and Discussion
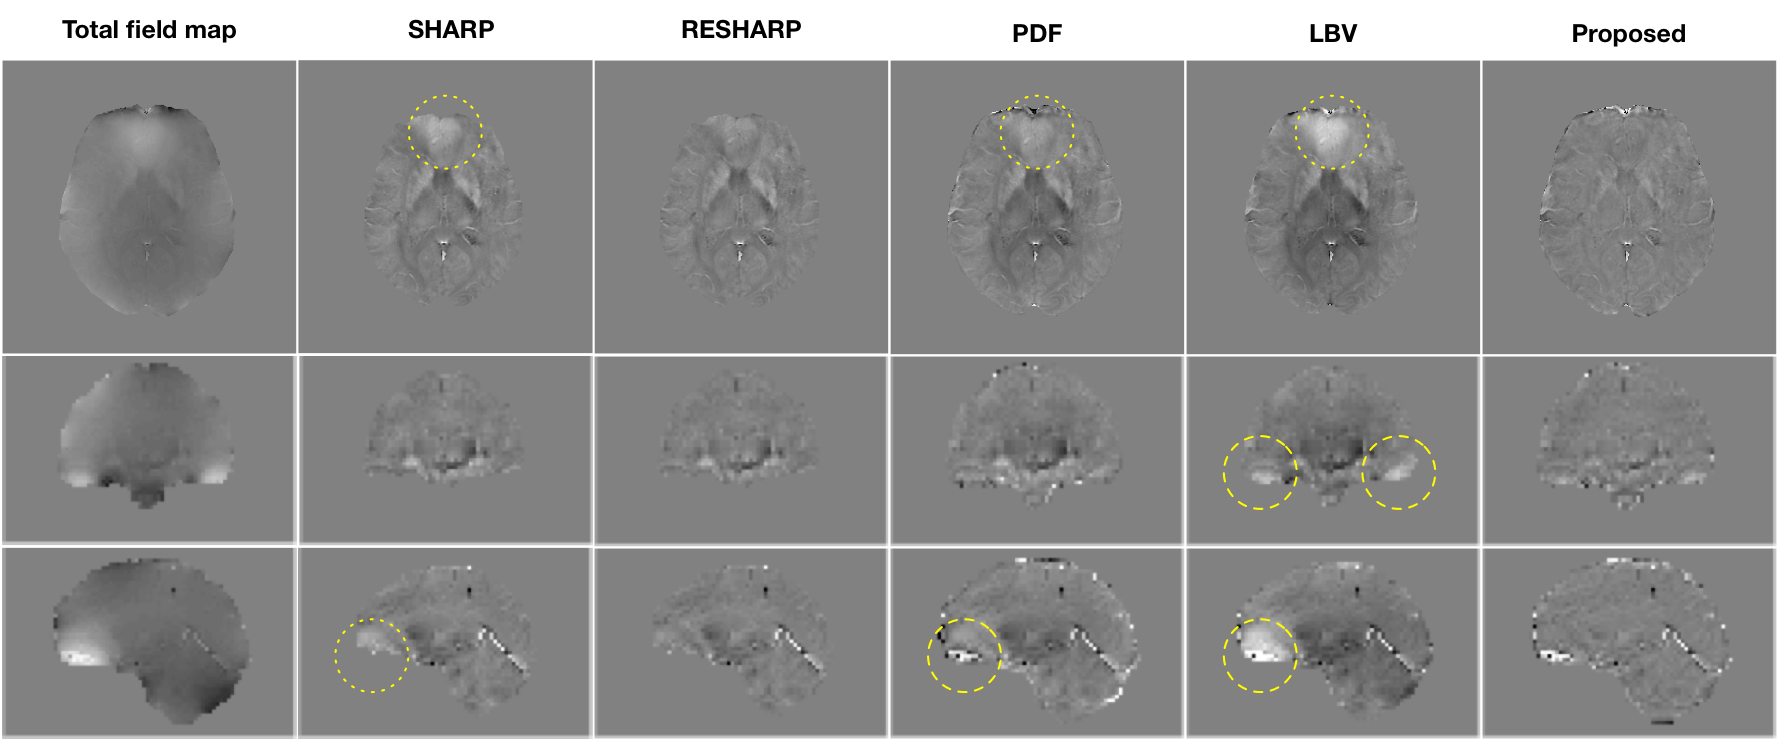
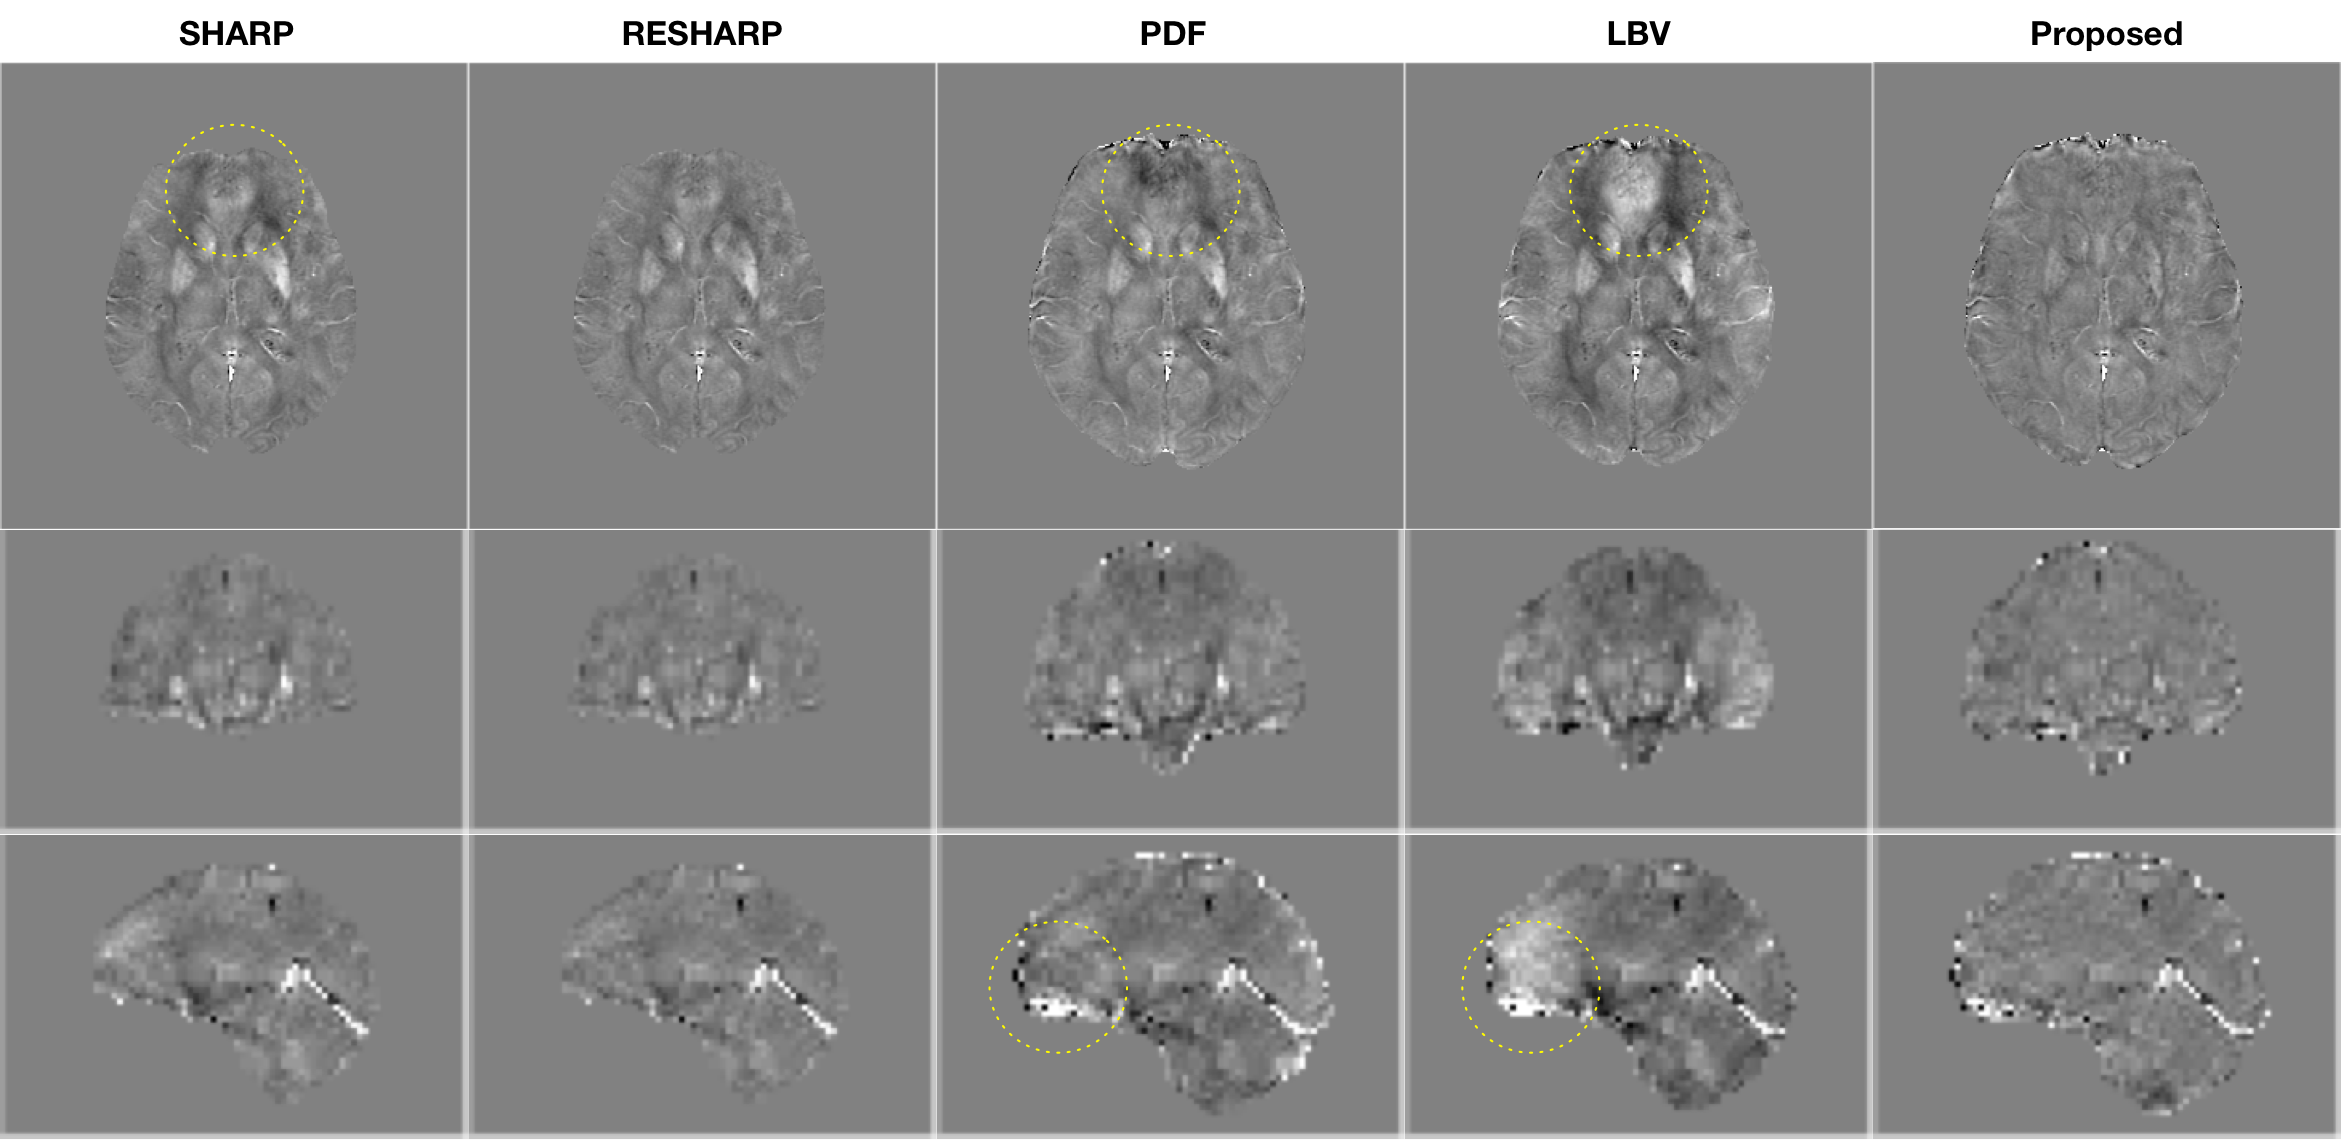
Fig.2 provides the brain tissue field maps of using different background removal methods on one subject in three (axial/coronal/sagittal) views. Compared with existing methods, the proposed deep learning methods can clearly improve background removal. The background removal improvement is especially noticeable around nasal cavity, showing more homogeneous local tissue field maps.
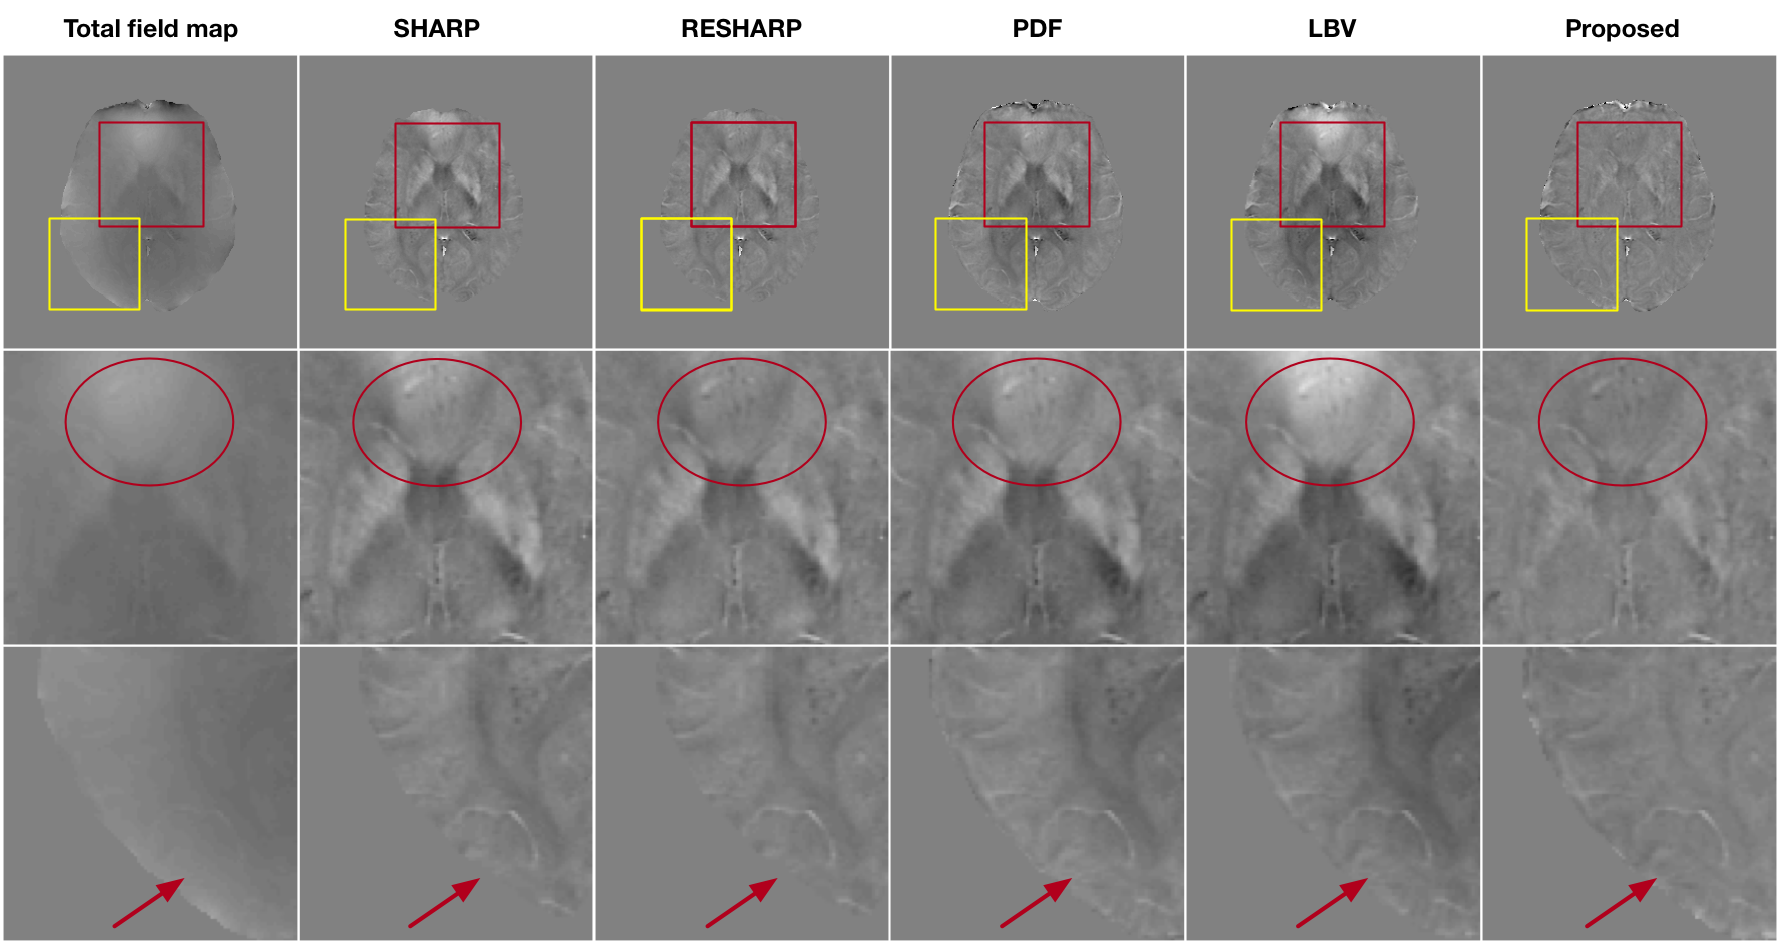
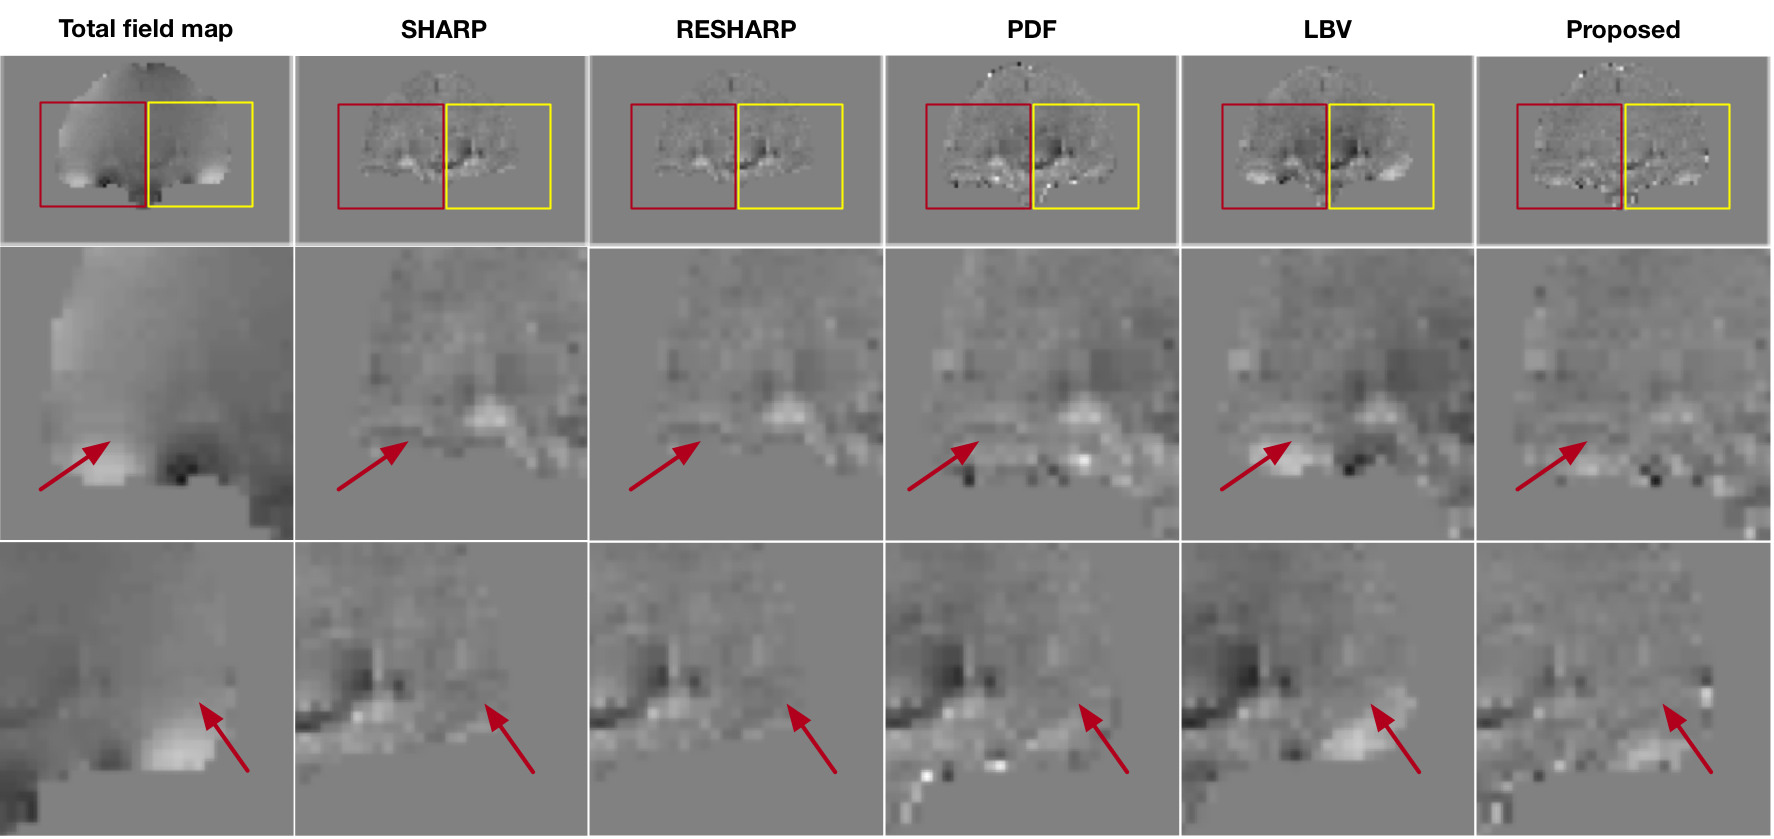
Fig.3 and Fig.4 provides more visual comparisons in axial and coronal views of the five methods. It clearly shows that the neural net results reveal significant improvement of background removal, showing less residual background field.
Fig.5 shows the QSM images reconstructed by a locally developed deep-learning-based QSM reconstruction method. Based on visual comparison, the proposed background removal method can produce improved susceptibility estimation without obvious shading quantification errors.
Without a proper gold standard for background removal, it is difficult to assess the quantification errors imparted by any background removal method. Our current metric for quality improvement is to remove obvious shading and bias fields from the residual tissue estimate. The removal of these bias fields does change the apparent contrast in residual tissue fields, which is disconcerting to researchers accustomed to the tissue fields produced by established methods. Further work will be required to seek quantitative assessment of the performance of the demonstrated methods, and its impact on QSM quantification accuracy.
Conclusion
In summary, we have demonstrated a deep-learning-based background removal approach that can substantially improve residual field errors and biases in non-isotropic datasets collected with conventional clinical SWI protocols. This capability opens up a wide array of QSM investigations using clinically acquired SWI data to derive QSM maps across a host of neuroimaging indications.Acknowledgements
No acknowledgement found.References
1. Wang Y, Liu T. Quantitative susceptibility mapping (QSM): decoding MRI data for a tissue magnetic biomarker. Magnetic resonance in medicine. 2015; 73 (1): 82-101.
2. Schweser F, Deistung A, Lehr BW, et al. Quantitative imaging of intrinsic magnetic tissue properties using MRI signal phase: an approach to in vivo brain iron metabolism? Neuroimage. 2011; 54 (4): 2789-2807.
3. Sun H, Wilman AH. Background field removal using spherical mean value filtering and Tikhonov regularization. Magnetic resonance in medicine. 2014; 71 (3): 1151-1157.
4. Zhou D, Liu T, Spincemaille P, Wang Y. Background field removal by solving the Laplacian boundary value problem. NMR in Biomedicine. 2014; 27 (3): 312-319.
5. Liu T, Khalidov I, de Rochefort L, et al. A novel background field removal method for MRI using projection onto dipole fields. NMR in Biomedicine. 2011; 24 (9): 1129-1136.
6. QSM Toolbox. http://pre.weill.cornell.edu/mri/pages/qsm.html
Figures