4847
A Two-Step Automated Liver MR Images Quality Assessment based on Convolutional Neural Network1Shanghai Key Laboratory of Magnetic Resonance, East China Normal University, Shanghai, China, 2Zhejiang Cancer Hospital, Zhejiang, China
Synopsis
We proposed a two-step approach to evaluate automatically liver MR image quality. Firstly, we used a U-Net to segment the liver region. Then image patches were extracted from this region and another CNN was applied to estimate the quality of each image patch. The quality of the entire image was calculated based on the total percentage of 'bad' image patches in all patches. Receiver operating characteristic curve and confusion matrix were used to evaluate the performance of the proposed method. The performance of our method was comparable to human image readers.
Introduction
MRI is an essential technique for the clinical diagnosis of liver diseases.1 In the scanning process, due to motion and breathing of the patients, liver MR images may suffer from distortions, blurring or absence of structures, which makes the image unqualified for clinical diagnosis. Inspired by the recent achievements of deep learning in medical images, we proposed an approach based on Convolutional Neural Network (CNN) which can be used to automatically evaluate image quality online to ensure that the images satisfy the requirements of clinical diagnosis.Methods
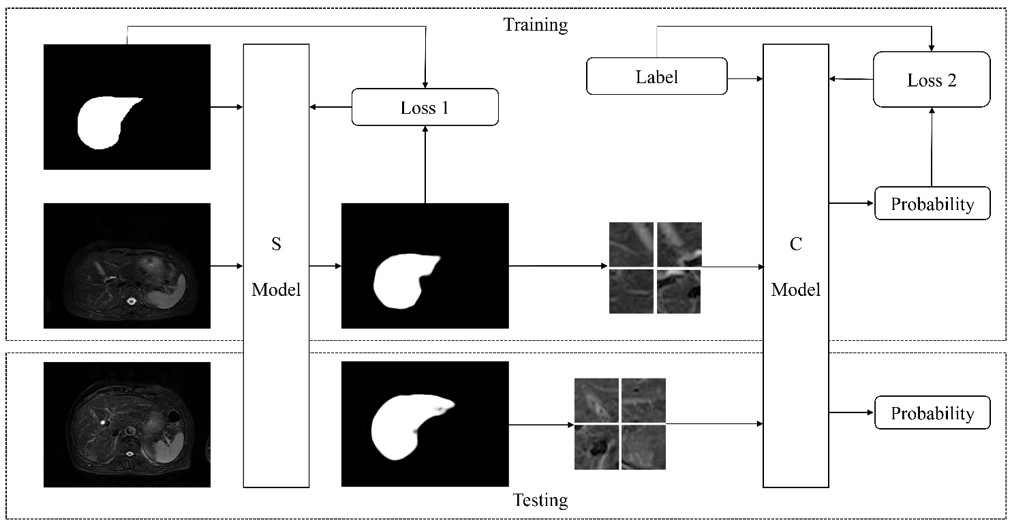
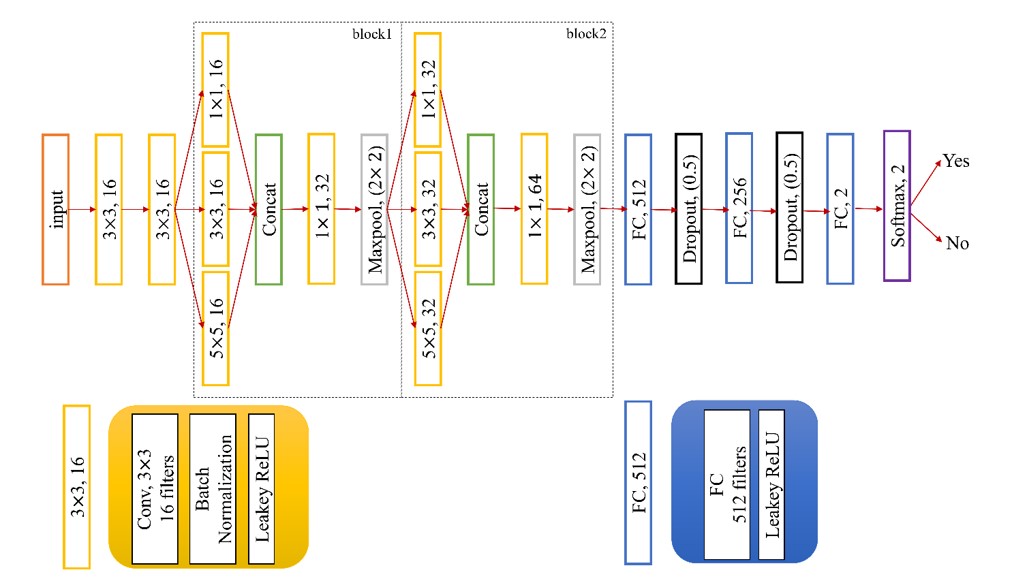
We used 100 liver T2 MRI cases from Zhejiang Cancer Hospital and each slice was annotated with a label of diagnostic (D) or non-diagnostic (ND) by two radiologists with 2 and 6 years of experiences, respectively. Two trained observers segmented liver region manually as ground truth. The data set was randomly split into three sets of training (70 cases, 156ND vs. 421D), validation (10 cases, 17 ND vs. 62D) and testing (20 cases, 52ND vs.142D). We also applied rotation, stretch, and shift operations to augment training and validation datasets to avoid overfitting. All images were standardized before feed into the network. The proposed method consisted of two steps in Fig.1. In the first step, liver MR images were input into the trained U-Net2 (S model) to get the liver region. Then we extracted 32*32 patches with stride 4 from the region. For a selected patch, at least 80% of all its pixels were in the liver region. In the second step, a subsequent network (C model) shown in Fig.2 was used to classify the patch quality (ND vs. D). The quality of the whole image was obtained from the percentage of non-diagnostic patches in all liver patches. Inspired by GoogLeNet3, we used 3*3 and 5*5 convolution layers to get multiple scales features and 1*1 convolution layer to reduce computational requirements in C model. Leakey ReLU4 was used as activation function. During the training, we used Adam algorithm with an initial learning rate of 0.001 to minimize the loss function (cross-entropy function). The models were implemented on Tensorflow (version: 1.3.0). It took about 20 hours to train the networks and one second to evaluate single slice image. In the testing dataset, Dice coefficient was used to evaluate the segmented results between U-Net and ground truth. We used receiver operating characteristic (ROC) curve5 and confusion matrix between radiologists and our algorithm to evaluate the performance of the proposed method. The non-diagnostic images were treated as positive samples.Results
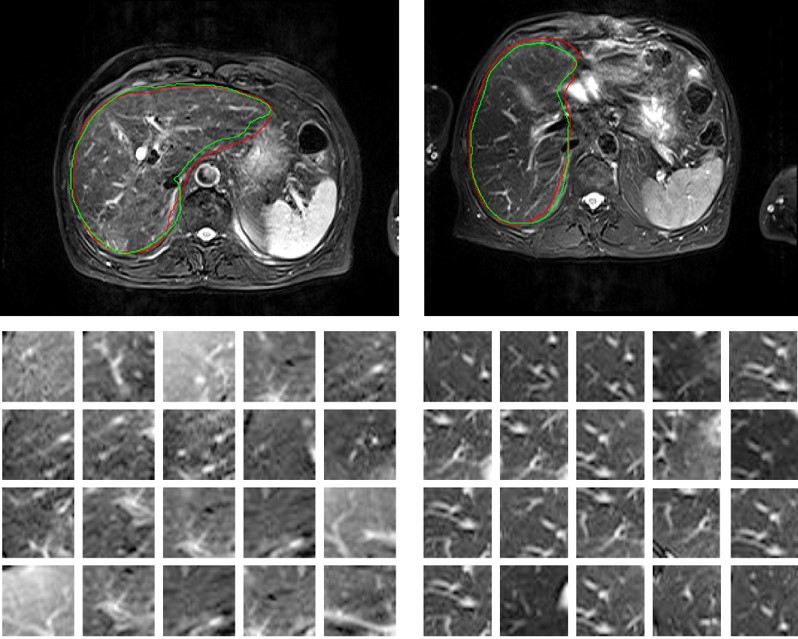
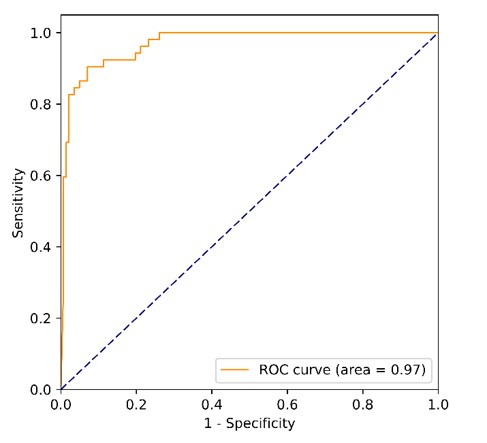
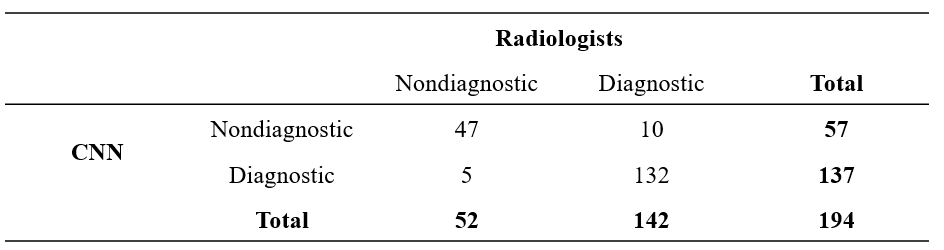
The mean value and standard deviation of dice coefficient were 0.9 and 0.05. Fig.3 showed the segmented liver region of U-Net and extracted patches from that region, we can see that the texture of patches extracted from diagnostic images was clear and the patches extracted from non-diagnostic images were blurry and featured with artifacts. The ROC curve and confusion matrix were shown in Fig.4 and Table1, respectively. The area under the ROC curve (AUC) was 0.969 (95% confidence interval: 0.944 – 0.988; p<0.001). The cut off value that maximized the Youden index was 0.8, which meant the image was classified as non-diagnostic when the over 80% liver patches were classified as ND. The proposed method achieved excellent performance on image quality assessment with the sensitivity of 90.38% (47/52), specificity of 92.96% (132/142), positive predictive value (PPV) of 82.46% (47/57), negative predictive value (NPV) of 96.35% (132/137) and accuracy of 92.27% (179/194).Discussion
When evaluating the quality of liver MR images, the focus should be on the liver. We used U-Net to segment the liver region so that the evaluation would not be influenced by the irrelevant background, e.g., regions pre-saturated purposely. The accuracy of segmentation need not to be very accurate because its purpose was only to find relevant image patches for further evaluation. Compared to the previous approaches6 which extracted feature over the entire image for estimating overall quality, our method focused on the region of interest, thus was more robust.Conclusion
In our study, we proposed two-step patch-based strategy for online automatic image quality evaluation. A standalone segmentation model enabled the evaluation to focus on the region of interest and made the approach more robust. This approach can be adapted easily to evaluate qualities of other medical images.Acknowledgements
This project is supported by National Natural Science Foundation of China (61731009, 81771816).References
1. Ramalho M, Herédia V, Tsurusaki M, Altun E, Semelka RC. Quantitative and qualitative comparison of 1.5 and 3.0 tesla MRI in patients with chronic liver diseases. J Magn Reson Imaging. 2009; 29:869–879.
2. Ronneberger O, Fischer P, Brox T. U-Net: Convolutional Networks for Biomedical Image Segmentation. Miccai. 2015:234–241.
3. Szegedy C, Liu W, Jia Y, et al. Going deeper with convolutions. Proc IEEE Comput Soc Conf Comput Vis Pattern Recognit. 2015; 07–12–June:1–9.
4. Maas AL, Hannun AY, Ng AY. Rectifier Nonlinearities Improve Neural Network Acoustic Models. Proc 30 th Int Conf Mach Learn. 2013; 28:6.
5. Hanley AJ, McNeil JB. The Meaning and Use of the Area under a Receiver Operating Characteristic (ROC) Curve. Radiology. 1982; 143:29–36.
6. Esses SJ, Lu X, Zhao T, et al. Automated image quality evaluation of T2-weighted liver MRI utilizing deep learning architecture. J Magn Reson Imaging. 2018; 47:723–728.
Figures