4836
FeAture Explorer (FAE): a Tool of Radiomics Feature Analysis and Exploration1Shanghai Key Laboratory of Magnetic Resonance, East China Normal University, Shanghai, China, 2Department of Radiology, the First Affiliated Hospital with Nanjing Medical University, Nanjing, China, 3MR Scientific Marketing, Siemens Healthcare, Shanghai, China, 4Shanghai University of Medicine & Health Sciences, Shanghai, China
Synopsis
Radiomics studies often requires researchers spend large amount of time trying out various combinations of different data preprocessing strategies, feature selection algorithms, classifiers, and associated hyper-parameters to find the best model. We developed a tool with graphics user interface named FeAture Explorer (FAE) to automate this tedious process. With FAE, to find the best model, researchers only need to specify the choices for each step in radiomics pipeline and let FAE do the rest. Results, such as clinical statistics of each model, can be reviewed and visualized. We used the PROSTATEx dataset to illustrate the function of FAE.
INTRODUTION
Radiomics can map the quantitative features extracted from the medical image onto the clinical diagnosis1. However, to find the best model, correct algorithms for data preprocessing, feature selection, classifier need to be chosen, together with correct set of associated hyper-parameters. The typical try-and-error process can be tedious. To automate this process and facilitate radiomics studies, we developed a software called FeAture Explorer (FAE), which can automatically explore all the specified combinations of algorithms and hyper-parameters and find the best model.METHODS and RESULTS
FAE is a graphics user interface (GUI) application developed in Python 3.5.4 (https://www.python.org/). It makes use of python libraries such as pyqt and scikit-learn2 etc. All source code was openly available on GitHub (https://github.com/salan668/FAE) and the Windows distribution was available on https://drive.google.com/drive/folders/1htts7YsfaxKtN1NeDcNU4iksXfjr_XyK?usp=sharing.
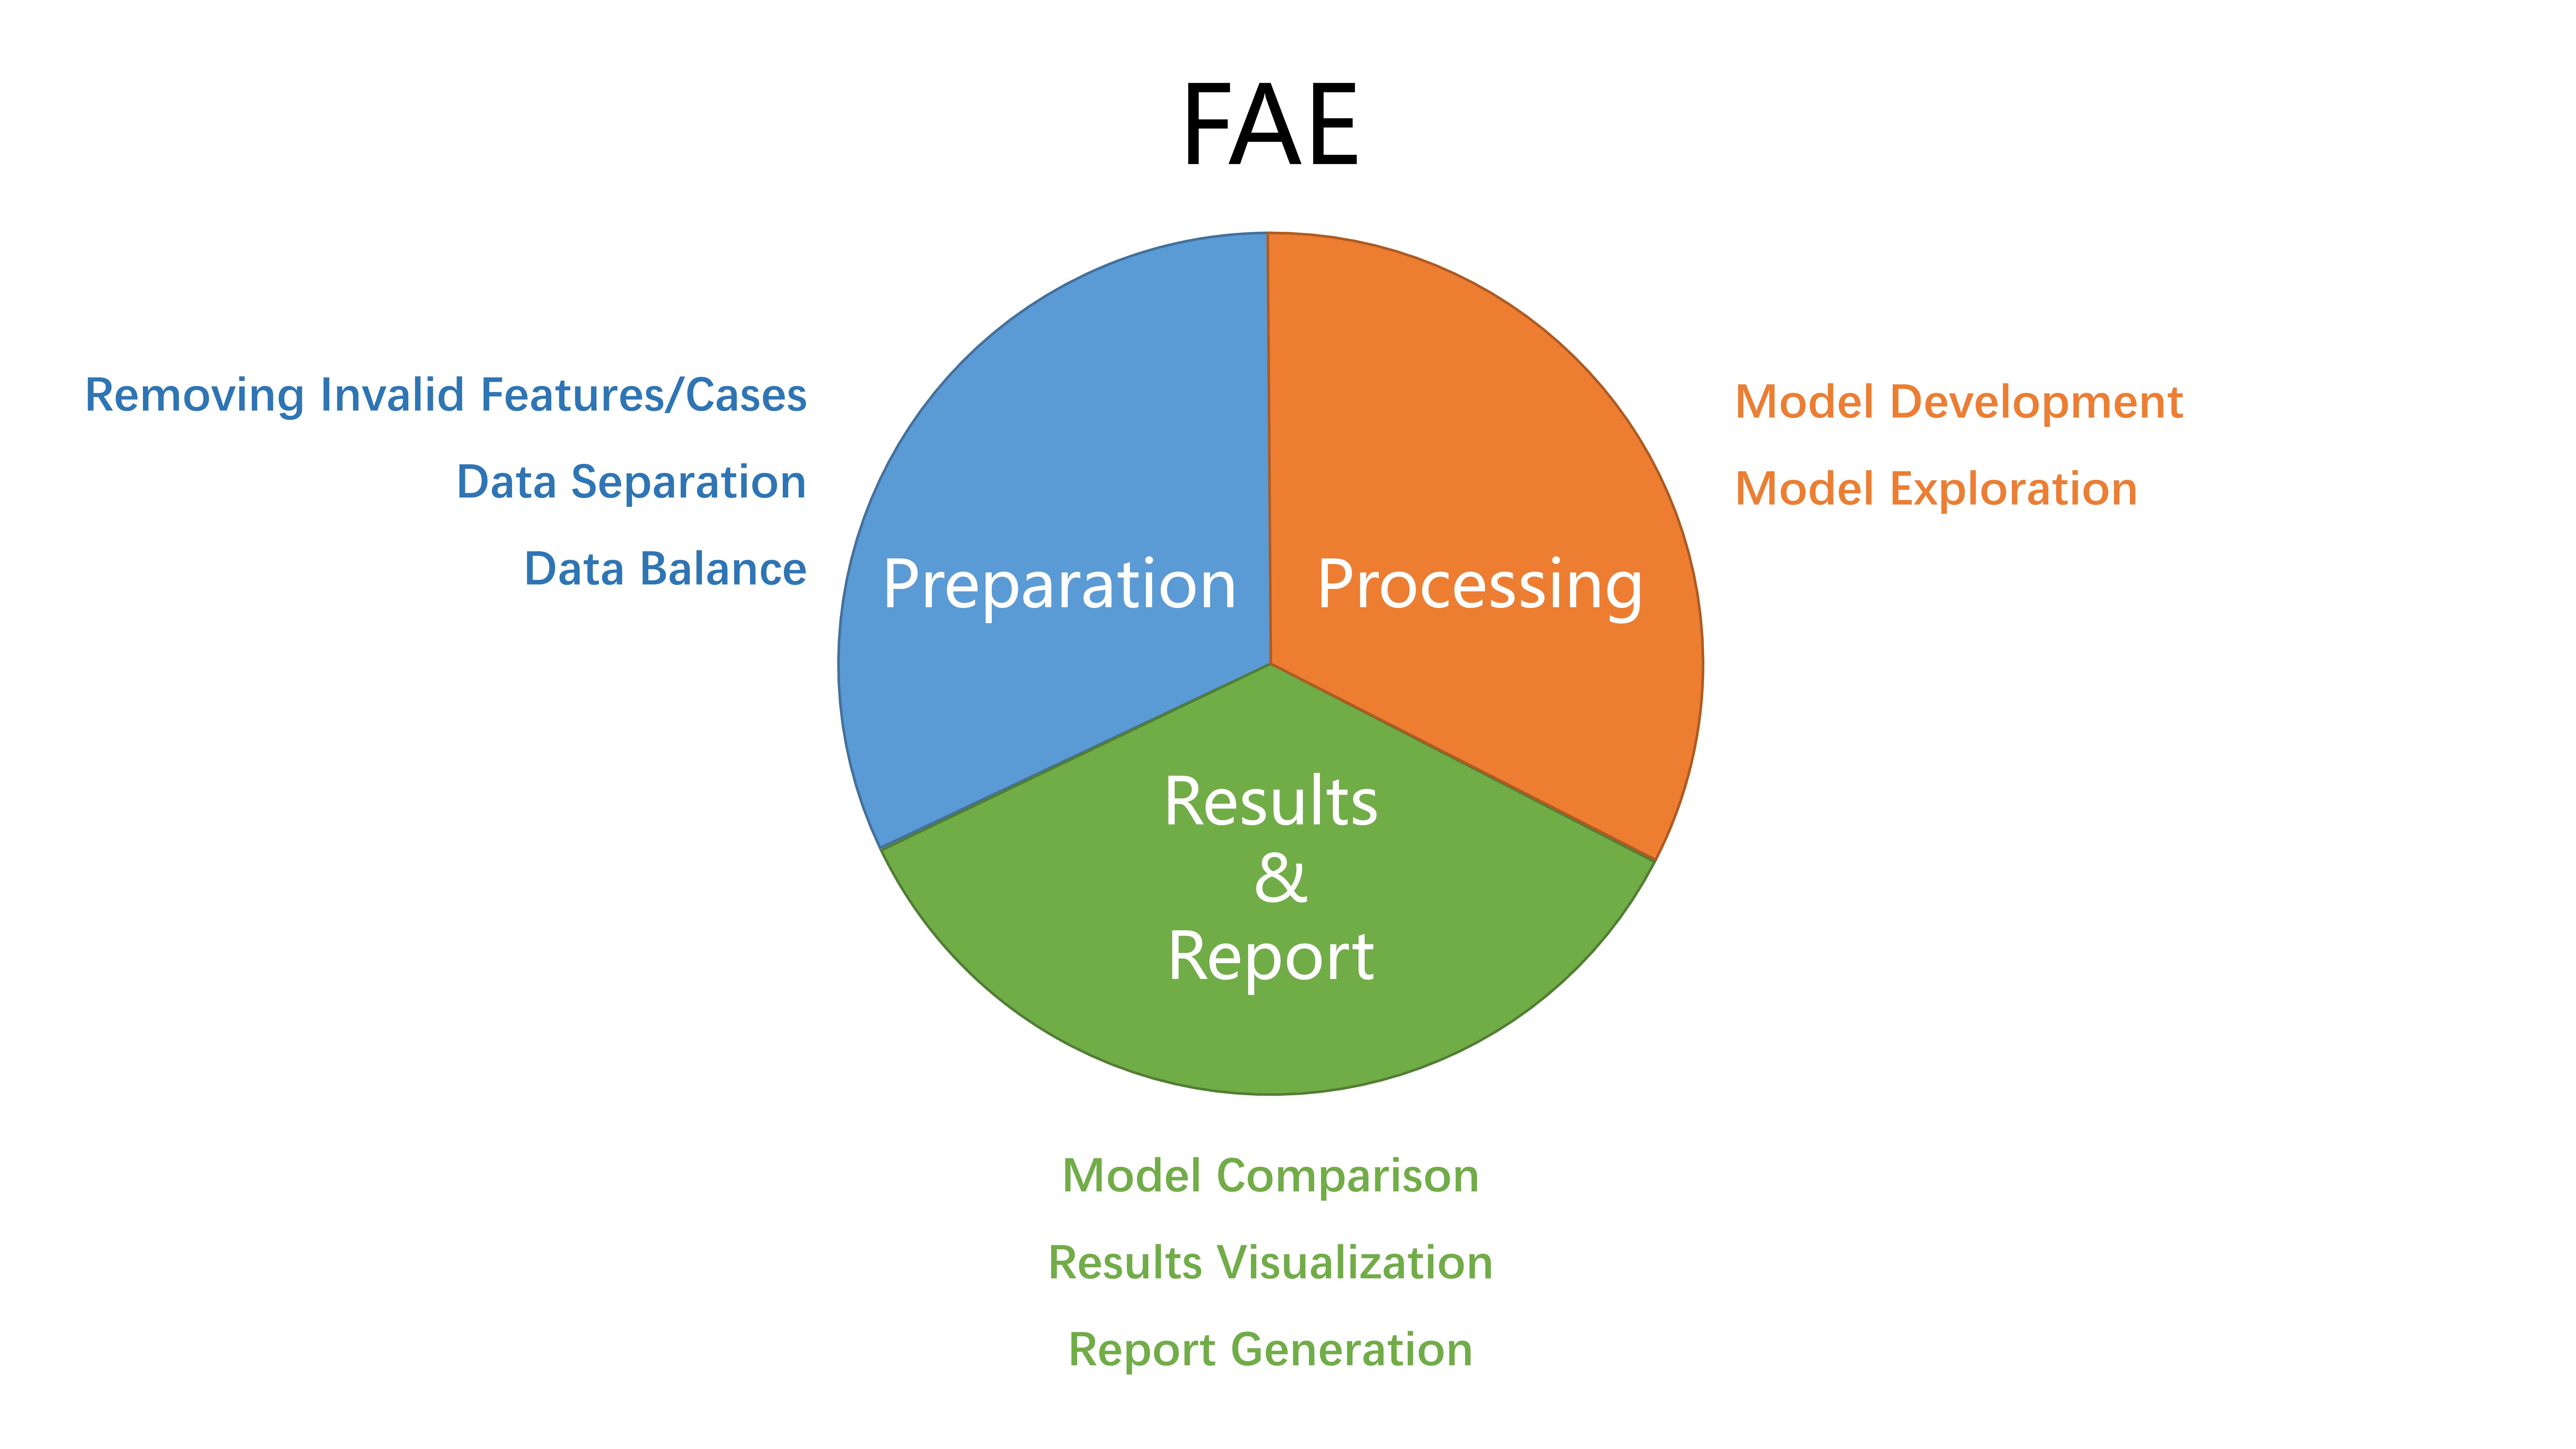
FAE consists of three major modules: preparation, processing, and results and report. (Figure 1) Each module is independent of the others. In the following paragraphs, a brief introduction of required data format is given, then the usage of the software will be demonstrated with radiomics features extracted from PROSTATEx dataset.
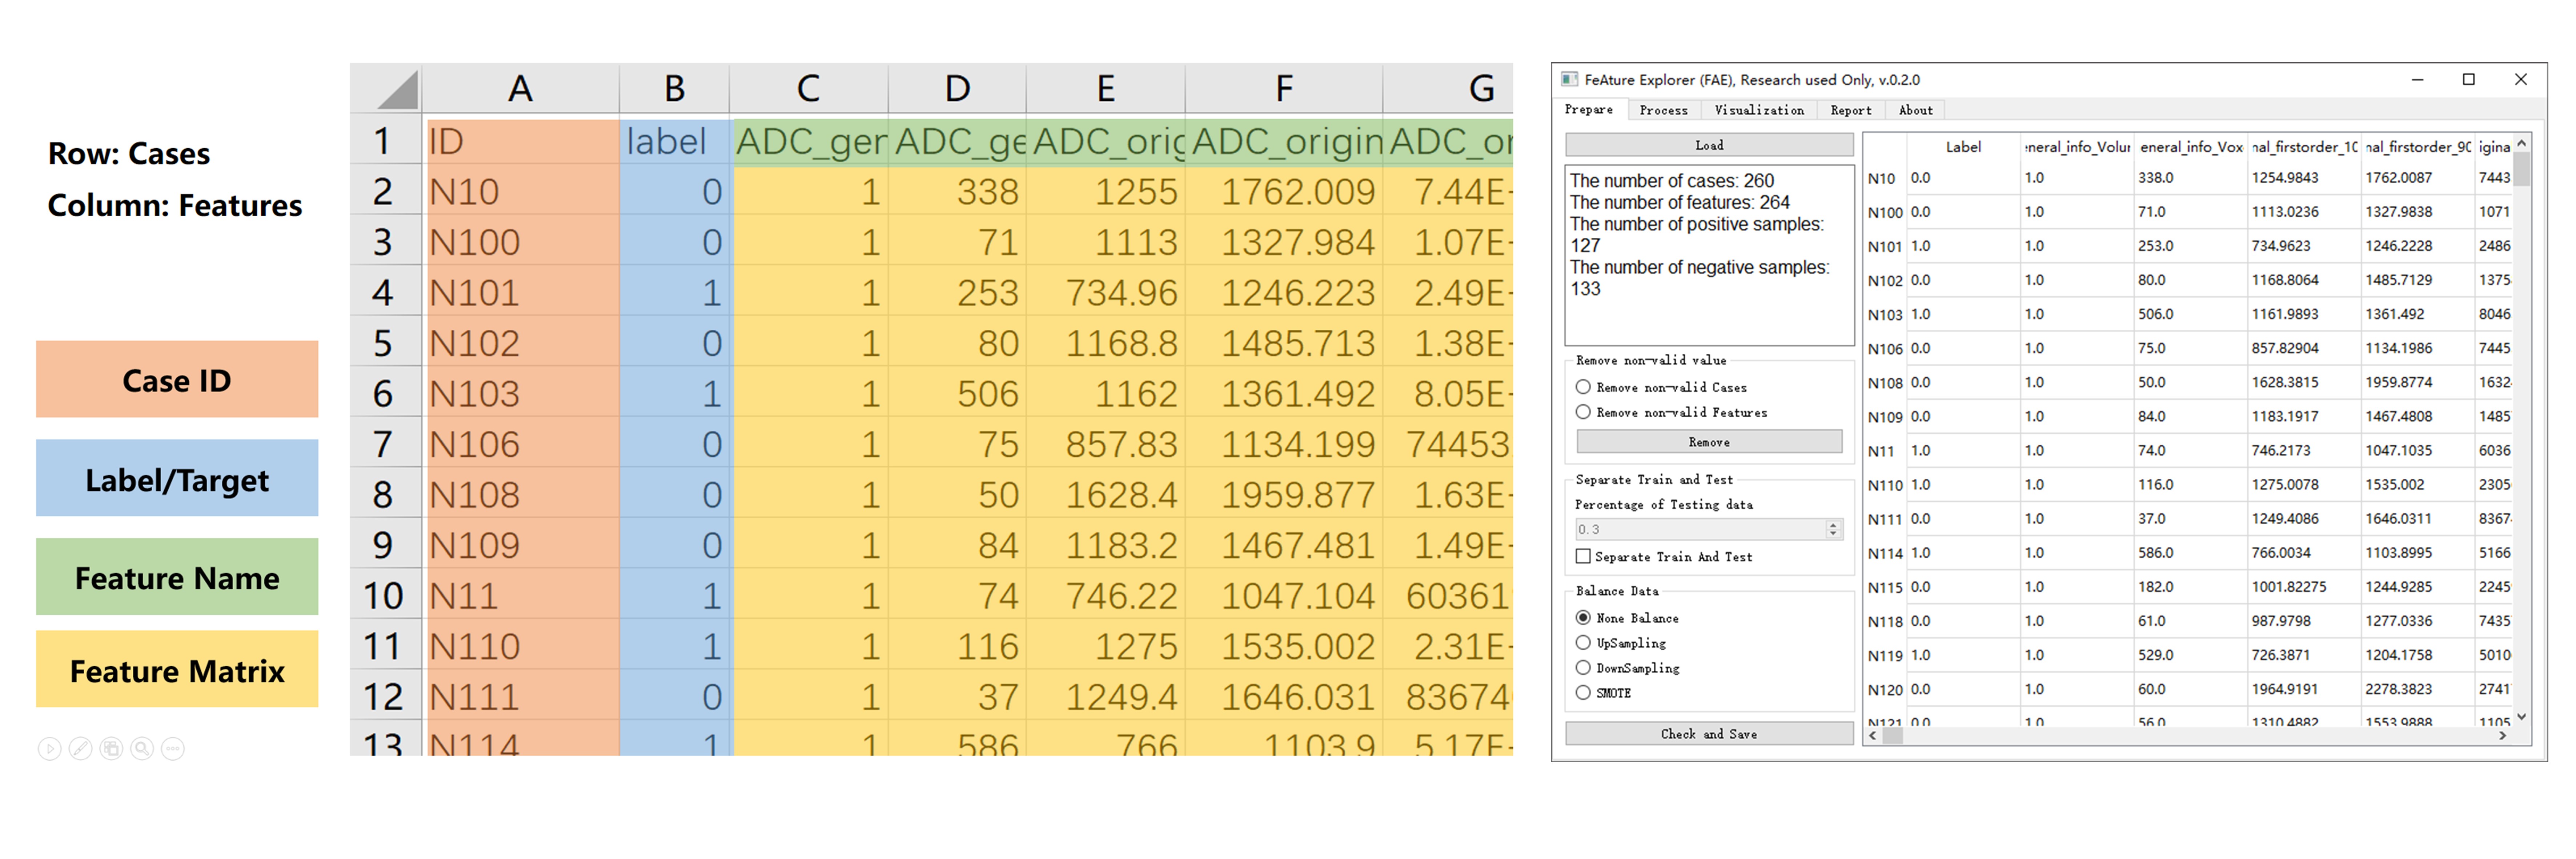
Basic format: To use FAE, the researcher needs to extract the quantitative features and store them in a feature matrix (Figure 2 left). The row of the matrix denotes the cases, and the column denotes the features. The diagnosis (target/label) should be stored in a column of this features matrix. The feature matrix need to be saved in CSV format to be used in FAE.
We extracted features from PROSTATEx dataset by pyradiomics (https://pyradiomics.readthedocs.io/en/latest/) to classify the prostate cancer (PCa) and non-prostate cancer (non-PCa)3. The features were saved in CSV format before we used FAE to process them.
Preparation: The researcher can load feature matrix into FAE and review it in this module (Figure 2 right). A brief description of this feature matrix is shown in the left part of Figure 2. FAE can automatically remove invalid features such as text or null features, or remove invalid cases. FAE can also split the dataset into training and testing dataset and automatically do the data balance for unbalanced training dataset.
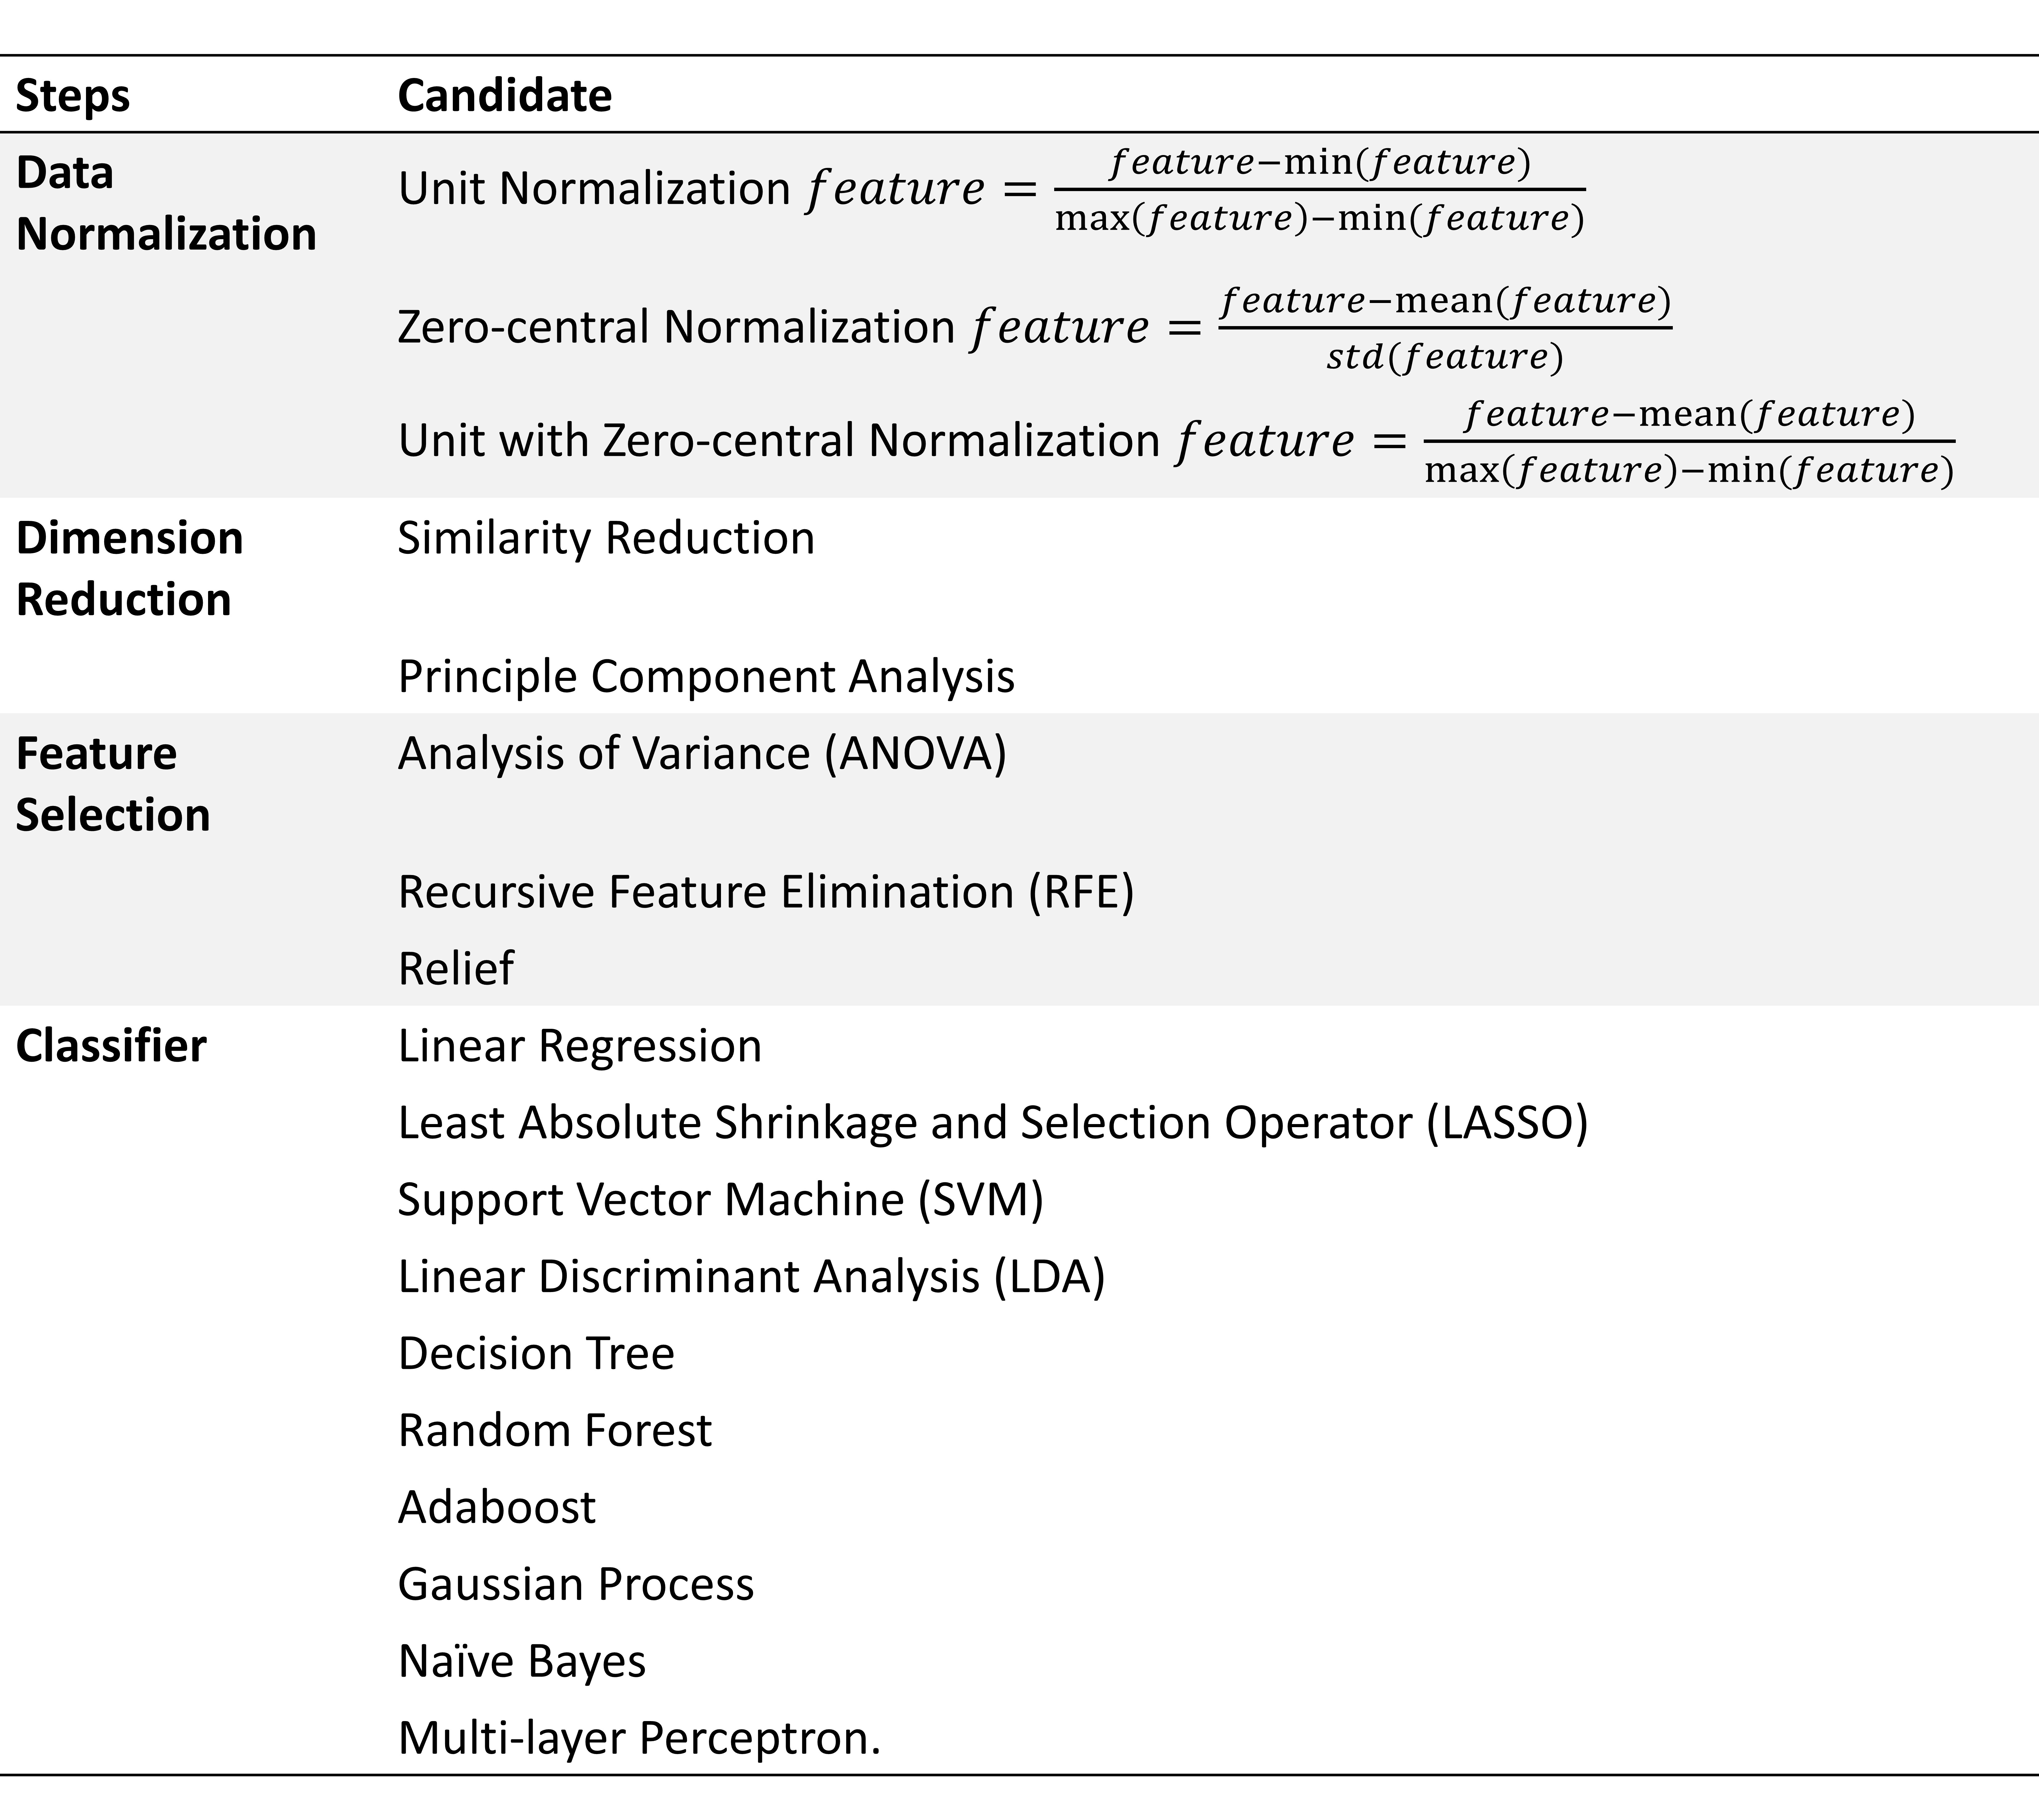
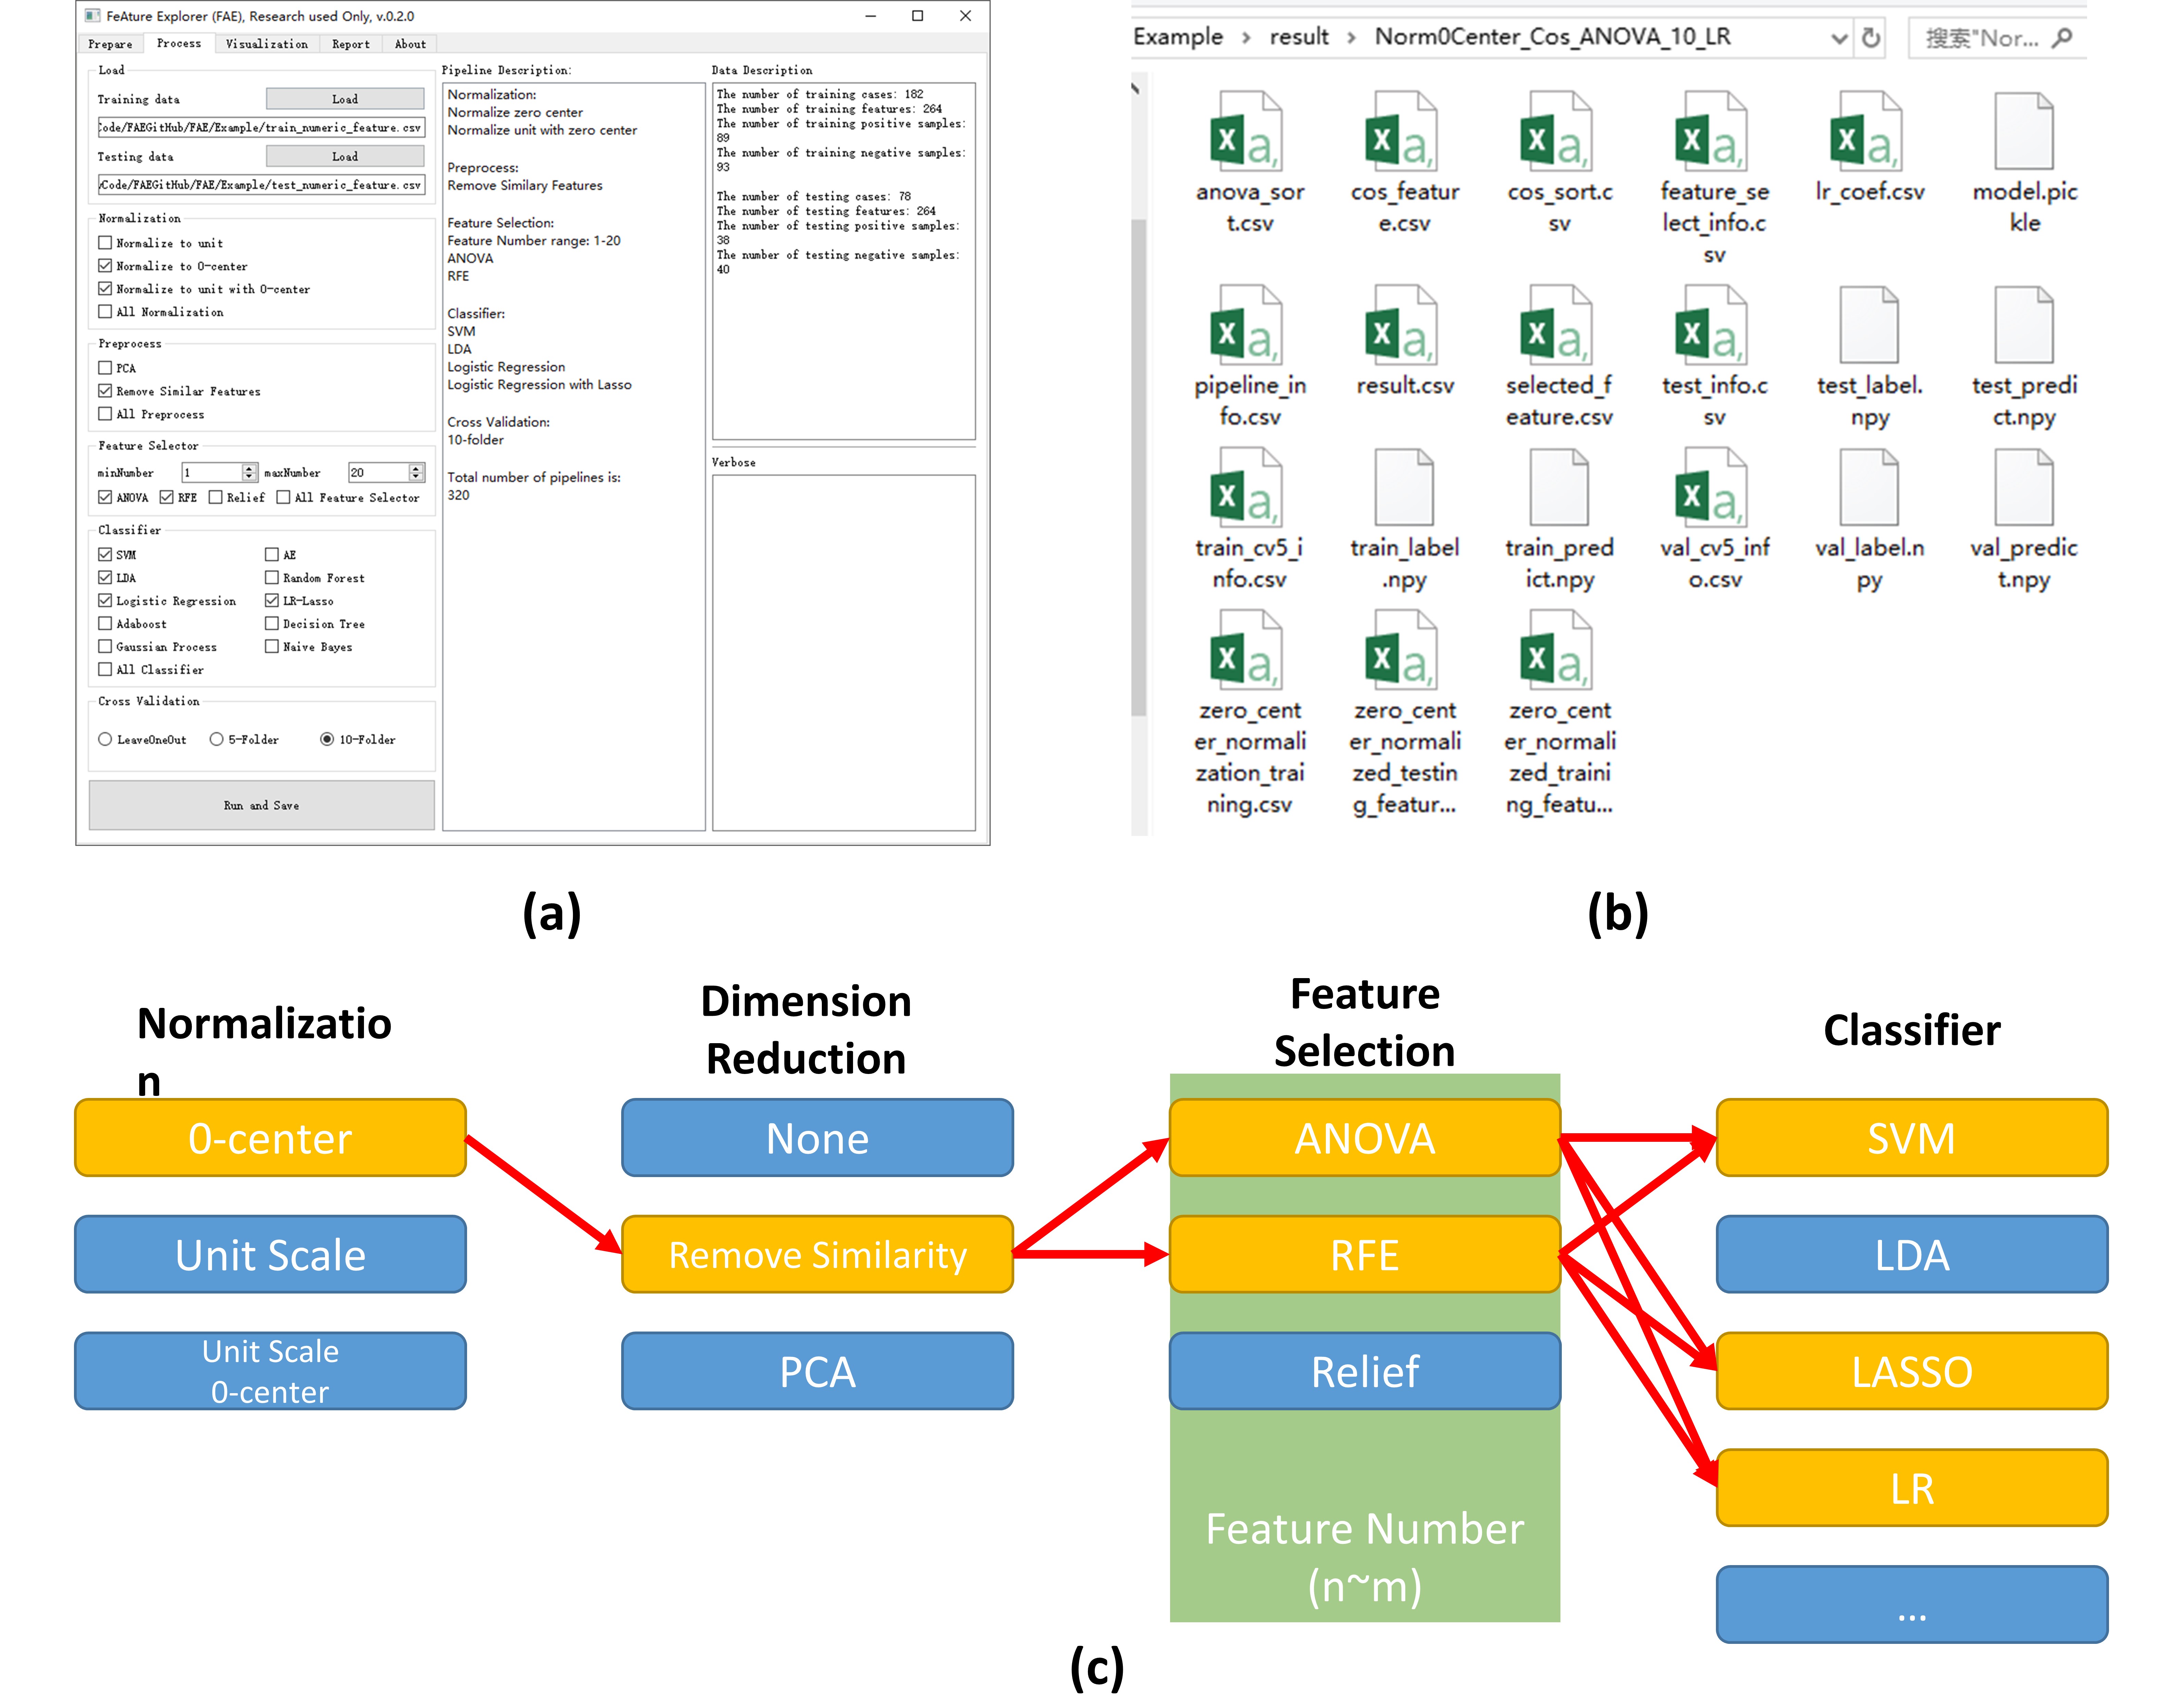
Processing: A typical radiomics pipeline includes four steps: 1) Data Normalization; 2) Dimension reduction; 3) Feature selection; 4) Classifier. FAE provided several to ten options for each of these steps as shown in Table 1 and more options can readily be added to each step. When the processing starts, FAE will automatically try out all the possible combinations of specified options. FAE also supports cross-validation such as 5- or 10-fold or leave-one-out to evaluate the model on the validation dataset (Figure 3 (a)). The evaluation results of each model (on both the validation and testing dataset) will be saved together with intermediate results of each steps for further inspection (Figure 3 (b)).
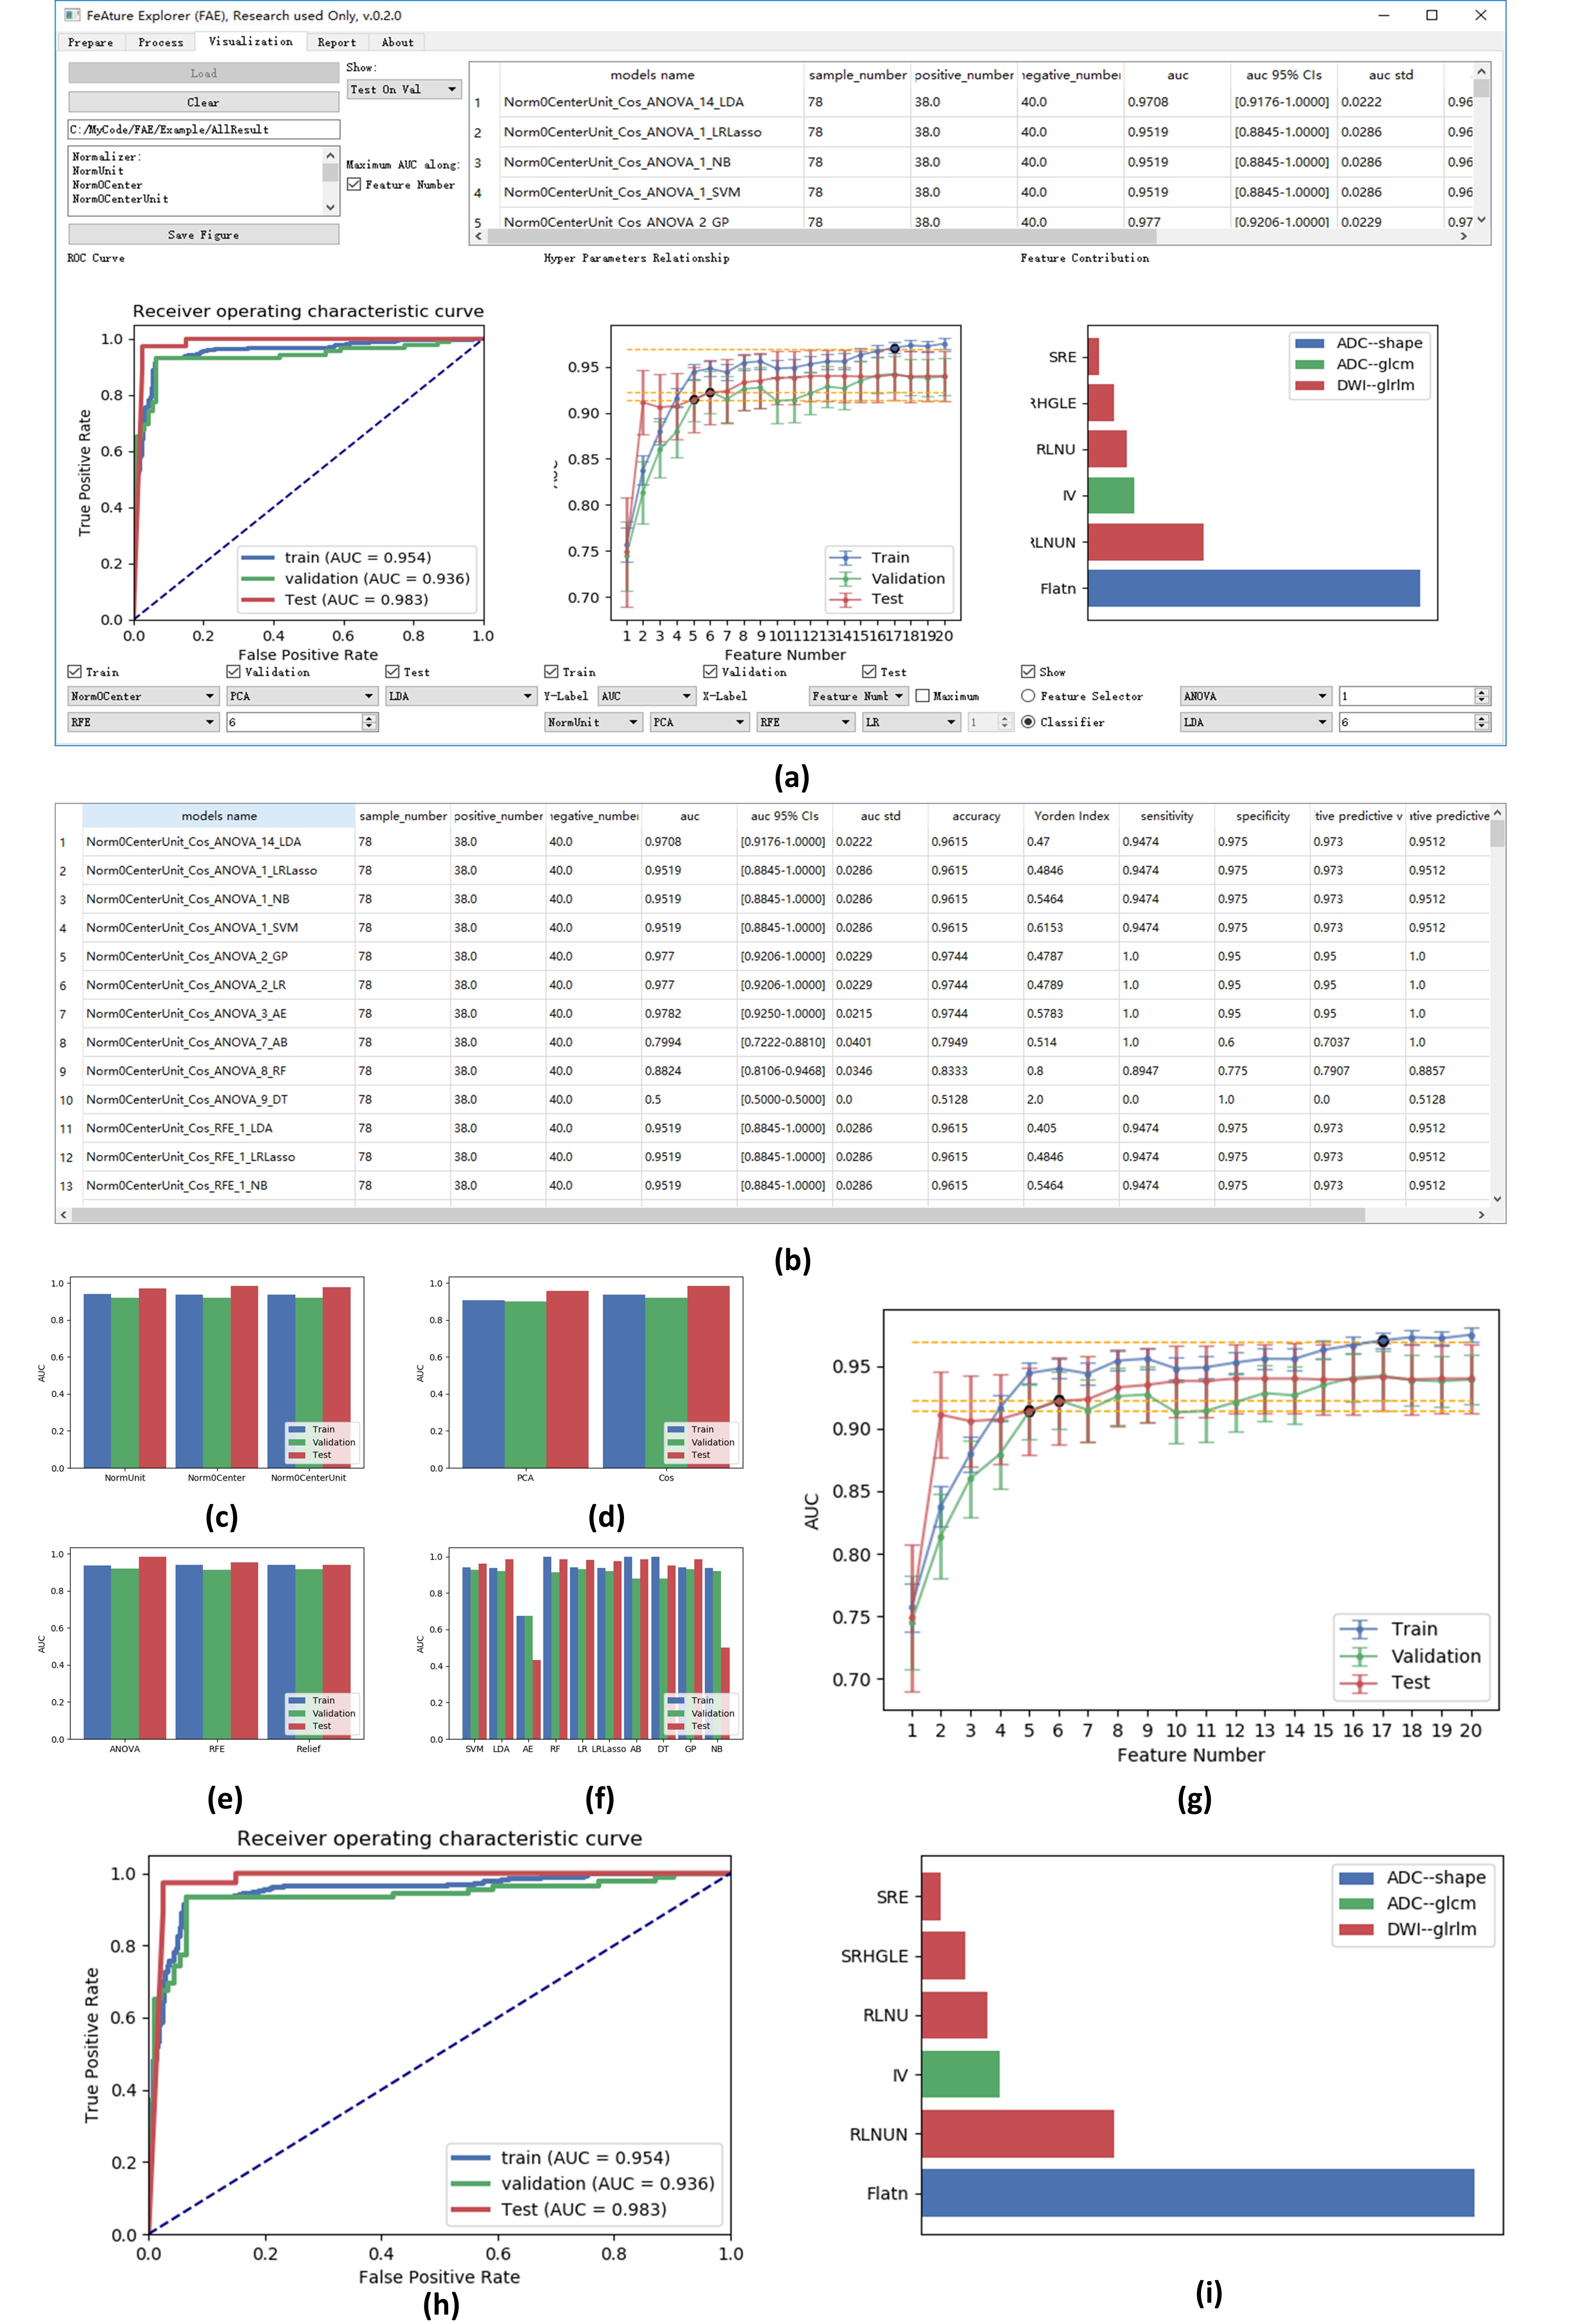
Results and Report: After FAE finishes processing, researches can use this module to check the results of all models (Figure 4), by both viewing the clinical statistics and data visualization. The clinical statistics such as area under receiver operating characteristic (ROC) curve (AUC), 95% confidence intervals, sensitivity, specificity, accuracy, are estimated using training, validation, and testing dataset in (b). (c)/(d)/(e)/(f)/(g) denotes the comparison among different pipelines of models with different normalization methods / dimension reduction methods / feature selectors / classifiers / number of features. The ROC curve for each pipeline is also shown (h). FAE can also show the contribution of each quantitative features selected by a model (i). FAE also allows researchers to export description of the method and the corresponding results in PDF, which can be reviewed without FAE.
DISCUSSION and CONCLUSION
FAE provides a GUI for fast radiomics exploration and it featured a flexible framework which can be readily extended. Various combinations of radiomics algorithms and associated hyper-parameters can be tried out easily in order to find the best model for a certain clinical application. The resulted models can also be reviewed and evaluated either using the GUI or using the PDF output. In short, FAE provides an easy-to-use integrated environment for radiomics studies.Acknowledgements
This project is supported by National Natural Science Foundation of China (61731009, 81771816).References
1. Gillies R J, Kinahan P E, Hricak H. Radiomics: images are more than pictures, they are data. Radiology, 2015, 278(2): 563-577.
2. Pedregosa F, Varoquaux G, Gramfort A, et al. Scikit-learn: Machine learning in Python. Journal of machine learning research, 2011, 12(Oct): 2825-2830.
3. G. Litjens, O. Debats, J. Barentsz, et al. Computer-aided detection of prostate cancer in MRI, IEEE Transactions on Medical Imaging 2014;33:1083-1092.
Figures