4832
The qMRLab workflow: From acquisition to publication1NeuroPoly Lab, Institute of Biomedical Engineering, Polytechnique Montreal, Montreal, QC, Canada, 2Montreal Heart Institute, Montreal, QC, Canada, 3Montreal Neurological Institute, McGill University, Montreal, QC, Canada, 4Unité de Neuroimagerie Fonctionnelle (UNF), Centre de recherche de l’Institut Universitaire de Gériatrie de Montréal (CRIUGM), Montreal, QC, Canada
Synopsis
qMRLab is open-source software that provides a wide selection of quantitative MRI (qMRI) methods for data fitting, simulation and protocol optimization. Currently, most qMRI methods are developed in-house and are difficult to port across sites. Our vision for qMRLab is to build standardized workflows for these methods, beginning at the scanner console and extending all the way to journal publication. We developed a web portal (https://qmrlab.org) that includes interactive tutorials and Jupyter Notebooks running on BinderHub, tailored for qMRI methods. The last piece of this workflow puzzle is the integration of qMRLab on MR systems, by deploying it as a plugin on a custom MRI application development platform (e.g. RTHawk).
Introduction
qMRLab is open-source software that provides a wide selection of quantitative MRI (qMRI) methods for data fitting, simulation and protocol optimization. Currently, most qMRI methods are developed in-house and are difficult to port across sites. Our vision for qMRLab is to build standardized workflows for these methods, beginning at the scanner console and extending all the way to journal publication. We developed a web portal (https://qmrlab.org) that includes interactive tutorials and Jupyter Notebooks running on BinderHub, tailored for qMRI methods. The last piece of this workflow puzzle is the integration of qMRLab on MR systems, by deploying it as a plugin on a custom MRI application development platform (e.g. RTHawk).Methods
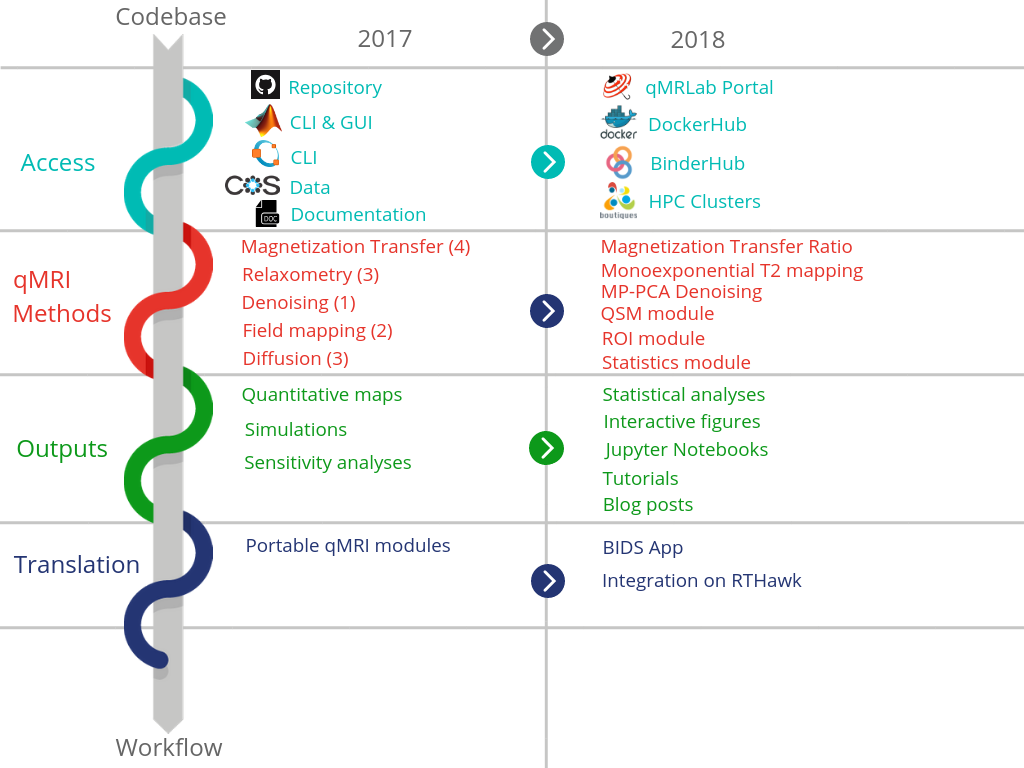
qMRLab is intended for a streamlined workflow from the MRI scanner to the journal publication. As work is progressing to make this vision reality, new features are continuously added to qMRLab. Below is a list of recent developments, organized in four categories:
Publicly accessible resources
Portability is a priority (Fig. 1), and was achieved by using container technologies (i.e. Docker) to package two lightweight distributions of qMRLab as Docker images, catering to different use cases. The Docker image #1 (DI1) is meant for Jupyter Notebook (JN) environments, making it easy to launch a JN server and use interactive widgets. Using the Script-of-Scripts kernel (https://vatlab.github.io/sos-docs/), qMRLab modules written in the MATLAB/Octave syntax can be processed in the same JN as Python-powered packages for data visualization. The Docker image #2 (DI2) is designed to take advantage of the higher computational performance of MATLAB compared to Octave. To this end, a main command line entry point has been developed for qMRLab and compiled. The compiled software is integrated in DI2, containing the corresponding MATLAB-Compile-Runtime. Both images are available at https://hub.docker.com/r/neuropoly/qmrlab/. These additions lay the groundwork for creating online executable qMRLab JNs via BinderHub1 and mapping qMRLab workflows on high-performance computing clusters through the Boutiques application descriptor2.
Public repositories for the qMRLab codebase, side projects, JNs and all the resources for the new web portal (https://qmrlab.org) are available at https://github.com/qMRLab/.
Available qMRI methods and software modules
The first qMRLab release3 contained 13 methods classified in five subgroups for generating quantitative maps (Fig.1). The latest release introduces three new subgroups, including fast quantitative susceptibility mapping with automatic parameter selection4, a new graphical user interface for performing region of interest based analyses, and an object-oriented statistics framework that implements the robust statistics toolbox5 , together with reliability tests for single subject and group-level assessments.
Outputs
The modular design of qMRLab helps propagate provenance recording throughout the workflow, and provides easy integration of new modules (e.g. statistics module). Moreover, it comes with an option to export structured data to generate interactive figures tailored for the respective analyses using qMRLab’s Python classes for visualization. Each step, from data fitting to statistical analysis, can then be combined in a single JN using the DI1 and be made executable online using BinderHub. Using these tools, substantial effort is directed towards publishing interactive tutorials on qMRI topics. To guide users along the production of such research objects, guidelines are also provided on our website.
Results
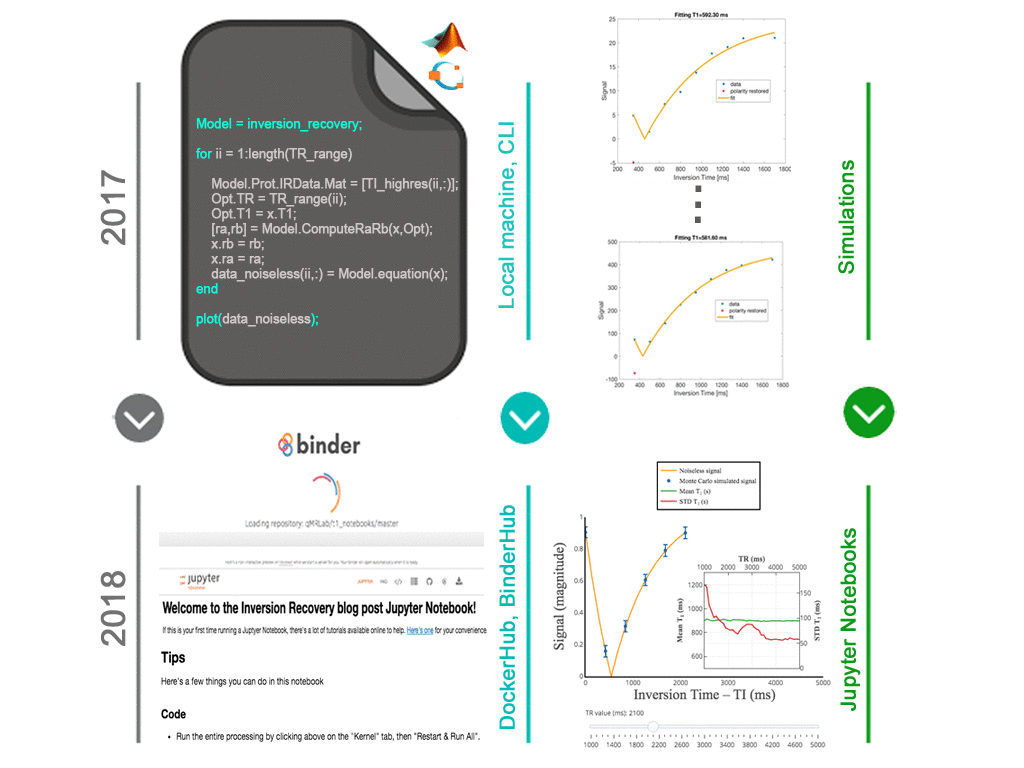
The inversion recovery (IR) T1 mapping MATLAB/Octave method from qMRLab is combined with the interactive Python objects in an online-executable JN (https://neuropoly.pub/ir_binder), making use of the DI1 (Fig.2).
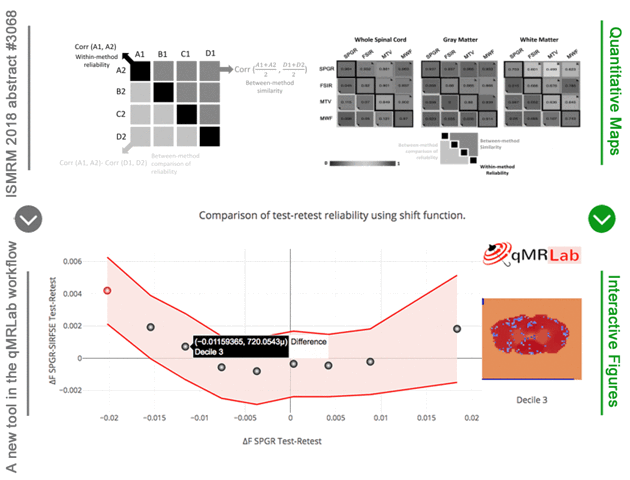
Fig.3 demonstrates how interactive figures can provide an intuitive way to browse the results from a statistical analysis. Thanks to the statistics module and the DI1, a qMRLab workflow can generate and publish interactive figures associated with a particular statistical analysis.
Discussion and Conclusion
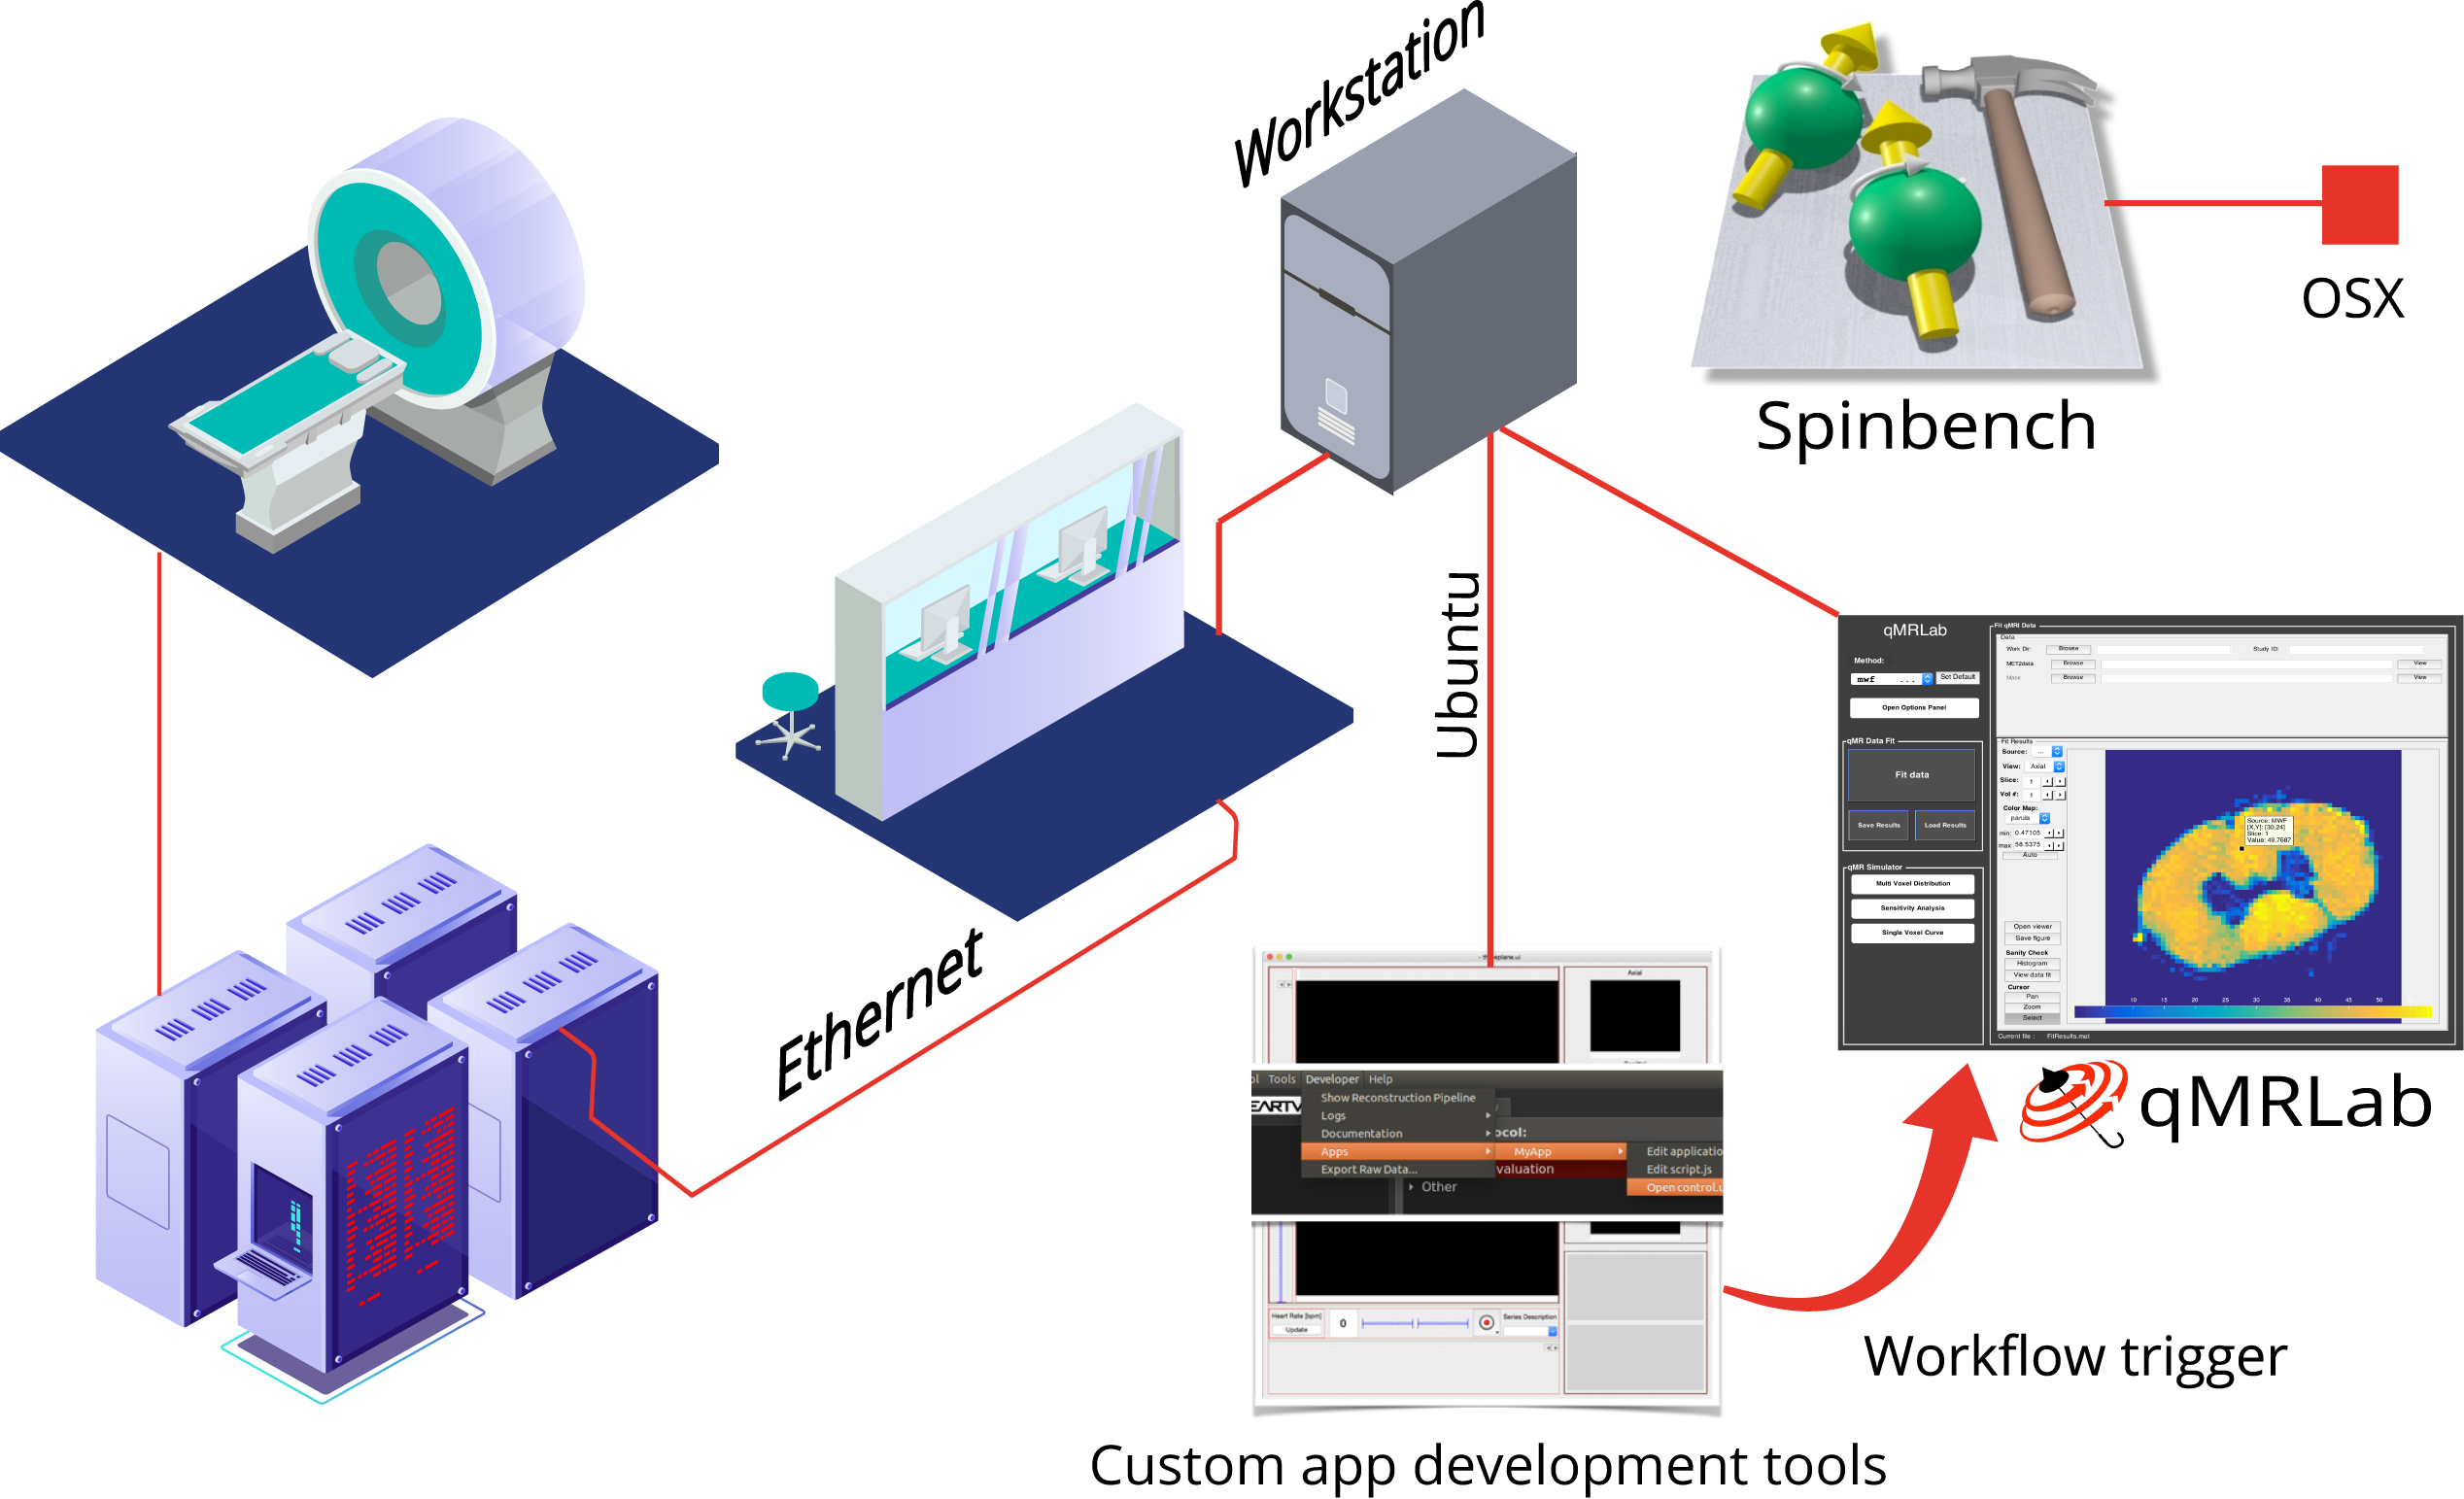
A typical qMRI processing workflow is composed of (i) acquisition, (ii) data organization, (iii) preprocessing and (iv) fitting, which can then be extended to the (v) statistical analyses and (vi) included in a publication. Currently, qMRLab spans steps (iv - vi). For step (i) we plan to use a custom development platform (RTHawk, HeartVista Inc.) that enables the creation of dedicated qMRI applications on which qMRLab can be integrated (Fig.4). This is an ongoing effort, and future developments will provide proof-of-concept applications for qMRLab workflows that involve acquisition. For step (ii) and (iii) we are working with the team behind the Brain Imaging Data Structure (BIDS)7 to ensure interoperability (BIDS apps8) and compatibility across sites of the data processed with qMRLab.
As the list of available qMRI methods grows with the contributions from our community, qMRLab taps into modern software technologies to establish proficient procedures to execute and publish them. By bringing in-house processing routines under one umbrella, the qMRLab workflow shows the way forward for reproducible MRI research.
Acknowledgements
Funded by Canadian Open Neuroscience Platform (CONP), Montreal TransMedTech Institute, Montreal Heart Institute Foundation and Natural Sciences and Engineering Research Council of Canada (NSERC) discovery grant.References
[1] Kluyver et al., ELPUB, 2016. 87-90
[2] Glatard et al.,GigaScience, 2018. 7:5
[3] Duval et al., Proceedings of the ISMRM-ESMRMB Joint Annual Meeting, Paris, 2018.
[4] Bilgic et al., Magn Reson Med, 2014. 72:1444-1459
[5] Pernet et al., Frontiers in psychology, 2013. 3:606
[6] Karakuzu et al., Proceedings of the ISMRM-ESMRMB Joint Annual Meeting, Paris, 2018.
[7] Gorgolewski et al., Scientific Data, 2016. 3:160044
[8] Gorgolewski et al., PLos Computational Biology, 2017. 13:e105209
Figures