4828
A Cloud Platform for Longitudinal Follow-up for Patients with Glioblastoma1Emory University, Atlanta, GA, United States
Synopsis
Patients diagnosed with glioblastoma are typically treated with a combination of stereotactic surgical resection followed by chemoradiation. Follow-up of these patients post-treatment involves regular imaging to identify disease recurrence and plan adjuvant therapies. In this work, we present a cloud app that will facilitate radiologists and the treating physician team in quantitatively tracking post-treatment disease course using semi-automated segmentation of tumor and a structured scoring system to standardize monitoring of disease progression.
Introduction
Glioblastoma is a primary adult brain tumor with universal mortality, with median progression free survival often being 5-8 months after completion of aggressive therapies including stereotactic surgical resection, followed by chemoradiation therapy (1,2). Several criteria have been established to assess disease progression in the follow-up period, including RANO (3) and the newly described Brain Tumor Reporting and Data System (BT-RADS) framework (4). Such criteria involve radiologic assessment of the tumor based on gadolinium contrast-enhanced T1-weighted (CE-T1w) MRI and fluid attenuation inversion recovery (FLAIR) imaging. Radiologists need to determine whether there are any changes in the volume of enhancement and/or FLAIR abnormality as part of the follow-up assessment; however, this is typically done qualitatively by visual inspection or by measurement of the tumor diameter along its largest axis. In this work, we present an online framework that seeks to facilitate quick and easy imaging follow-up that can fit to busy clinical workflow and quantitatively assess changes in tumor volume.Methods
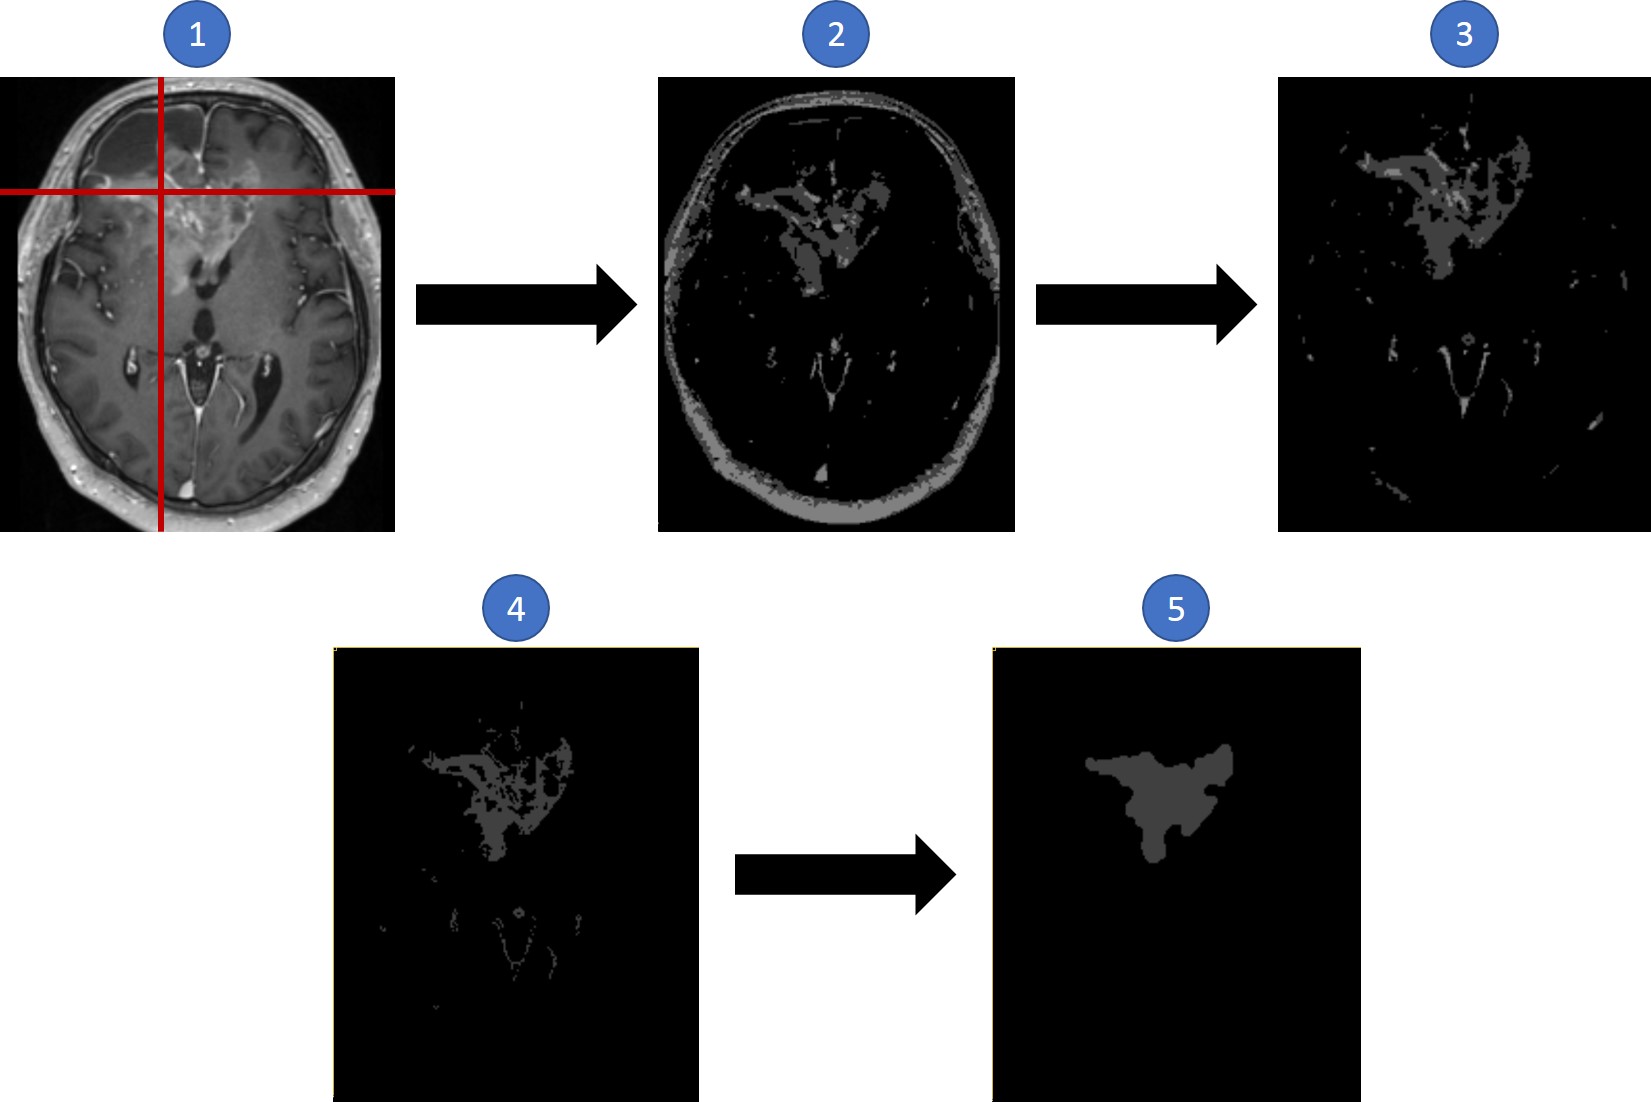
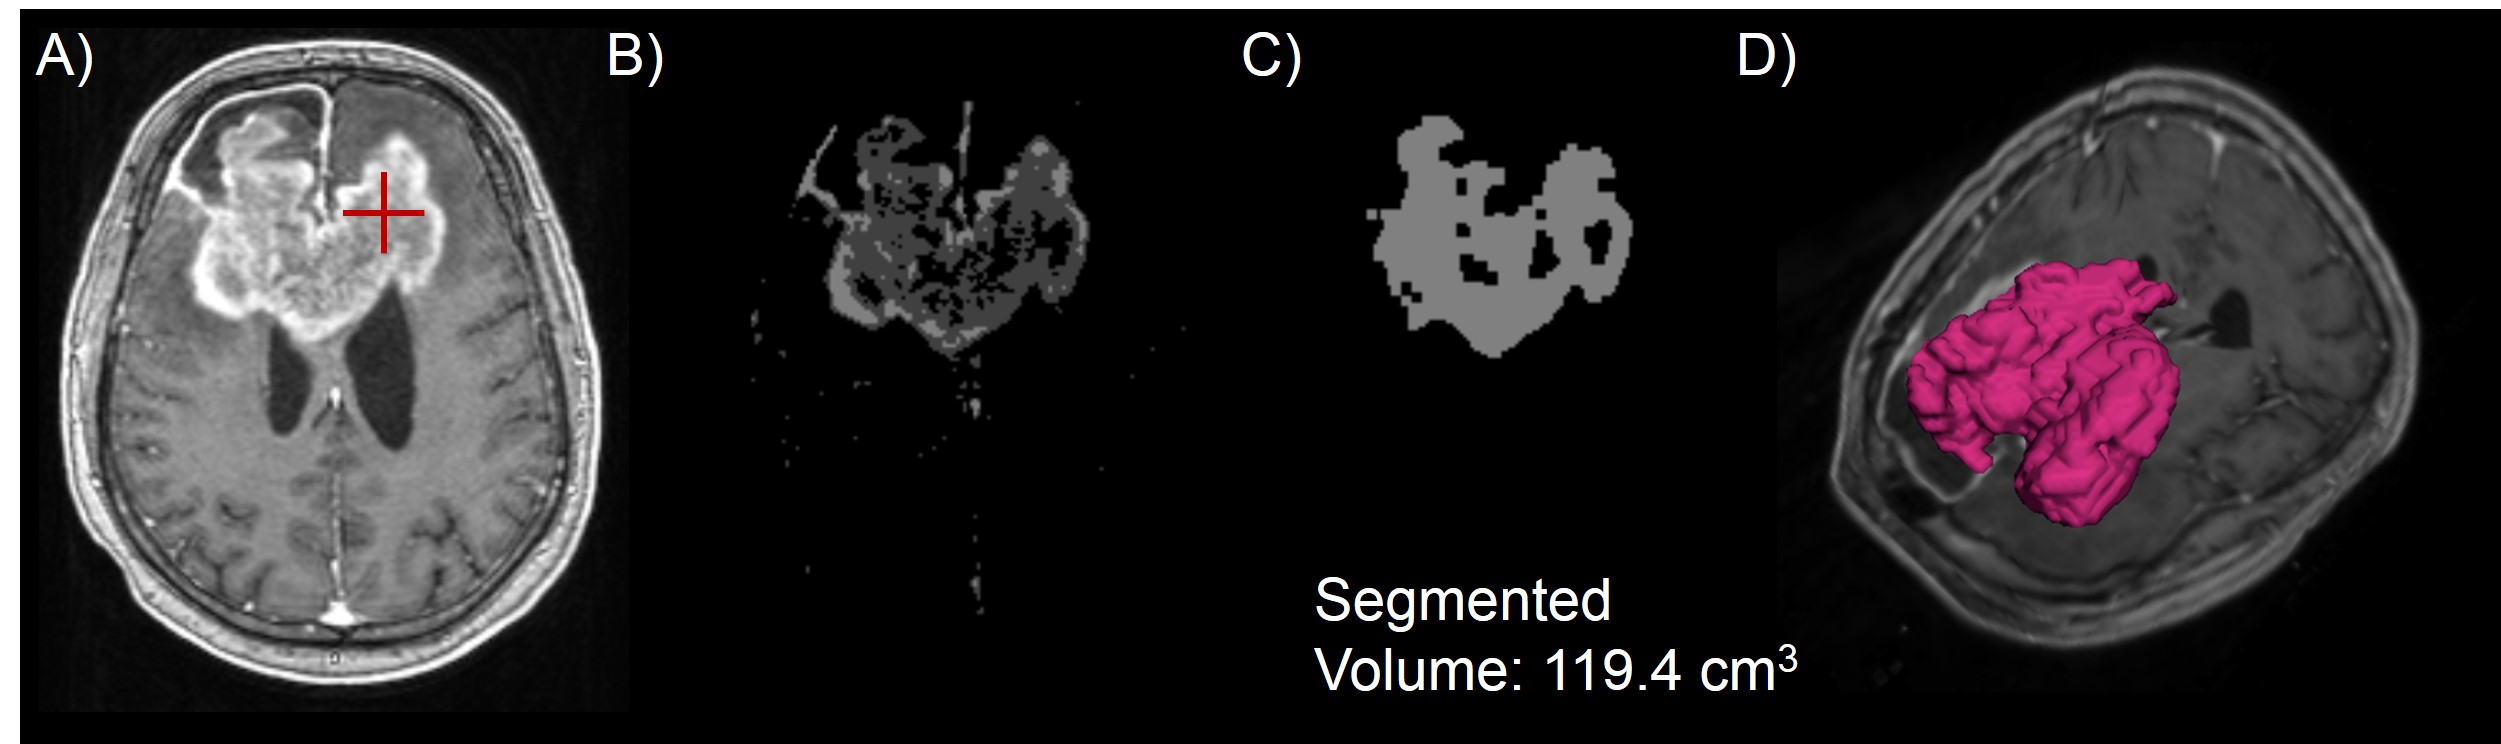
Using the framework of our previously described online brain imaging platform, the Brain Imaging Collaboration Suite (5), we created the Longitudinal Imaging Tracking (LIT) module (Figure 1). DICOM volumes of CE-T1w and FLAIR images can be imported into LIT, wherein they are automatically co-registered using rigid registration based on 3D versors (6) and aligned using trilinear interpolation. This enables simultaneous voxel-to-voxel comparisons across multiple scan dates. CT images used for radiation therapy planning and final radiation dose maps can also be imported for better localization of disease progression within or without the high dose field. Additional metadata can be stored for each image, such as tumor volume based on enhancement or FLAIR hyperintensity, and each follow-up timepoint, such as the BT-RADS score. Segmentations, whether algorithm-generated or user-created, can be displayed in 3D volumetric fashion, enabling more quantitative metrics for follow-up. To more objectively quantify disease, LIT implements a semi-automatic algorithm to segment lesions in CE-T1w images (Figure 2). The segmentation tool requires the clinician to select a representative “seed” in the image within the lesion of interest. Next, Otsu thresholding using four classes is applied to cluster the image voxels (7). The four-threshold image is registered to an atlas and the skull removed through a skull stripping algorithm (8). A region growing algorithm starting as the user input seed is applied to identify connected components within the specified cluster. Finally, morphological filtering is applied to remove linear structures, e.g. blood vessels and choroid plexus, and to smooth out spurs along the tumor edge. The algorithm was run on 10 studies from 2 subjects with glioblastoma. To test the reliability of segmentation tool with differing user seed selection, the algorithm was run multiple times on subjects in a test-retest fashion.Results
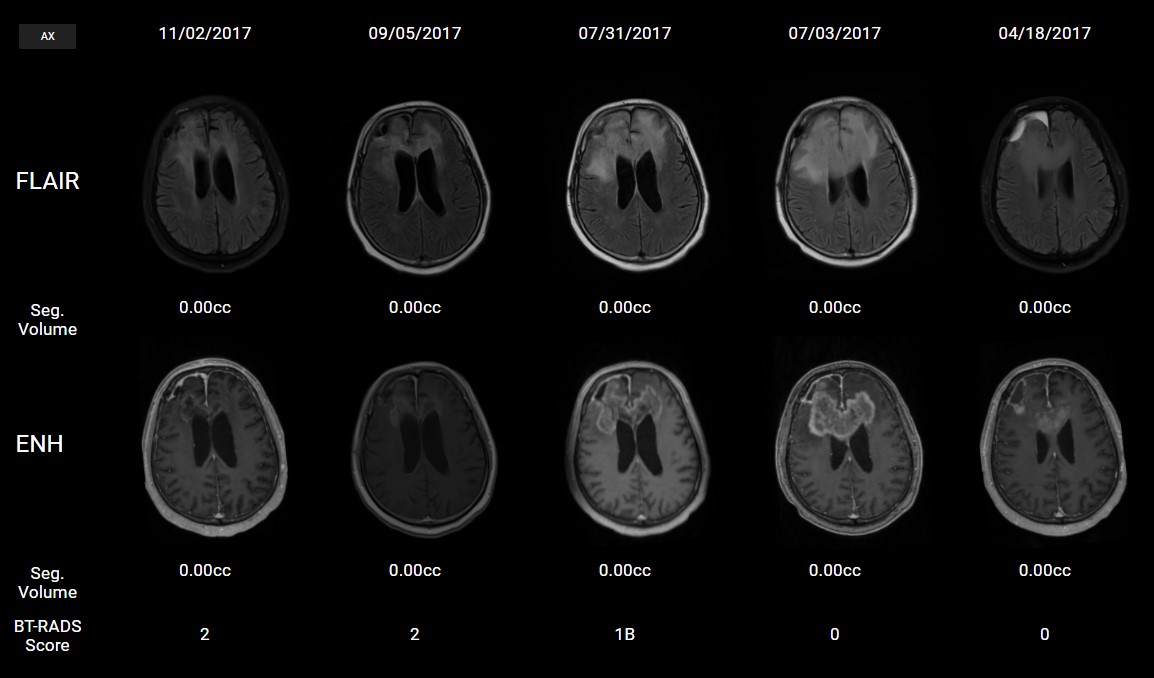
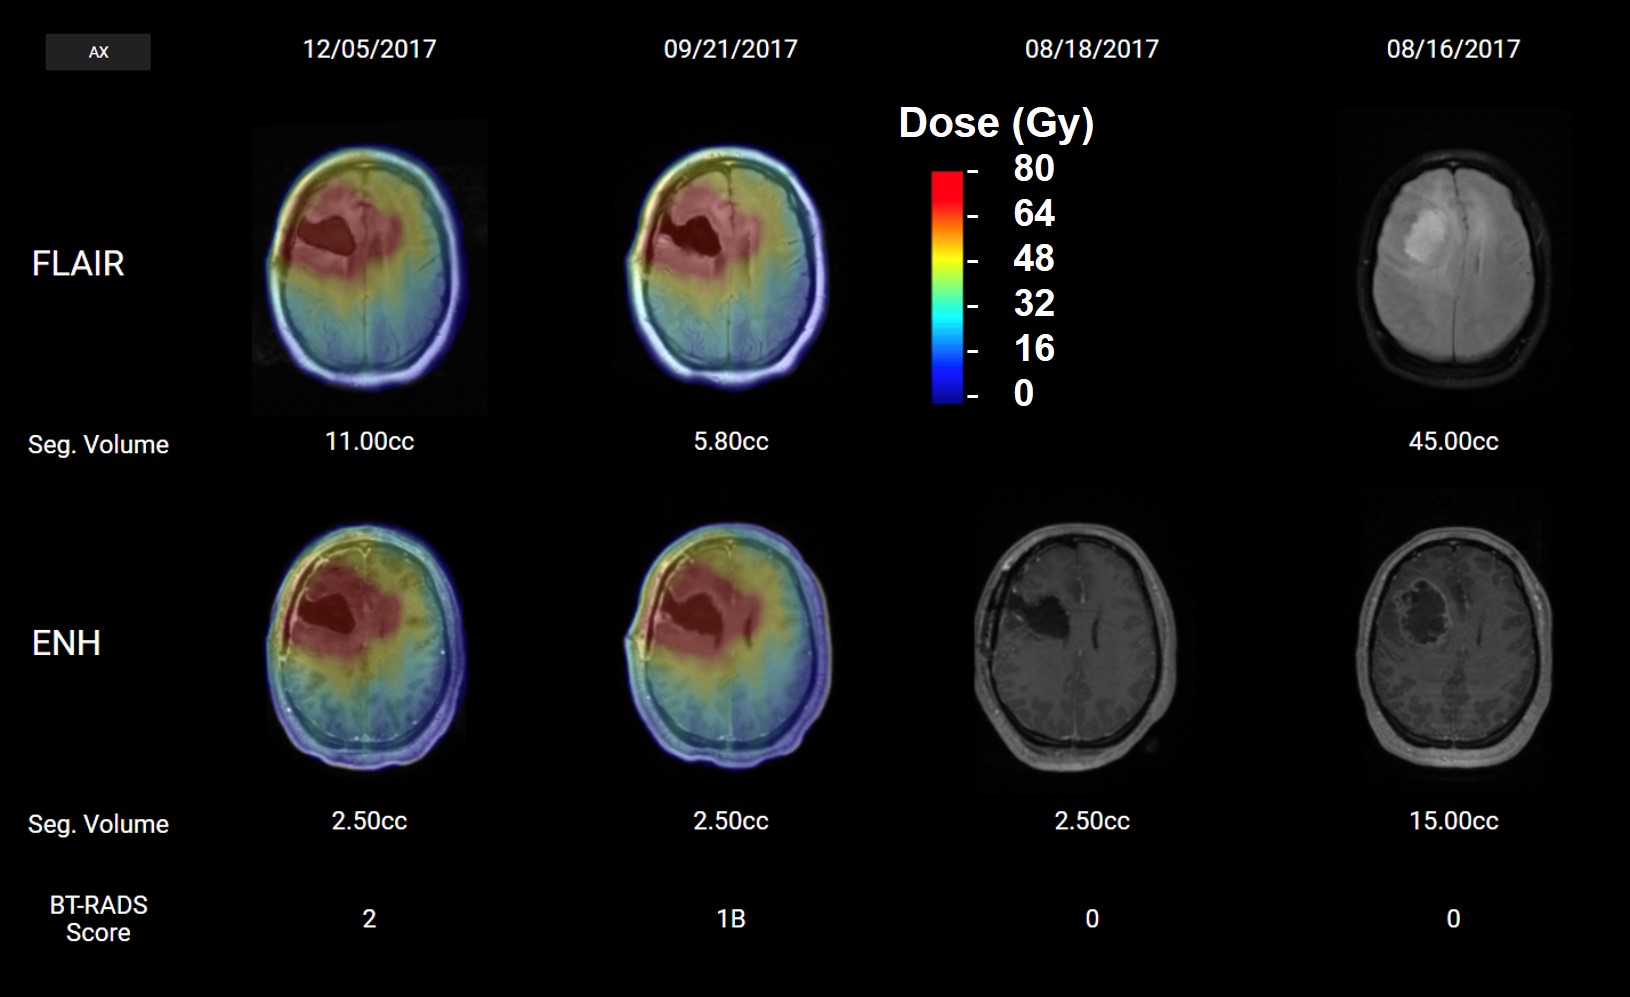
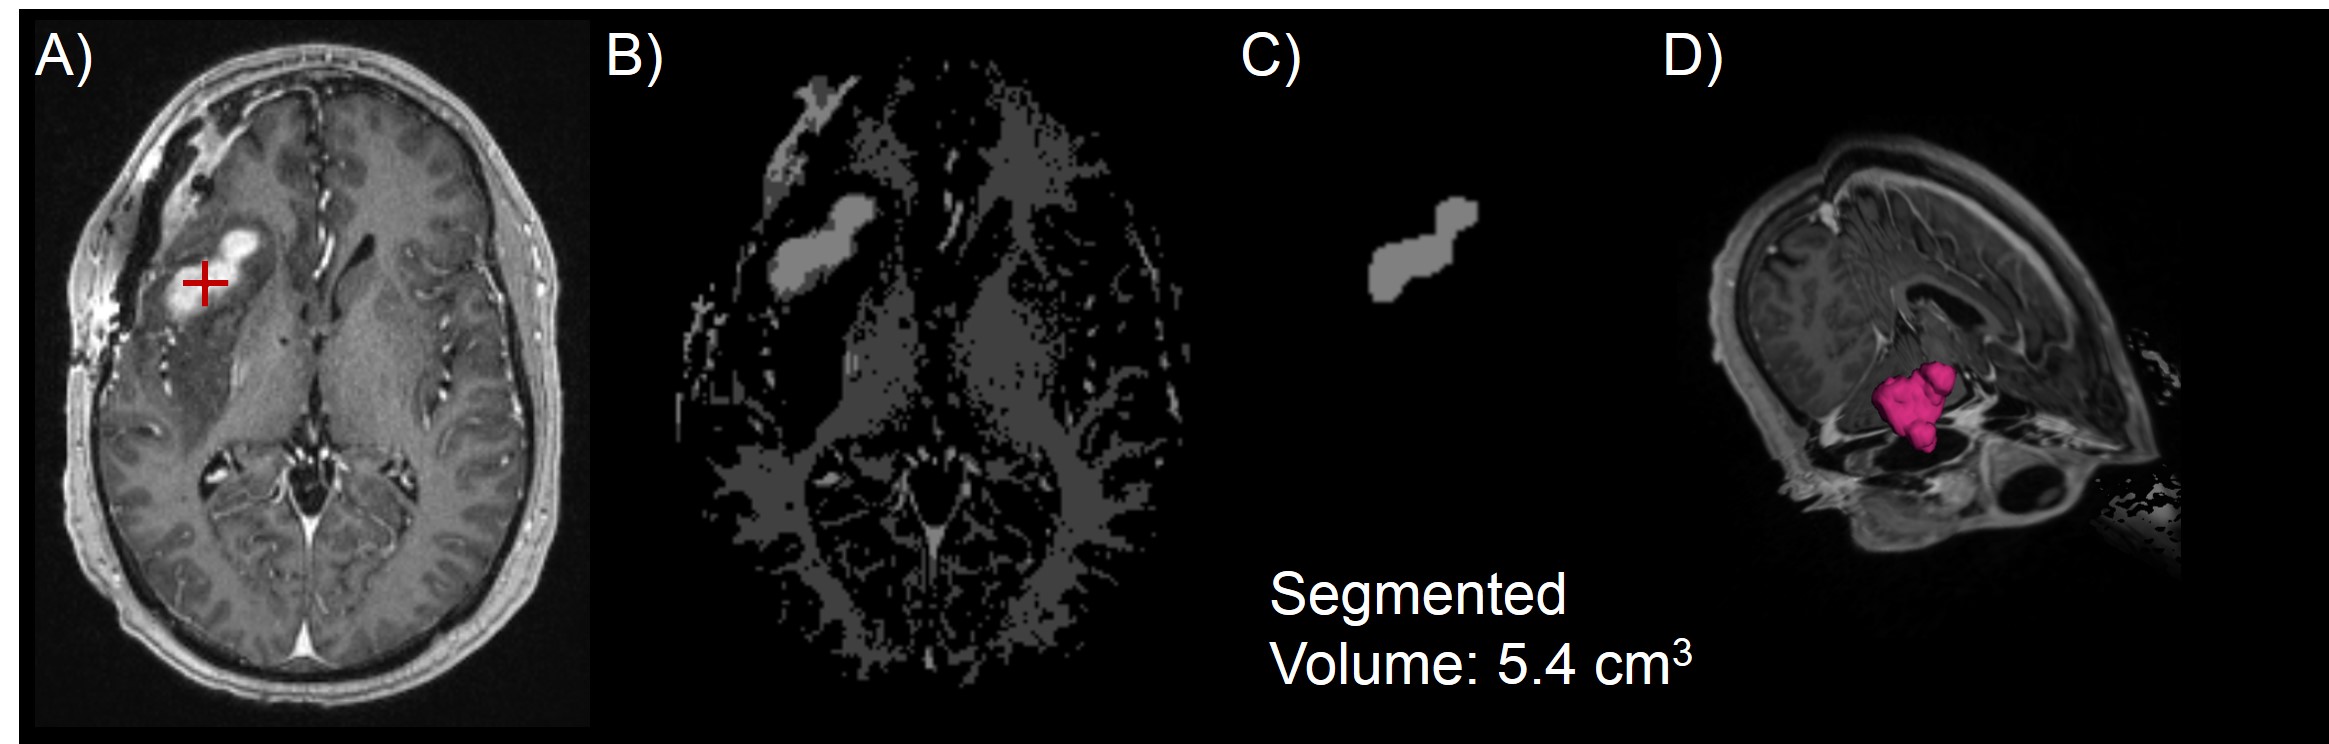
Studies from multiple subjects were successfully imported into LIT with multiple follow-up time points. Figure 3 shows a subject on an ongoing dose escalation study with ~3 months of follow-up imaging. For images taken post-radiation, the dose map is overlaid in color-wash, indicating doses up to 75 Gy. This would allow for monitoring if the tumor is spreading in-field or out-of-field. Once all volumes are registered, bringing up all data for a patient takes < 5 seconds, enabling it to be easily used in a clinical setting. Figures 4 and 5 show two representative studies with segmentations of the CE-T1w volume. Test-retest was performed 5 times on 2 different studies, each time requesting the user to place a seed within the region of contrast enhancement. The precision of the segmented volume was 100% as long as the user placed the seed within contrast-enhancing tissue. If the seed was placed outside of contrast enhancement, then the algorithm failed since it could not properly region grow.Conclusion
We have developed a cloud platform that can quantitatively track disease progression in subjects with glioblastoma. This will assist in collaborative follow-up by the patient’s treatment team, e.g. in a “tumor board” setting. We hope to continue to develop this module to incorporate additional features to assist clinicians, such as segmentation of FLAIR hyperintensity, reporting of statistical features such as volume, surface area, and kurtosis, and estimation of standardized scores such as BT-RADS. These quantitative techniques could provide more objective follow-up metrics for clinical studies involving patients with glioblastoma.Acknowledgements
This work is funded by NIH grants R01CA214557 and F30CA206291.References
1. Stupp R, Hegi ME, Mason WP, van den Bent MJ, Taphoorn MJB, Janzer RC, Ludwin SK, Allgeier A, Fisher B, Belanger K, Hau P, Brandes AA, Gijtenbeek J, Marosi C, Vecht CJ, Mokhtari K, Wesseling P, Villa S, Eisenhauer E, Gorlia T, Weller M, Lacombe D, Cairncross JG, Mirimanoff R-O, European Organisation for R, Treatment of Cancer Brain T, Radiation Oncology G, National Cancer Institute of Canada Clinical Trials G. Effects of radiotherapy with concomitant and adjuvant temozolomide versus radiotherapy alone on survival in glioblastoma in a randomised phase III study: 5-year analysis of the EORTC-NCIC trial. Lancet Oncol 2009;10(5):459-466.
2. Ostrom QT, Gittleman H, Liao P, Vecchione-Koval T, Wolinsky Y, Kruchko C, Barnholtz-Sloan JS. CBTRUS Statistical Report: Primary brain and other central nervous system tumors diagnosed in the United States in 2010–2014. Neuro-Oncology 2017;19(suppl_5):v1-v88.
3. Wen PY, Macdonald DR, Reardon DA. Updated response assessment criteria for high-grade gliomas: response assessment in neuro-oncology working group. Journal of Clinical Oncology 2010.
4. Weinberg BD, Gore A, Shu H-KG, Olson JJ, Duszak R, Voloschin AD, Hoch MJ. Management-Based Structured Reporting of Posttreatment Glioma Response With the Brain Tumor Reporting and Data System. Journal of the American College of Radiology 2018;15(5):767-771.
5. Gurbani S, Weinberg B, Mellon E, Schreibmann E, Sheriff S, Maudsley AA, Goryawala M, Cooper L, Shu H-K, Shim H. The Brain Imaging Collaboration Suite (BrICS): a cloud platform for integrating whole-brain spectroscopic MRI into the radiation therapy planning workflow. Tomography 2018;in press.
6. Yoo TS, Ackerman MJ, Lorensen WE, Schroeder W, Chalana V, Aylward S, Metaxas D, Whitaker R. Engineering and algorithm design for an image processing API: a technical report on ITK-the insight toolkit. Studies in health technology and informatics 2002:586-592.
7. Otsu N. A threshold selection method from gray-level histograms. IEEE transactions on systems, man, and cybernetics 1979;9(1):62-66.
8. Bauer S, Fejes T, Reyes M. A skull-stripping filter for ITK. Insight Journal 2013;2012.
Figures