4827
SEPIA – SuscEptibility mapping PIpeline tool for phAse images1Donders Institute for Brain, Cognition and Behaviour, Radboud University, Nijmegen, Netherlands
Synopsis
With the ever-increasing number of quantitative susceptibility mapping (QSM) methods and research applications, it becomes difficult for application-driven researchers to choose a (best) QSM method or pipeline for their study. Here, we present a susceptibility mapping pipeline tool for phase images (SEPIA) which includes a user interface for non-experienced users and the possibility of generating code that can be used for scripting large studies. SEPIA incorporates various QSM toolboxes available in Matlab as well as a wide range of methods to process MR phase data, including signal phase unwrapping, background field removal and field-to-source inversion.
Introduction
Quantitative susceptibility mapping (QSM) is a novel contrast mechanism to study magnetic properties of brain tissues using MRI. Brain tissues that contain paramagnetic substances (e.g. ferritin) can be easily distinguished from the tissues that contain diamagnetic substances (e.g. myelin and calcification) in a magnetic susceptibility map, as the two types of substances generate an opposite contrast1. Studies have shown that susceptibility values can be useful to quantify brain iron in deep grey matter2,3. However, computation of a magnetic susceptibility map from a multi-echo GRE (mGRE) data is not straightforward and consists of various steps including the ill-conditioned field-to-source inversion problem1. Several groups of researchers have published their QSM-related methods and codes online4-8, allowing researchers to access the most updated methods available in the field, yet the compatibility between different tools is not always straightforward.
Given the increasing interest in applying QSM to learn more about brain maturation and degeneration amongst other applications, having a pipeline tool that allows researchers to have access to a wider range of methods that are automatically integrated is of great interest. To achieve these goals, we developed SuscEptibility mapping PIpeline tool for phAse images (SEPIA) for neuroimaging application.Methods
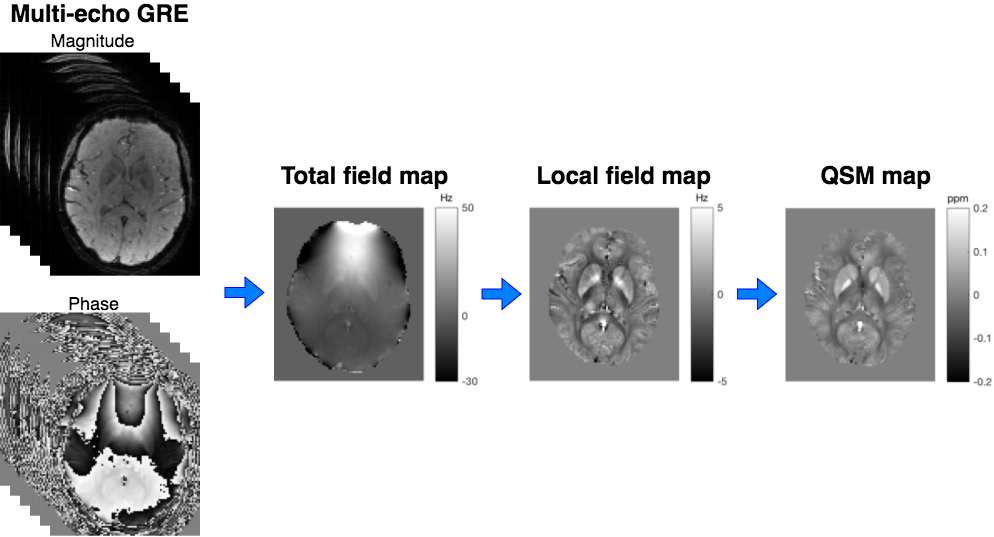
SEPIA is a pipeline tool that incorporates the MEDI toolbox (updated 25 June 2018)4, STI Suite (v3.0)5 and FANSI toolbox (commitd33759b9)8 amongst other QSM implementations from literature (Figure 1). It is developed in Matlab R2016b (Mathworks, NA, USA) and provides the following key features to process 3D mGRE data:
Core functionality (Figure 2)
- Phase unwrapping: 4 methods are provided to unwrap signal phase of each echo, including: region growing9, Laplacian unwrapping10,11, graph-cut12 and 3D best path13 approaches. Furthermore, two methods are provided to recover the total field map (in Hz) from different echo times based on: weighted echo combination14 and non-linear data fitting15-17 respectively. Optional features include eddy current phase correction in the case of bipolar readout strategies.
- Background field removal: To compute brain tissue magnetic susceptibilities, it is important to remove the background field contributions (such as those generated by air/tissue interface) from the measured total field. SEPIA supports 5 algorithms to remove the fields that are not originated from brain tissues. Optionally, a 4-th order polynomial fitting function is provided to remove any residual B1+/- field in the resulting local field map (in Hz).
- QSM dipole inversion: In total 7 QSM dipole inversion algorithms are provided to compute a susceptibility map (in ppm), including: TKD18,19, closed-formed solution with L2-regularisation20, MEDI21, Star-QSM22 and fast nonlinear susceptibility inversion (FANSI)7.
All these functions can be accessed as a one-step QSM pipeline or as a standalone application (Figure 2). Care was taken to ensure consistency of the units expected by the different software packages.
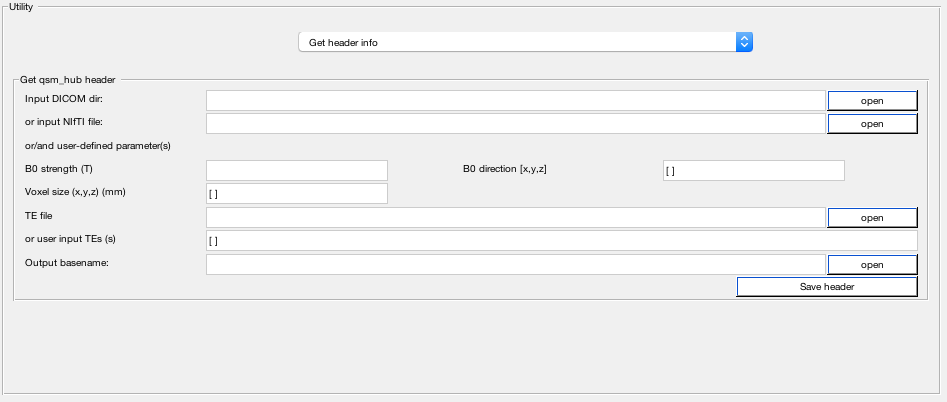
Data Input/Output
The complex-valued 3D mGRE data can be read in either NIfTI or DICOM formats. Importing NIfTI data requires users to select 4D (row, column, slice, time) phase and magnitude data in the GUI. SEPIA provides a semi-automatic function to generate a Matlab MAT-file that contains information including echo time, field strength and field direction, which is essential for QSM processing. This is done by extracting data directly from NIfTI/text/JSON header files with optional user input (Figure 3). The outputs of SEPIA are in NIfTI format.
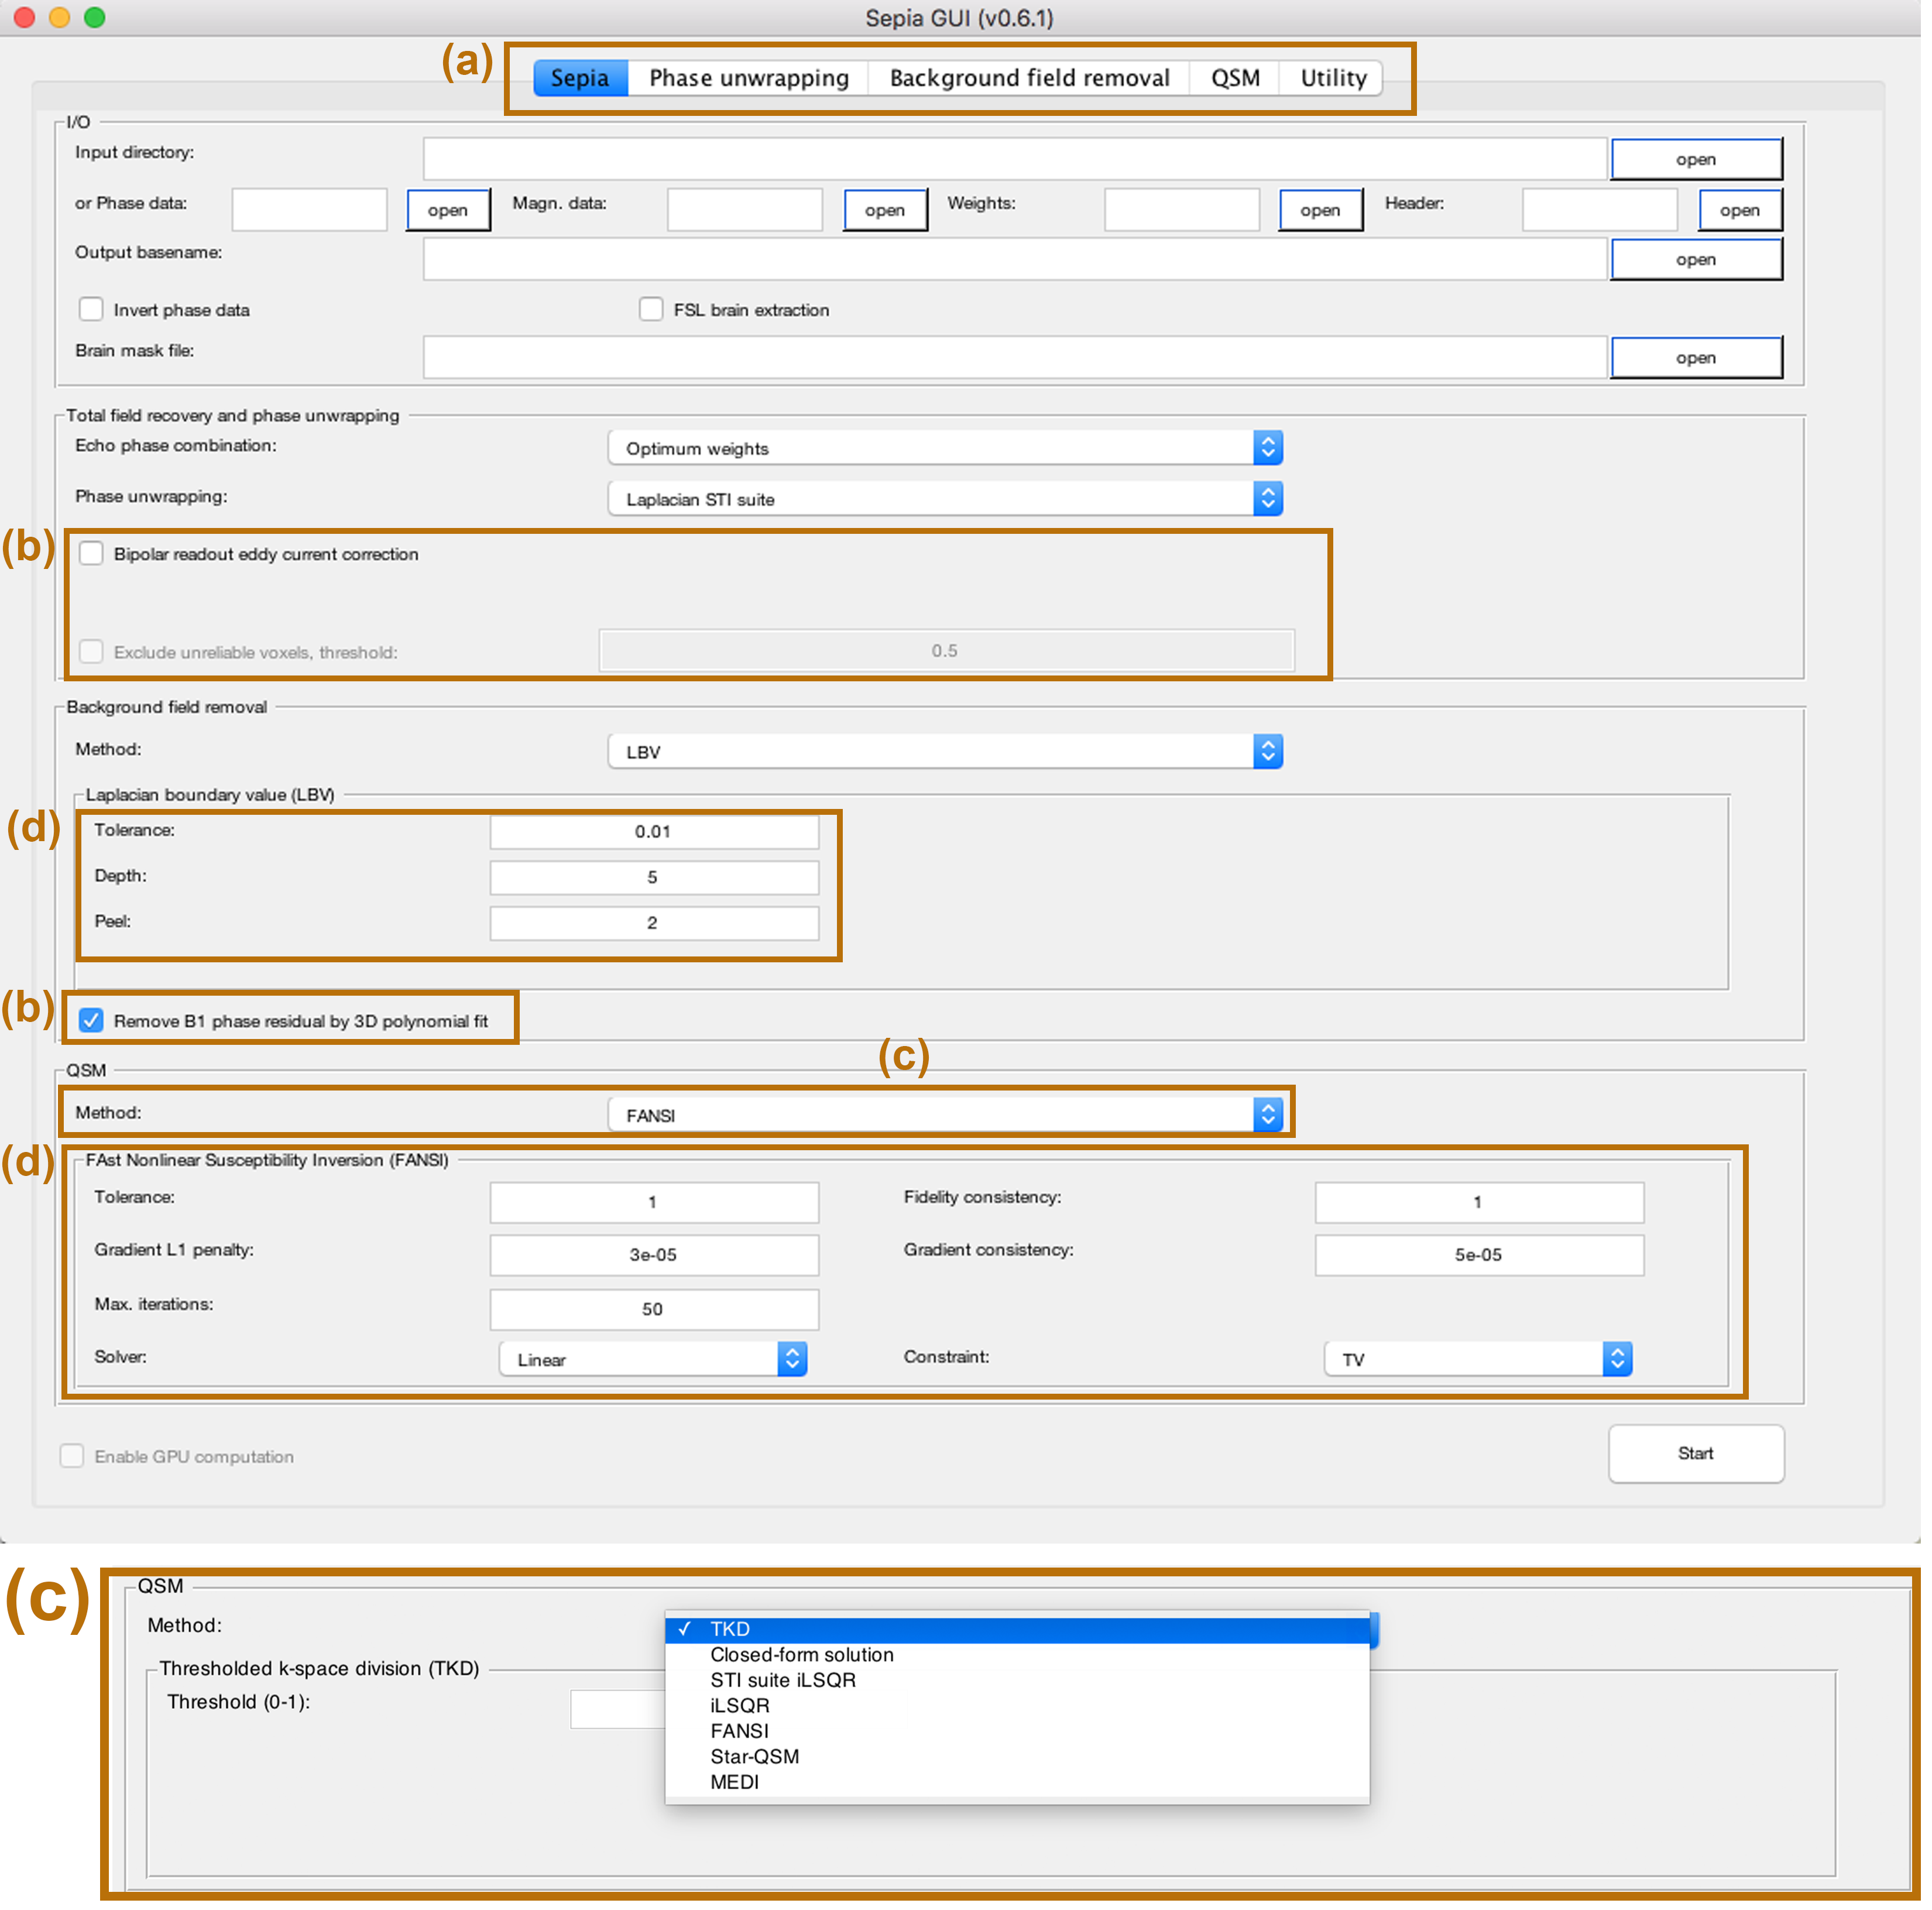
Graphical user interface (GUI)
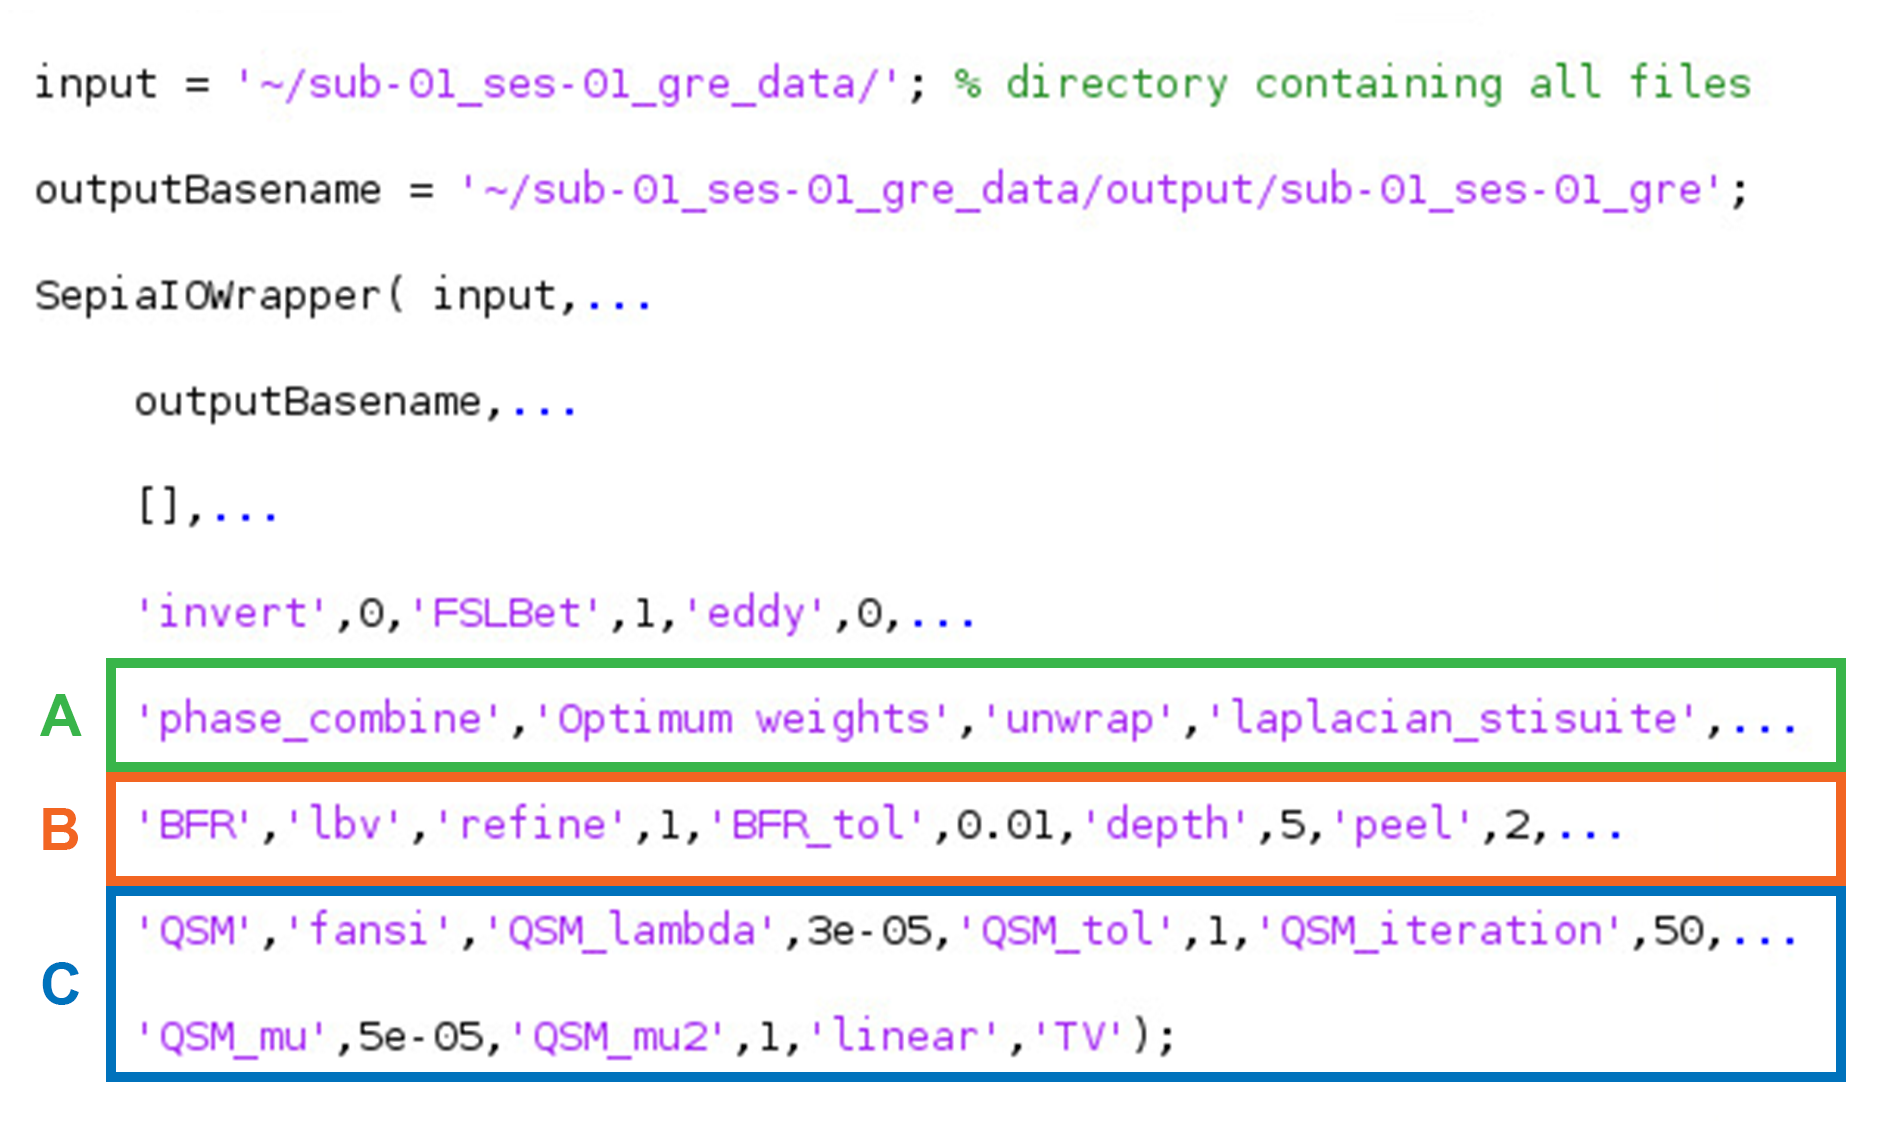
A graphical user interface provides easy access to explore different algorithm parameters such as regularisation weighting on QSM result. It also simplifies the process of using different QSM processing pipelines. Batch processingAfter running each processing pipeline, a log file is generated which contains the Matlab commands that run SEPIA with the user-defined algorithm parameters to produce the results (Figure 4). This file is particularly useful for batch processing data with the exact same setting across multiple subjects, allowing straightforward parallelisation in various platforms.
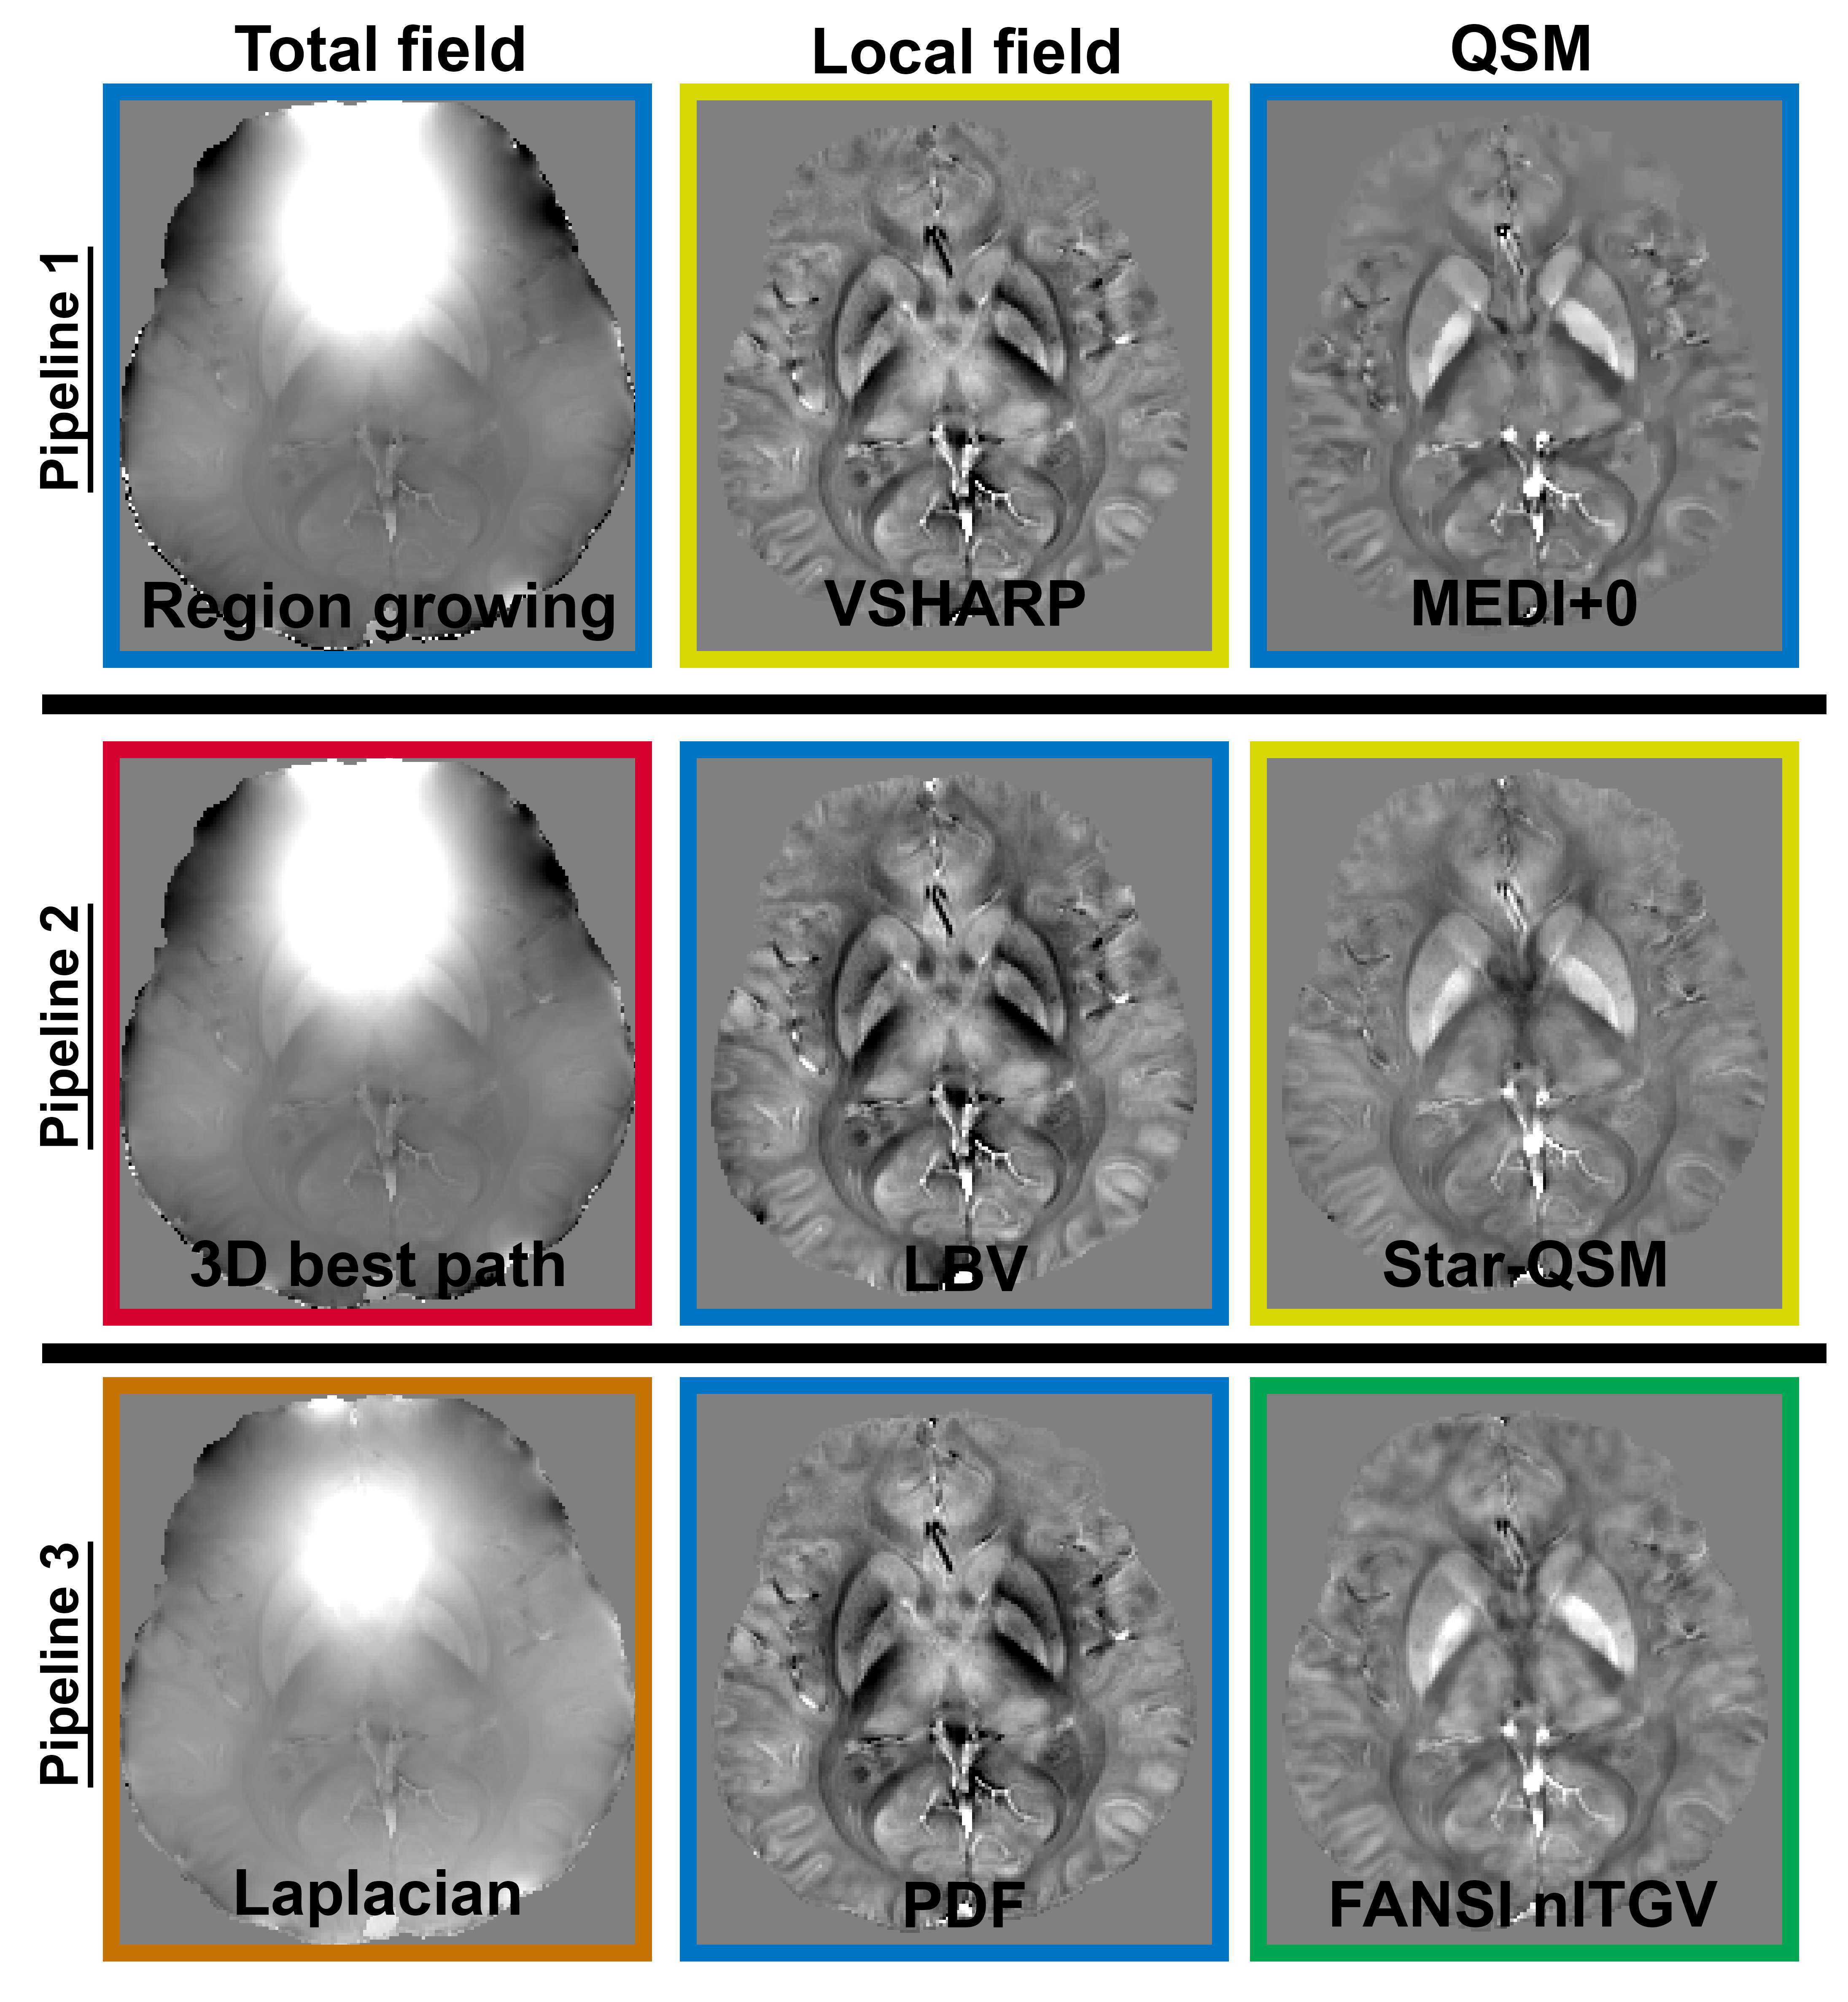
As an example, Figure 5 shows the possibilities of mixing and matching various toolboxes’ methods to reconstruct QSM maps from the same data.
Summary
SEPIA allows QSM processing to be performed with a user-friendly GUI in Matlab, which makes this complex pipeline usable by less-experienced public in MR physics and in software implementation.
By incorporating three popular QSM toolboxes and demonstrated methodologies described in literature14,23,24, SEPIA allows users to mix and match processing features developed by different groups into one single pipeline. The ability to obtain a self-containing command line can be useful in both optimising the reconstruction process of single subjects and applying a desired analysis to large studies.
The code is freely available and a full documentation can be found in GitHub (https://github.com/kschan0214/sepia).
Acknowledgements
This work is part of the research programme with project number FOM-N-31/16PR1056/RadboudUniversity, which is financed by the Netherlands Organisation for Scientific Research (NWO).References
- Wang, Y. & Liu, T. Quantitative susceptibility mapping (QSM): Decoding MRI data for a tissue magnetic biomarker. Magn Reson Med73,82–101 (2014).
- Langkammer, C. et al.Quantitative susceptibility mapping (QSM) as a means to measure brain iron? A post mortem validation study. Neuroimage62,1593–1599 (2012).
- Sun, H. et al.Validation of quantitative susceptibility mapping with Perls' iron staining for subcortical gray matter. Neuroimage105,486–492 (2015).
- Cornell MRI Research Lab 2018, accessed 29 September 2018, http://pre.weill.cornell.edu/mri/pages/qsm.html.
- Chulei Liu 2017, University of California, Berkeley, accessed 29 September 2018, https://people.eecs.berkeley.edu/~chunlei.liu/software.html.
- Sun Hong Fu 2018, GitHub, accessed 29 September 2019, https://github.com/sunhongfu/QSM.
- Langkammer, C. et al.Fast quantitative susceptibility mapping using 3D EPI and total generalized variation. Neuroimage111,622–630 (2015).
- Milovic, C., Bilgic, B., Zhao, B., Acosta-Cabronero, J. & Tejos, C. Fast nonlinear susceptibility inversion with variational regularization. Magn Reson Med 80, 814–821 (2018).
- Witoszynskyj, S., Rauscher, A., Reichenbach, J. R. & Barth, M. Phase unwrapping of MR images using ΦUN – A fast and robust region growing algorithm. Medical Image Analysis 13, 257–268 (2009).
- Schofield, M. A. & Zhu, Y. Fast phase unwrapping algorithm for interferometric applications. Opt Lett 28, 1194–1196 (2003).
- Li, W., Wu, B. & Liu, C. Quantitative susceptibility mapping of human brain reflects spatial variation in tissue composition. Neuroimage 55, 1645–1656 (2011).
- Dong, J. et al. Simultaneous phase unwrapping and removal of chemical shift (SPURS) using graph cuts: application in quantitative susceptibility mapping. IEEE Transactions on Medical Imaging 34, 531–540 (2015).
- Abdul-Rahman, H. S. et al.Fast and robust three-dimensional best path phase unwrapping algorithm. Applied Optics46,6623–6635 (2007).
- Robinson, S. D. et al. An illustrated comparison of processing methods for MR phase imaging and QSM: combining array coil signals and phase unwrapping. NMR Biomed 30, e3601 (2017).
- Liu, T. et al. Nonlinear formulation of the magnetic field to source relationship for robust quantitative susceptibility mapping. Magn Reson Med 69, 467–476 (2012).
- Kressler, B. et al. Nonlinear Regularization for Per Voxel Estimation of Magnetic Susceptibility Distributions From MRI Field Maps. IEEE Transactions on Medical Imaging 29, 273–281 (2010).
- de Rochefort, L., Brown, R., Prince, M. R. & Wang, Y. Quantitative MR susceptibility mapping using piece-wise constant regularized inversion of the magnetic field. Magn Reson Med 60, 1003–1009 (2008).
- Wharton, S., Schäfer, A. & Bowtell, R. Susceptibility mapping in the human brain using threshold-based k-space division. Magn Reson Med 63, 1292–1304 (2010).
- Shmueli, K. et al. Magnetic susceptibility mapping of brain tissue in vivo using MRI phase data. Magn Reson Med 62, 1510–1522 (2009).
- Bilgic, B. et al. Fast image reconstruction with L2‐regularization. J Magn Reson Imaging 40, 181–191 (2014).
- Liu, Z., Spincemaille, P., Yao, Y., Zhang, Y. & Wang, Y. MEDI+0: Morphology enabled dipole inversion with automatic uniform cerebrospinal fluid zero reference for quantitative susceptibility mapping. Magn Reson Med 79, 2795–2803 (2018).
- Wei, H. et al. Streaking artifact reduction for quantitative susceptibility mapping of sources with large dynamic range. NMR Biomed 28, 1294–1303 (2015).
- Deistung, A., Schweser, F. & Reichenbach, J. R. Overview of quantitative susceptibility mapping. NMR Biomed 30, (2016).
- Schweser, F., Robinson, S. D., de Rochefort, L., Li, W. & Bredies, K. An illustrated comparison of processing methods for phase MRI and QSM: removal of background field contributions from sources outside the region of interest. NMR Biomed 30, (2016).
Figures