4825
High reproducibility and robustness to lesions, but large software and scanner effects for mean upper cervical cord area (MUCCA) measurement in MSMerlin M Weeda1, Sander M Middelkoop1, Martijn D Steenwijk2, Marita Daams1, Houshang Amiri1, Iman Brouwer1, Joep Killestein3, Bernard MJ Uitdehaag3, Iris Dekker3, Carsten Lukas4, Barbara Bellenberg4, Frederik Barkhof1,5, Petra JW Pouwels1, and Hugo Vrenken1
1Department of Radiology and Nuclear Medicine, MS Center Amsterdam, Amsterdam Neuroscience, Amsterdam UMC - location VUmc, Amsterdam, Netherlands, 2Department of Anatomy and Neurosciences, MS Center Amsterdam, Amsterdam Neuroscience, Amsterdam UMC - location VUmc, Amsterdam, Netherlands, 3Department of Neurology, MS Center Amsterdam, Amsterdam Neuroscience, Amsterdam UMC - location VUmc, Amsterdam, Netherlands, 4Diagnostic and Interventional Radiology and Nuclear Medicine, St. Josef Hospital, Ruhr University, Bochum, Germany, 5Institutes of Neurology and Healthcare Engineering UCL, London, United Kingdom
Synopsis
Atrophy of the spinal cord is known to occur in multiple sclerosis (MS). To measure such atrophy, the mean upper cervical cord area (MUCCA) can be assessed. We tested five different (semi-)automated spinal cord segmentation methods (SCT-PropSeg, SCT-DeepSeg, ITK-SNAP, NeuroQLab, Xinapse JIM) in terms of their reproducibility, robustness, and the influence of lesions on the segmentations. MUCCA from all scanners was highly reproducible within-scanner, but not between-scanner or between-methods. The presence of lesions in the upper cervical cord did not affect the accuracy of MUCCA measurements in any of the methods tested.
Background
Multiple sclerosis (MS) is a demyelinating and neurodegenerative autoimmune disease of the central nervous system (CNS). Abnormalities in the spinal cord such as lesions and atrophy often manifest early in the disease course and have shown to be important indicators for disease progression and prognosis1. To study these abnormalities, the mean upper cervical cord area (MUCCA) is measured using magnetic resonance imaging (MRI)2. Because manual MUCCA measurements suffer from large intra- and inter-rater variability3-6, several (semi-)automated methods have been developed, but there has been limited work comparing and validating these in clinical MR images.Aims
This study aims first to assess the reproducibility and robustness of five (semi-)automated spinal cord segmentation methods and second to investigate whether the presence of lesions in the cervical spinal cord affected the accuracy of these MUCCA measures.Methods
Five methods to measure MUCCA (SCT-PropSeg6, SCT-DeepSeg7, ITK-SNAP8, NeuroQLab9, and Xinapse JIM10) were investigated.First, within-scanner reproducibility and between-scanner robustness were assessed using intra-class correlation coefficient (ICC) and Dice’s similarity index (SI) in same-day scan-rescan 3DT1-weighted images (head coil, including cervical spine) performed on three 3T MR scanners (GE MR750, Philips Ingenuity, Toshiba Vantage Titan) in 21 relapsing-remitting (RR) MS patients and 6 healthy controls (HC) (dataset A, see Table 1). Second, sensitivity of MUCCA to lesions in the upper cervical cord was assessed with clinical cervical 3DT1-weighted images (3T GE HDxT head-neck-spine coil) in 7 MS patients without and 14 MS patients with cervical lesions (dataset B, see Table 1), using ICC and SI with manual segmentations as reference. Repeated measures ANOVA for MUCCA and for SI were used, and when appropriate, post-hoc Wilcoxon signed ranks tests (related samples) or Mann-Whitney U tests (unrelated samples) were performed. Statistical significance was obtained upon p < 0.05.
Results
In dataset A, repeated measures ANOVA for MUCCA showed main effects of vendor (p < 0.001) and method (p < 0.001), as well as an interaction between vendor and method (p = 0.025), but no effect between session (scan or rescan) or subject group (RRMS or HC) (Figure 1). Within-scanner reproducibility was highest for Xinapse JIM (ICC absolute agreement = 0.995) and lowest for ITK-SNAP (ICC absolute agreement = 0.825). Between-scanner robustness was highest for Xinapse JIM and SCT-PropSeg (ICC consistency = 0.981 and 0.976, respectively) and lowest for ITK-SNAP (ICC consistency = 0.871). Repeated measures ANOVA for SI (scan vs rescan) showed a main effect of method (p < 0.001), but not of vendor or subject group, with highest SI in Xinapse JIM and SCT-PropSeg (0.918±0.020) and lowest SI in SCT-DeepSeg (0.906±0.021) (Figure 2).In dataset B, repeated measures ANOVA for MUCCA showed a main effect of method (p < 0.001), but not of lesion group (Figure 3). However, repeated measures ANOVA for SI (automated vs manual) showed an effect of method (p < 0.001) and lesion group (p = 0.024), but no interaction between method and lesion group, with highest SI in Xinapse JIM (0.958±0.014) and lowest SI in SCT-PropSeg (0.806±0.031) (Figure 4). In post-hoc tests, no paired differences were found between the many and no lesion groups in any of the methods.
Discussion and conclusion
MUCCA measurements from all tested methods were highly reproducible within-scanner, but not between-scanner or between-methods. The presence of cervical lesions did not significantly affect MUCCA measurement accuracy. Results should be confirmed in multi-center cervical images at different vertebral levels.Acknowledgements
This work was supported by the Dutch MS Research Foundation (grant numbers 14-876 and 09-358d).References
- Kearney H, Miller DH, Ciccarelli O. Spinal cord MRI in multiple sclerosis--diagnostic, prognostic and clinical value. Nat Rev Neurol. 2015;11(6):327-38.
- Liu Z, Yaldizli O, Pardini M, Sethi V, Kearney H, Muhlert N, et al. Cervical cord area measurement using volumetric brain magnetic resonance imaging in multiple sclerosis. Mult Scler Relat Disord. 2015;4(1):52-7.
- Cadotte A, Cadotte DW, Livne M, Cohen-Adad J, Fleet D, Mikulis D, et al. Spinal Cord Segmentation by One Dimensional Normalized Template Matching: A Novel, Quantitative Technique to Analyze Advanced Magnetic Resonance Imaging Data. PLoS One. 2015;10(10):e0139323.
- El Mendili MM, Chen R, Tiret B, Pelegrini-Issac M, Cohen-Adad J, Lehericy S, et al. Validation of a semiautomated spinal cord segmentation method. J Magn Reson Imaging. 2015;41(2):454-9.
- Kearney H, Yiannakas MC, Abdel-Aziz K, Wheeler-Kingshott CA, Altmann DR, Ciccarelli O, et al. Improved MRI quantification of spinal cord atrophy in multiple sclerosis. J Magn Reson Imaging. 2014;39(3):617-23.
- De Leener B, Kadoury S, Cohen-Adad J. Robust, accurate and fast automatic segmentation of the spinal cord. Neuroimage. 2014;98:528-36.
- De Leener B, Levy S, Dupont SM, Fonov VS, Stikov N, Louis Collins D, et al. SCT: Spinal Cord Toolbox, an open-source software for processing spinal cord MRI data. Neuroimage. 2017;145(Pt A):24-43.
- Yushkevich PA, Piven J, Hazlett HC, Smith RG, Ho S, Gee JC, et al. User-guided 3D active contour segmentation of anatomical structures: significantly improved efficiency and reliability. Neuroimage. 2006;31(3):1116-28.
- Lukas C, Hahn HK, Bellenberg B, Rexilius J, Schmid G, Schimrigk SK, et al. Sensitivity and reproducibility of a new fast 3D segmentation technique for clinical MR-based brain volumetry in multiple sclerosis. Neuroradiology. 2004;46(11):906-15.
Figures

Table 1. MR acquisition
information from dataset A and dataset B.
Abbreviations: FSPGR = fast spoiled gradient echo; FFE = fast field echo;
TR = repetition time; TE = echo time; TI = inversion time.

Figure
1. Box-and-whisker plot (min-to-max, line at mean) showing
MUCCA (mm2) from all subjects (i.e. 21 RRMS and 6 HC grouped) per
vendor (GE [left], Philips [middle], Toshiba [right]), per segmentation method
(SCT-PropSeg [red], SCT-DeepSeg [yellow], ITK-SNAP [green]. NeuroQLab [blue],
Xinapse JIM [pink]), and per session (scan [clear], rescan [striped]). Large
differences can be seen between segmentation methods and between vendors, but
not between sessions (scan-rescan).
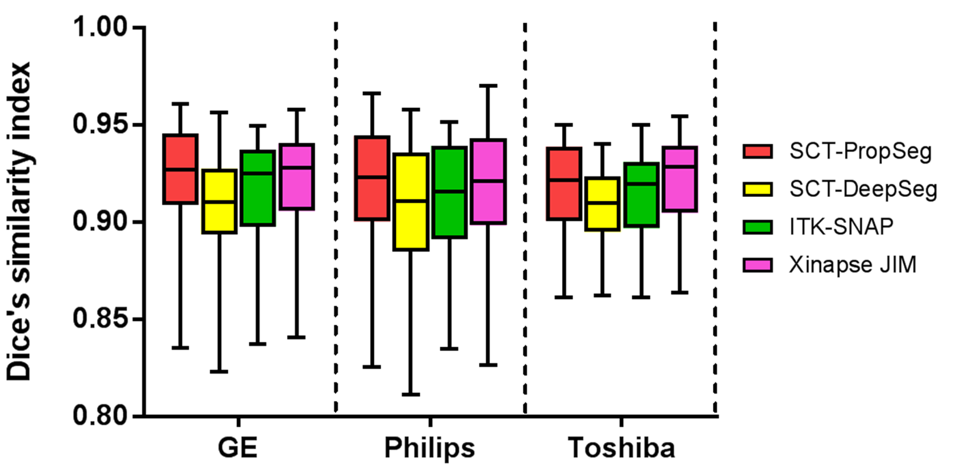
Figure 2. Box-and-whisker
plot (min-to-max, line at mean) showing Dice’s similarity index between the
scan and rescan images from all subjects (i.e. 21 RRMS and 6 HC grouped) per
vendor (GE [left], Philips [middle], Toshiba [right]) per segmentation method
(SCT-PropSeg [red], SCT-DeepSeg [yellow], ITK-SNAP [green], Xinapse JIM
[pink]). Differences can be seen mainly between methods, but not between
vendors. Since NeuroQLab does not provide segmentation images as output, no SI
could be calculated.

Figure
3. Box-and-whisker plot (min-to-max, line at mean) showing
MUCCA (mm2) in 14 MS subjects with many cervical lesions (clear) and
7 MS subjects without cervical lesions (striped) per segmentation method
(Manual [orange], SCT-PropSeg [red], SCT-DeepSeg [yellow], ITK-SNAP [green].
NeuroQLab [blue], Xinapse JIM [pink]). Large differences can be seen between
segmentation methods, but not between lesion groups.

Figure
4. Box-and-whisker plot (min-to-max, line at mean) showing
Dice’s similarity index between manual and (semi-)automatic upper cervical cord
segmentation (SCT-PropSeg [red], SCT-DeepSeg [yellow], ITK-SNAP [green],
Xinapse JIM [pink]) in 14 MS subjects with many cervical lesions (clear) and 7
MS subjects without cervical lesions (striped). Differences between
segmentation methods are visible, but not between lesions group. Since
NeuroQLab does not provide segmentation images as output, no SI could be
calculated.