4823
Post Processing Software for Echo Planar Imaging Phase Contrast Sequence1University of Picardie Jules Verne, CHIMERE EA 7516, Amiens, France, 2CHU-Amiens, Department of Medical Image Processing, Amiens, France, 3CHU-Amiens, MRI Research GIE-FF, Amiens, France
Synopsis
The new sequence Echo Planar Imaging Phase Contrast (EPI-PC) allows real-time imaging of blood flow and can be used to study the effect of breathing unlike to the normal Phase Contrast Magnetic Resonance Imaging sequence (Nor-PC). However, there is no software for the processing of EPI-PC data. We developed new software to visualize, segment and analyze EPI-PC data. We implemented in the software functions as filtering, denoising, segmentation, reconstruction, and extraction that can be applied on EPI-PC signal. This software was easy to use and gave promising results for the quantification of blood flow and the study of breathing effect.
INTRODUCTION
Phase Contrast Magnetic Resonance Imaging (Nor-PC) is a main non-invasive technique for quantifying blood and cerebrospinal fluid flows during the Cardiac Cycle (CC). However, Nor-PC is limited by its temporal resolution due to the combination of signal from many CC to create cine-phase sampling of one time-averaged CC. Nevertheless, the relative effects of CC variation and also the impact of breathing on cerebral flows cannot be studied with Nor-PC [1,2] since it has been demonstrated that breathing impacts cerebral flows [3,4]. Echo Planar Imaging PC-MRI (EPI-PC) is a recent technique that has an ultra-fast acquisition (Fe ≈10Hz) and is challenging Nor-PC [3]. Since there is no software dedicated to the processing of this new sequence, the purpose of this study was to develop a new software to visualize, segment and analyze the EPI-PC images.METHODS
Algorithms:
The software is devolved by Interactive Data Language (IDL). The main objective of this software is to reconstruct a mean curve flow during a cardiac cycle from a continuous flow signal acquired by EPI-PC. In order to obtain the reconstructed curve of CC, the principal steps are:
- Import the DICOM files to put the images in the matrix memory with the main parameters (spatial and temporal resolution)
- Segment region of interest (ROI) then the software can extract the parameter of the ROI such as areas, flows, velocity.
- Visualize the flow signal of the ROI. The signals can be scaled, moved, stored and contrasted
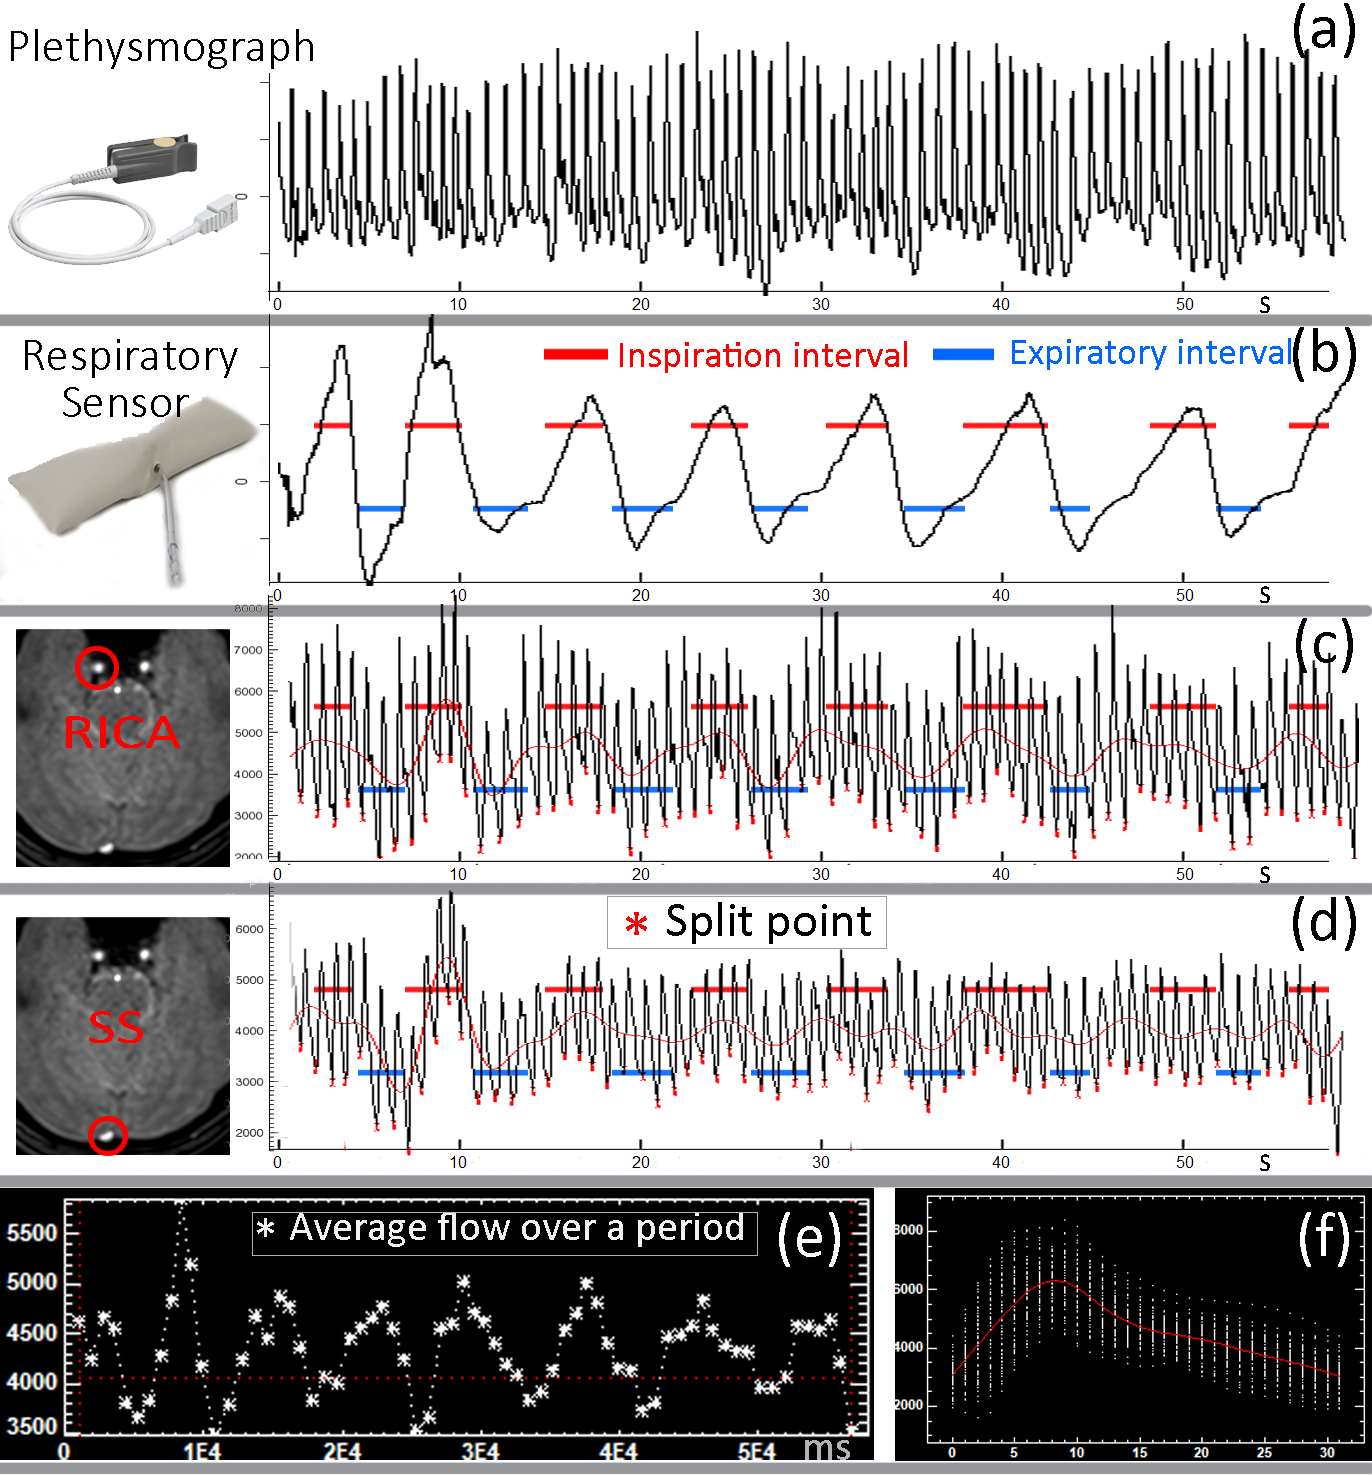
- Physiological signal comparison. Respiratory and cardiac signals recorded can be added in the window (figure.3 (a, b)).
- Filtering function is based on Fast Fourier Transform (FFT). Frequencies spectrum can be cleaned to keep only cardiac and respiratory frequencies
- Cut every cardiac cycle. The software can automatically analyze the parameters of the signals of the ROI to find the split point (red points in figure.3 (c, d)). After that, we can obtain every single CC and identify them whether they belong to the inspiration or expiration period.
- Reconstruction. The software can reconstruct an average blood flow in each CC (figure.3 (e)) by using all CC or by using the CC only in inspiration or expiration periods (the red and blue line segment in figure.3).
- Save the 3 reconstructed flow curves in each CC (average flow curve, inspiration flow curve, expiration flow curve), and export them to excel or txt file.
Applications:
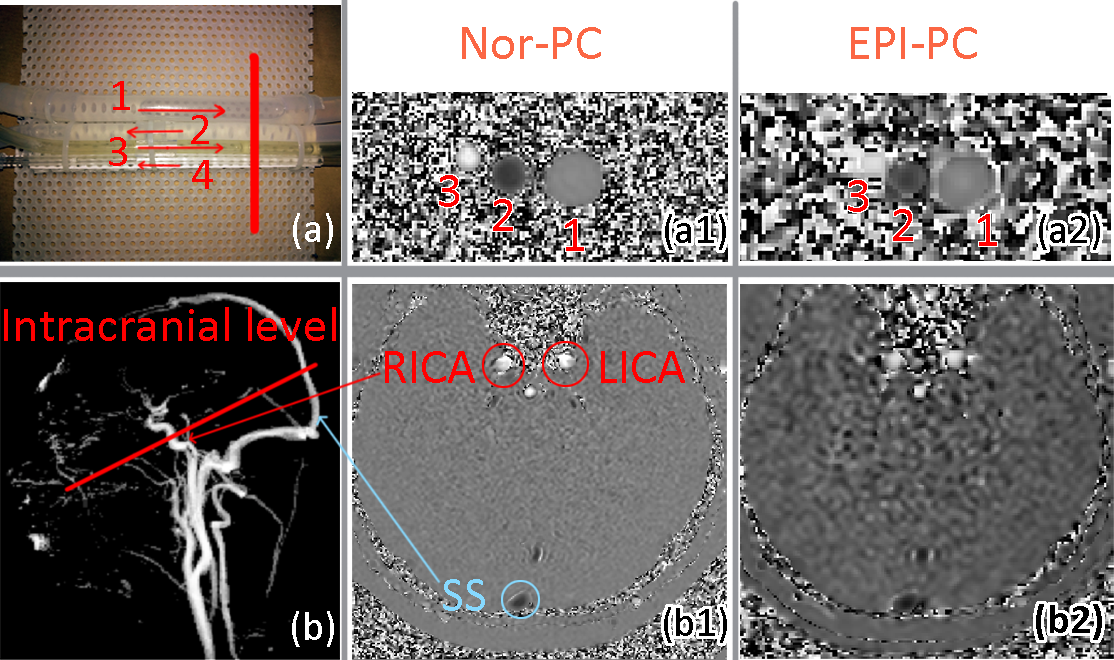
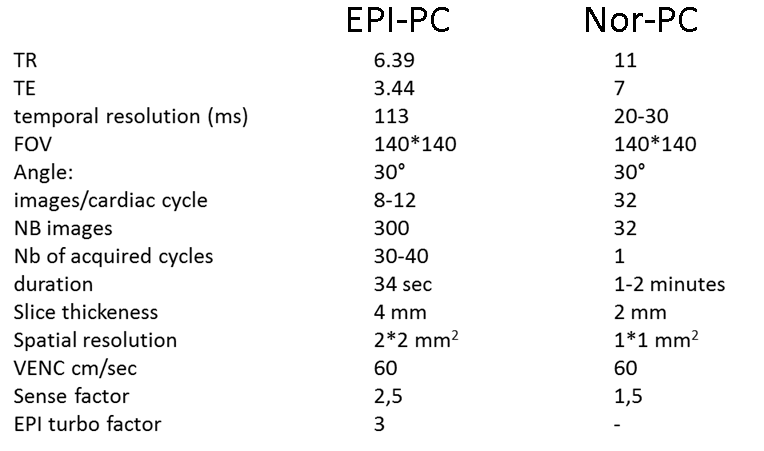
An in vitro and in vivo example of our post processing is presented. In vitro experiment consists in the generation of pulsatile flow in the different tubes of the phantom. For in vivo experiment performed in one volunteer, flows in right internal carotid artery (RICA) and sagittal sinus (SS) were assessed. To obtain Nor-PC (figure.1(a1) & (b1)) and EPI-PC (figure.1 (a2) & (b2)) images, with a 32 channel coil at 3T. The parameters of sequences were summarized in figure 2. Flows in tube 2 and 3 of the phantom and also in RICA and SS Right were analyzed with the new software.
RESULTS
Figure 3 shows the different signals acquired after using of the different functions on the EPI-PC images.
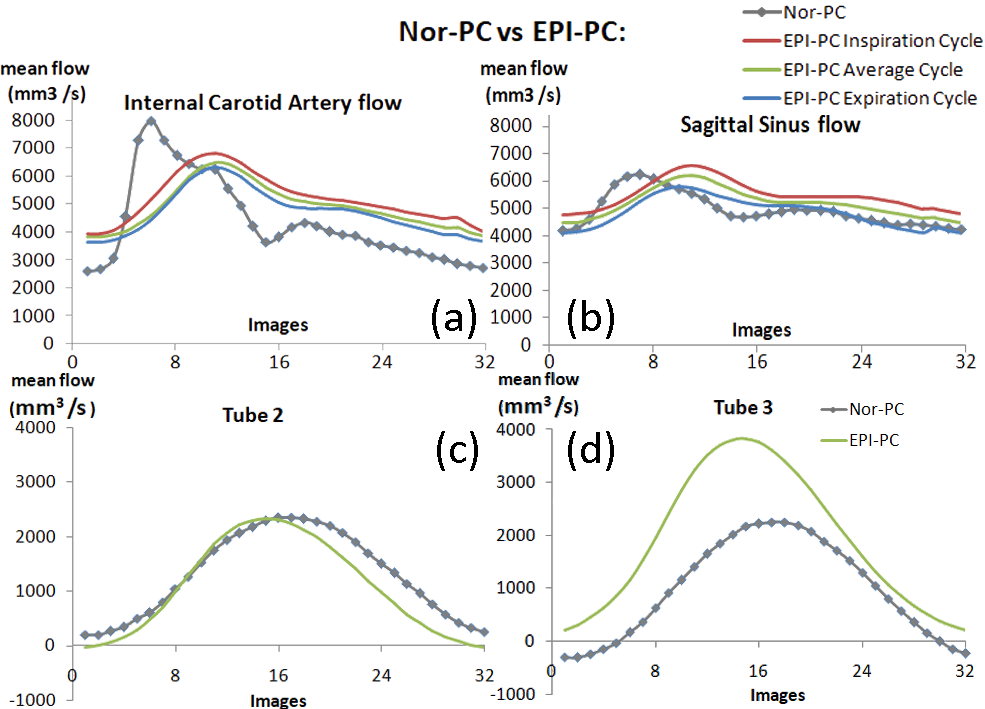
Figures 4c and 4d show a similar shape between Nor-PC and EPI-PC flow curves for the two analyzed tubes.
Figures 4a and 4b show average, expiration and inspiration of EPI-PC flow curves plotted against Nor-PC flow. We found that inspiration increases flow and expiration decreases flow both in right internal carotid artery and sagittal sinus. In the volunteer, we found fewer details in the shape of EPI-PC flow curve compared to Nor-PC flow curve both in Right Internal Carotid Artery (figure.4 (a)) and sagittal sinus (figure.4 (b)). Moreover, this notification is more pronounced in RICA than in sagittal sinus.
DISCUSSION
This new software has reached our expectations. It highlights the strong point of EPI-PC sequence by analyzing blood flow in real time and by assessing the effect of breathing. Because Nor-PC can reconstruct 32 points for one CC with 2 minutes, this could be explained why there are more details in the flow curves compared to EPI-PC flow curves in which only approximately 8 sample points were obtained in each CC (figure.4).CONCLUSION
The functions of this new software run correctly. It is easy to use. The interface is intuitive and ergonomic. With its good scalability, it is easy to upgrade for different needs. It gives the ability to quantify the effect of breathing. The new software combined with EPI-PC brings a new perspective on the cranial spinal dynamics which is the source of much pathology such as hydrocephalic and idiopathic intracranial hypertension.Acknowledgements
No acknowledgement found.References
1. Balédent, O., Henry-Feugeas, M. C. & Idy-Peretti, I. Cerebrospinal fluid dynamics and relation with blood flow: a magnetic resonance study with semiautomated cerebrospinal fluid segmentation. Invest Radiol 36, 368–377 (2001).
2. Alperin, N. & Lee, S. H. PUBS: pulsatility-based segmentation of lumens conducting non-steady flow. Magn Reson Med 49, 934–944 (2003).
3. Chen, L., Beckett, A., Verma, A. & Feinberg, D. A. Dynamics of respiratory and cardiac CSF motion revealed with real-time simultaneous multi-slice EPI velocity phase contrast imaging. Neuroimage 122, 281–287 (2015).
4. Schroth, G. & Klose, U. Cerebrospinal fluid flow. II. Physiology of respiration-related pulsations. Neuroradiology 35, 10–15 (1992).
Figures