4820
BrainQuan: An integrated tool for automated and region-specific analysis of multi-parametric brain MRI data1MR Scientific Marketing, Siemens Healthcare., Beijing, China, 2MR Scientific Marketing, Siemens Healthcare., Shanghai, China, 3Shanghai Key Laboratory of Magnetic Resonance, East China Normal University, Shanghai, China
Synopsis
This abstract presents an integrated tool, namely BrainQuan, developed in Python to automatically segment the brain MRI into sub-regions, align the multi-parametric MRI data into the same space, and then extract the region-specific information from quantitative MRI data, such as quantitative susceptibility maps and diffusion parameters in these brain sub-regions. This tool provides an easy and comprehensive solution for several pilot studies spanning a range of applications: infant brain, brain morphology analysis and neuro-degenerative diseases. BrainQuan might be helpful to establish potential biomarkers from many different quantitative brain MRI data.
Introduction
During the last decades, there have been consistent interest and demanding efforts in developing multiple software tools to investigate one of the most sophisticated human organs, the brain. Meanwhile, the development of quantitative MRI techniques, such as T1/T2 mapping, quantitative susceptibility mapping (QSM), different advanced diffusion models, arterial spin labeling (ASL), etc., provides different and valuable biophysical information to reflect brain microstructure. This raises an urgent need to develop an easy-to-use and automated tool to perform multi-parameter analysis and provide quantitative information for individual subjects in structural level. Here we developed a small integrated tool, namely BrainQuan, by combining different well-established software packages to automatically segment brain MRI, align multi-parametric MRI data into the same image space, and extract quantitative information in the segmented brain structures, which ultimately converts MR images into quantitative indices for clinical evaluation.Methods
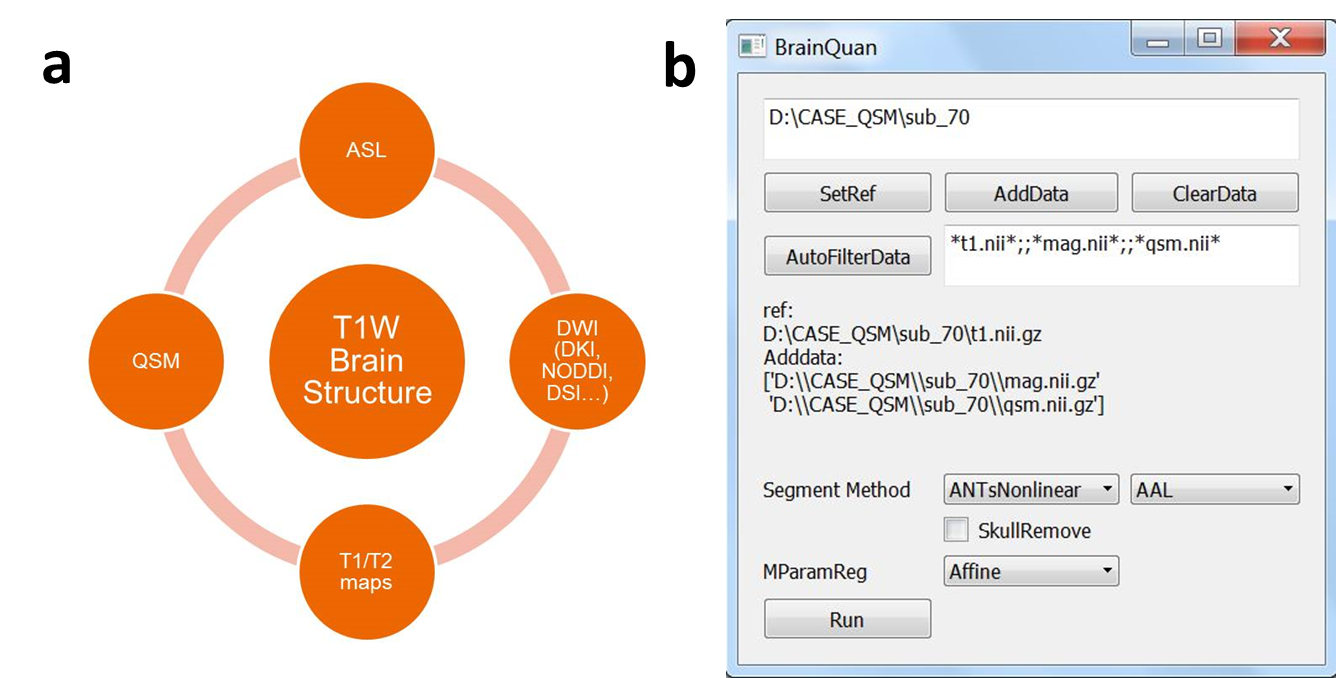
The BrainQuan tool is developed in Python 3.61, making use of many well-established neuroimaging software libraries or tools, including ROBEX2 for skull stripping, ANTs3 and DIPY4 for image registration, together with different brain atlases, such as AAL5 and BNAtals2466. An automated processing pipeline was proposed aiming to automatically segment brain MR images and then extract the quantitative multi-parametric MRI data in each segmented brain structures. In detail, first, a whole-brain T1-weighted (T1w) image, usually acquired by MPRAGE, will be chosen as anatomical reference for individual subject. A selected brain template will be nonlinearly registered to the T1w image space, and the resulting transformation matrix and deformation field will be used to warp the brain region labels from atlas space into T1w space with nearest-neighbor interpolation. Then, multi-parametric quantitative MRI data, for example QSM, will be transformed into T1w space, using affine transformation or direct resampling with imaging center translation. For affine transformation, another reference image with fine structure information will be additionally chosen, such as the GRE magnitude image in QSM. Now the quantitative data analysis can be implemented in T1w space, and a list of statistical indices of all quantitative data in each segmented brain region will be generated. Figure 1b shows the user interface of BrainQuan. For the user interaction, the reference data and each quantitative data can be selected either manually one by one or automatically using keywords. After selecting the data and configuring other processing options, the whole process will be started automatically with one click.Results
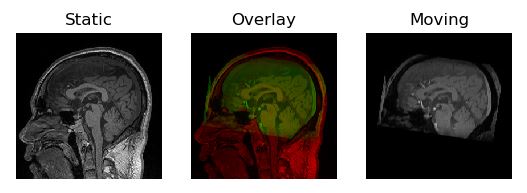
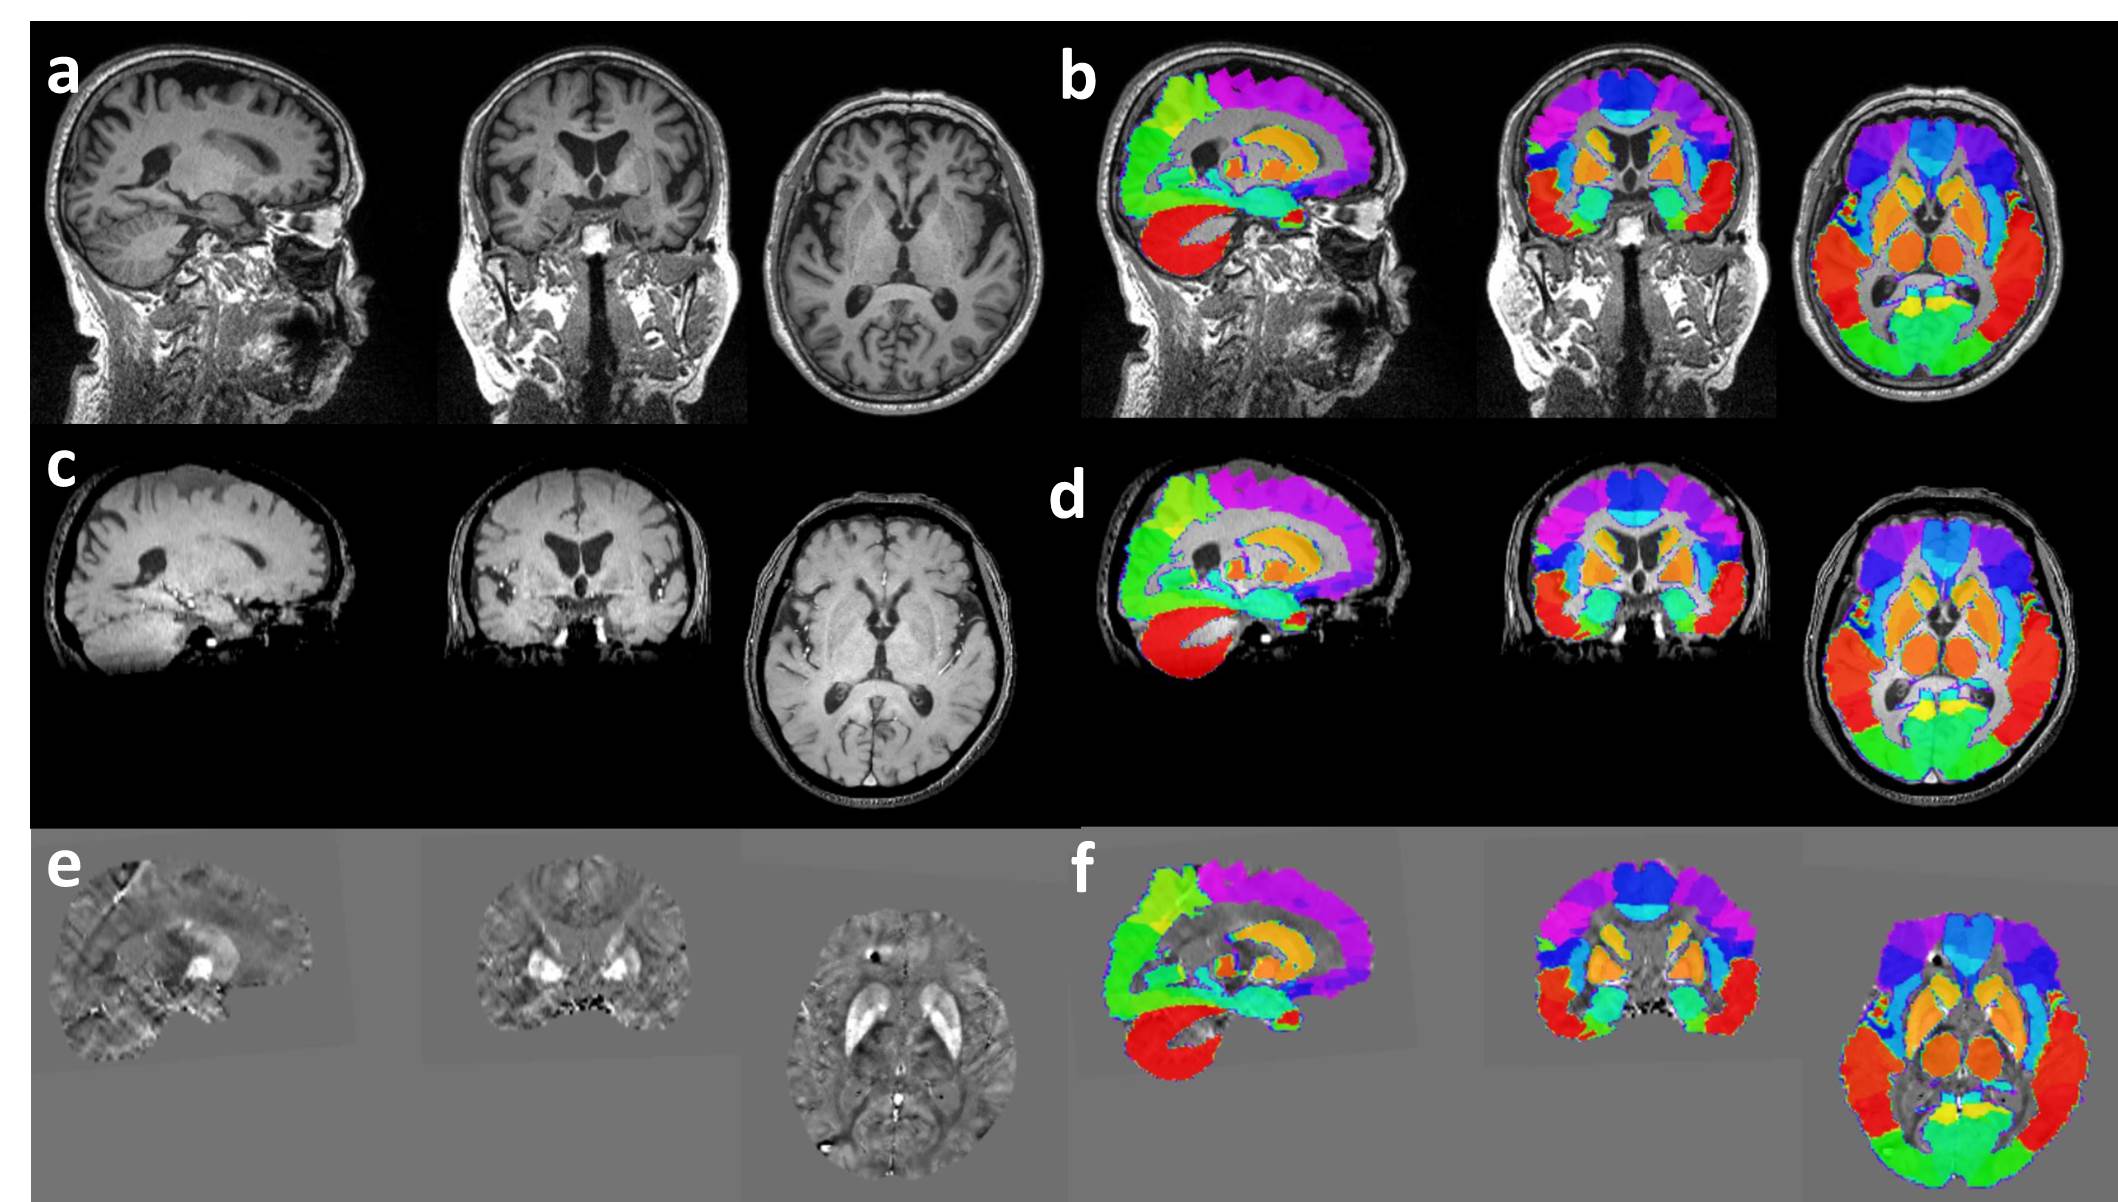
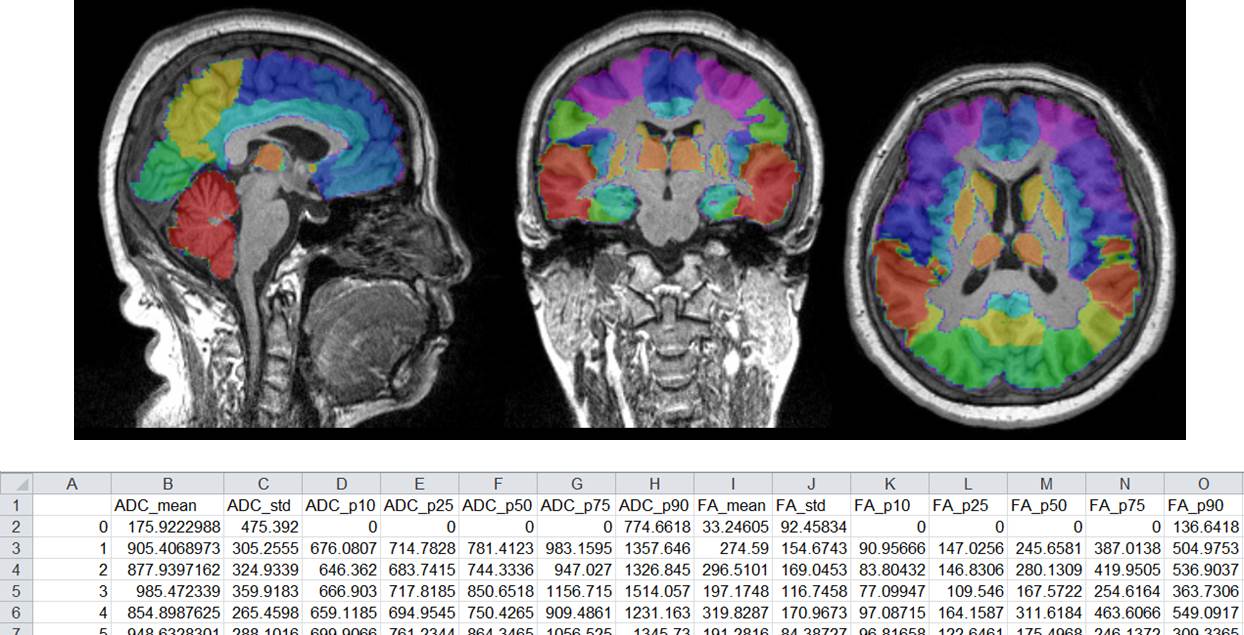
Figure 2 shows the intermediate registration results (transformed template overlaid on input T1w images) between the brain template and the T1w data. For visual inspection, the affine registration was sufficient to guarantee the accurate alignment between the template and individual T1w images, which gives assurances for further processing. Figure 3 shows an example of segmented results for T1w, GRE magnitude and QSM. The AAL atlas was applied and segmented regions were overlaid on all images. Figure 4 shows another segmented results and the corresponding descriptive analysis results of quantitative MRI data (here ADC and FA metrics from DWI acquisition as example), including the mean values, standard deviation, and different percentiles.Discussion
This abstract presents a processing pipeline developed to automatically segment the brain structures based on T1w images and then extract region-specific quantitative indices from multi-parametric brain MRI data. This pipeline has following benefits: 1) providing a flexible platform to use different atlases, depending on the experiment design, such as infant brain atlases7 for neonate study; 2) showing automatically generated intermediate registration results to allow quality check by the users; 3) generating descriptive information about the quantitative MRI measurements in different brain structures, which can be used in multi-parametric statistics or radiomics studies later. Ultimately, BrainQuan might be helpful for users to establish potential biomarkers from many different quantitative brain MRI data.Acknowledgements
None.References
1. https://www.python.org/
2. Iglesias JE, Liu CY, Thompson P, Tu Z. Robust Brain Extraction Across Datasets and Comparison with Publicly Available Methods. IEEE Trans Med Imaging, 2011, 30(9): 1617-1634.
3. Avants BB, Tustison NJ, Song G, et al. A reproducible evaluation of ANTs similarity metric performance in brain image registration. Neuroimage 2011; 54(3):2033-2044.
4. Garyfallidis E, Brett M, Amirbekian B, et al. DIPY, a library for the analysis of diffusion MRI data. Frontiers in Neuroinformatics, 2014, 8, no.8
5. Tzourio-Mazoyer N, Landeau B, Papathanassiou D, et al. Automated anatomical labeling of activations in SPM using a macroscopic anatomical parcellation of the MNI MRI single-subject brain. NeuroImage 2002,15: 273-289.
6. Fan L, Li H, Zhuo J, et al. The Human Brainnetome Atlas: A New Brain Atlas Based on Connectional Architecture. Cerebral Cortex, 2016, 26(8):3508-3526.
7. Shi F, Yap P-T, Wu G, et al. Infant Brain Atlases from Neonates to 1- and 2-Year-Olds. PLoS ONE 2011, 6(4): e18746.
Figures