4807
U-Net Segmentation for Human Body Models for SAR Simulations1General Electric, Niskayuna, NY, United States
Synopsis
RF power absorption during MRI, expressed in terms of specific absorption rate (SAR), is an important safety issue, especially in multi-channel transmit MRI. To reduce uncertainties of local SAR estimates due to subject antatomical variations, patient-specific human body models can be applied in EM simulations of the RF transmit coil. In this work, we trained a U-net neural network on simulated CT scans to quickly create HBMs with four primary tissue classes (bone, lungs, fat, and water-based). Local SAR results using HBMs created with the U-net showed good agreement with those from ground truth models.
Purpose
SAR safety simulations in MRI are often done using a limited number of commercially-available HBMs1. Each commercial HBM can have over 70 tissues, not all of which are critical for SAR prediction, making them time-consuming to generate. The capability to generate new HBMs from imaging data is highly beneficial as it allows SAR simulations to be performed over a variety of body types that is more representative of the population. Fast generation of patient-specific HBM may also enable more accurate local SAR estimation in multi-channel RF transmit MRI. This paper provides the groundwork for creating a HBM from images by using a U-net convolutional neural network (CNN) to generate a segmentation map for four tissue types that are important for SAR simulations.Methods
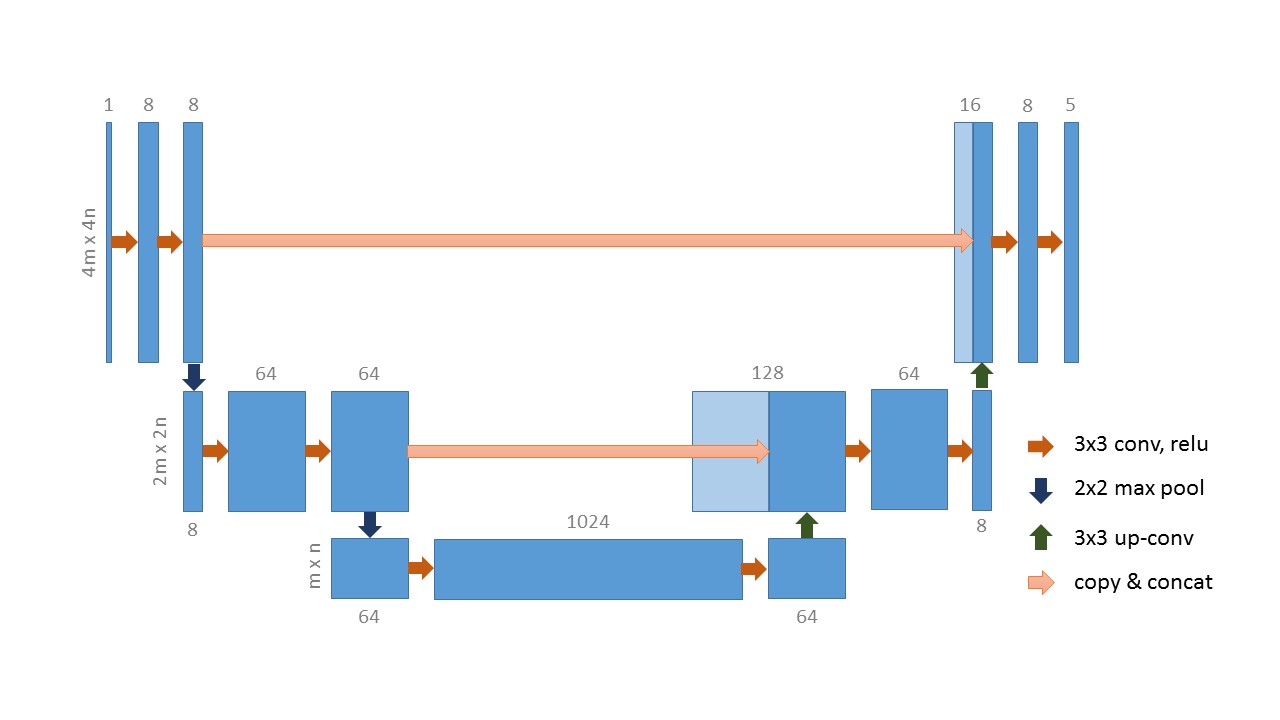
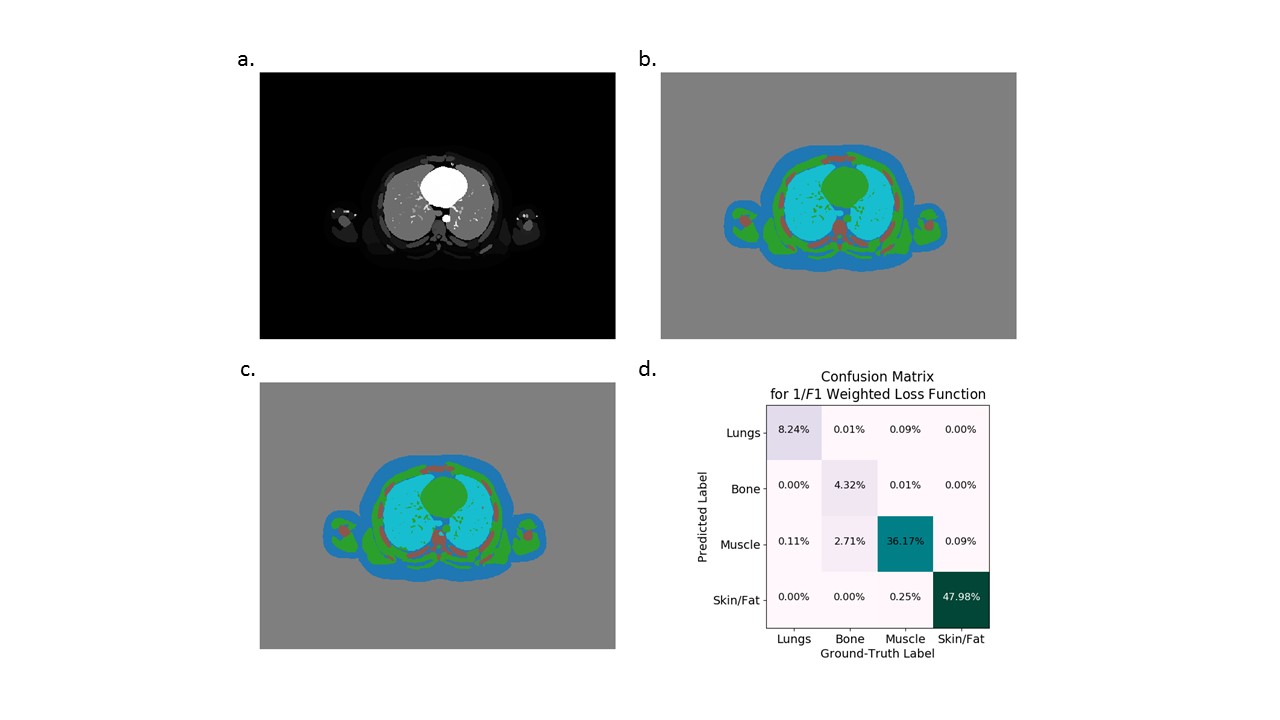
We trained a U-net neural network using simulated CT images created from a dataset of detailed, whole-body phantoms of the male and female anatomies generated from NURBS-based Cardiac-Torso (NCAT) phantoms2. Fifty-five whole-body simulated scans (33 male, 22 female) were generated3,4. The simulated images were processed to create a segmentation map with four tissue classes—bone, lungs, fat, and water-based tissue—chosen such that all tissues binned into each class share similar permittivity and electrical conductivity5 values. Fig. 1a shows a sample simulated CT image from one of the phantoms, and Fig. 1b shows the manually-labelled tissue class map for the same image. The network architecture shown in Fig. 2 was trained to predict segmentation maps that could be turned into new HBMs.
With a fully-trained network, we created HBMs from both the network-predicted segmentation maps as well as the manually-labelled tissue map representing the ground truth for the model. Full-wave electromagnetic (EM) simulations were performed with Sim4Life (ZMT, Zurich, Switzerland) to predict specific absorption rate (SAR) distributions on both. Computed SAR maps were used as input to a time-dependent Penne's bioheat equation (PBHE)6 for the HBMs created. A standard whole-body 16-rung high-pass birdcage RF coil was modeled with a maximum grid resolution of 2mm x 2mm x 2mm. The coil was tuned to 127.74 MHz and driven in quadrature mode for subsequent simulations. The ground-truth and network-predicted HBMs were each positioned inside the coil before two independent simulations were performed. Simulations were performed with the HBMs landmarked on their glabellas. Thermal simulations were run using 1000W continuous input power for 60 minutes and a Dirichlet boundary condition. The nominal literature values7 for tissue perfusion, metabolic heat terms, permittivity, and electrical conductivity were used for the tissue types in the HBMs.
Results
Figure 2c shows a predicted tissue class map using the network, while Fig. 2d shows the confusion matrix for the classes that are relevant to creating a HBM. The matrix is highly diagonal, with only 3.27% of voxels misclassified. As each class is defined by the electrical properties of the tissues in that class, the type of misclassification as well as the overall frequency of the misclassification impacts the final SAR simulations, especially for confusion between fat and water-based tissue.
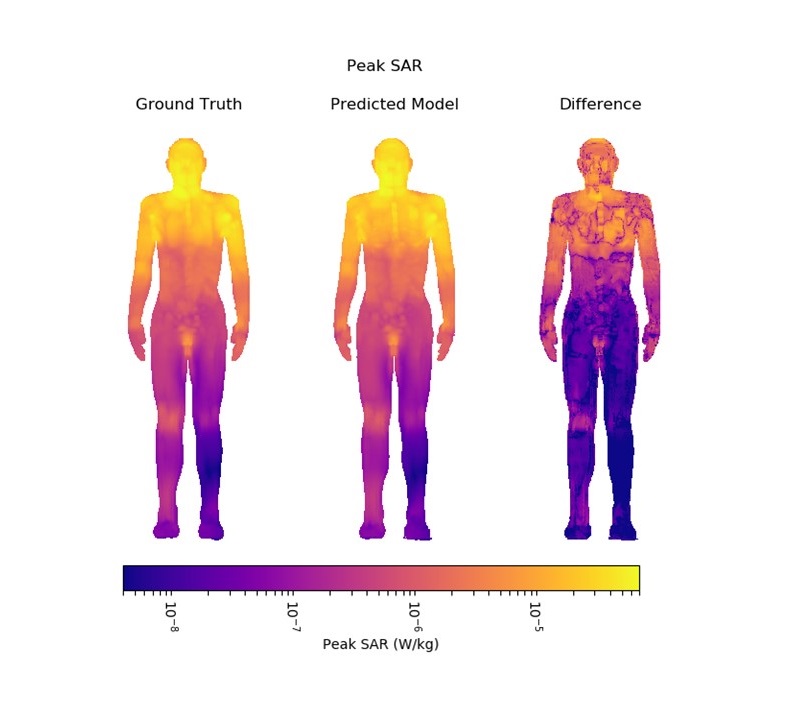
The SAR10g calculated for each axial slice along a test phantom is seen in Fig. 3 for one of the HBMs. The SAR10g in the network-predicted HBM (orange line) follows the same trends as the ground-truth HBM (blue line). Fig. 4 shows the peak SAR10g for each coronal pixel and Fig. 5 shows the result of a thermal simulation for the same phantom. The largest difference in the simulation results corresponds with the region that had the largest confusion between the muscle and water-based tissue classes.
The average SAR10g calculated in the 6 HBMs over the region inside the coil was 10.6+/-0.8uW/kg for the ground-truth HBMs, and 11.4+/-1.4uW/kg for the network-generated HBMs, an increase of 6.8% for the network-generated models. In each axial slice, the network-generated HBM predicted a peak SAR value approximately 9% higher than the corresponding slice in the ground-truth HBM. While the results suggest that the network-based prediction tends to overestimate SAR values, data from more HBMs will be needed to characterize the observation. Initial thermal simulations support these trends.
Conclusion
EM simulations were performed on HBMs created from manually-labeled tissue segmentation maps and network-generated segmentation maps to calculate local and average SAR in a standard whole-body MRI birdcage coil. The simulations of the network-predicted HBMs are in reasonable agreement with those of the ground-truth HBMs. The regions with the highest confusion between the muscle and fat classes correspond with the largest differences between the two simulations.Acknowledgements
No acknowledgement found.References
1. Andreas Christ, Wolfgang Kainz, Eckhart G Hahn, Katharina Honegger, Marcel Zefferer, Esra Neufeld, Wolfgang Rascher, Rolf Janka, Werner Bautz, Ji Chen, et al. The virtual family | development of surface-based anatomical models of two adults and two children for dosimetric simulations. Physics in Medicine & Biology, 55(2):N23, 2009.
2. W Paul Segars and Benjamin MW Tsui. MCAT to XCAT: The Evolution of 4-D Computerized Phantoms for Imaging Research: Computer models that take account of body movements promise to provide evaluation and improvement of medical imaging devices and technology. Proceedings of the IEEE. Institute of Electrical and Electronics Engineers, 97(12):1954, 2009.
3. W Paul Segars, Gregory M Sturgeon, Daniel J Ward, J Tilak Ratnanather, Michael I Miller, and BMW Tsui. The new xcat series of digital phantoms for multi-modality imaging. In Nuclear Science Symposium Conference Record (NSS/MIC), 2010 IEEE, pages 2392-2395. IEEE, 2010.
4. WP Segars, Hannah Norris, Gregory M Sturgeon, Yakun Zhang, Jason Bond, Anum Minhas, Daniel J Tward, JT Ratnanather, MI Miller, D Frush, et al. The development of a population of 4d pediatric xcat phantoms for imaging research and optimization. Medical physics, 42(8):4719-4726, 2015.
5. D. Andreuccetti, R. Fossi, and C. Petrucci. An Internet resource for the calculation of the dielectric properties of body tissues in the frequency range 10 Hz - 100 GHz. http://niremf.ifac.cnr.it/tissprop/, Florence (Italy), 1997. [Online]. Based on data published by C.Gabriel et al. in 1996.
6. Harry H Pennes. Analysis of tissue and arterial blood temperatures in the resting human forearm. Journal of applied physiology, 1(2):93{122, 1948. Sami Gabriel, RW Lau, and Camelia Gabriel. The dielectric properties of biological tissues: III. Parametric models for the dielectric spectrum of tissues. Physics in Medicine & Biology, 41(11):2271, 1996.
Figures