4806
Can Intensity Augmentation Improve Generalizability of CNN-based Image Segmentation?1Medical Physics Group, Institute for Diagnostic and Interventional Radiology, Jena University Hospital, Jena, Germany, 2Department of Neurology, Essen University Hospital, University of Duisburg-Essen, Essen, Germany, 3Department of Diagnostic and Interventional Radiology and Neuroradiology, University of Duisburg-Essen, Essen, Germany, 4Michael-Stifel-Center-Jena for Data-Driven and Simulation Science, Friedrich-Schiller University Jena, Jena, Germany
Synopsis
As a strategy to achieve higher generalizability of a convolutional neural network (CNN), data augmentation may be used to introduce a higher degree of variability within the training sample. In this study, five different intensity augmentation strategies were compared and analyzed by means of the CNN segmentation performance. The results indicate how intensity augmentation improves the robustness, and thereby the generalizability, of the CNN but in some cases also compromise the segmentation performance in terms of accuracy.
Introduction
Convolutional Neural Networks (CNN) has recently become a popular tool for medical image segmentation as the method has proven to be superior in performance and speed in comparison with classical statistical- and atlas-based machine learning techniques1,2. The community is, however, challenged by limited generalizability and robustness of the trained networks, especially when handling MR data, as scanner and sequence configurations introduce a wide spectrum of variability to the data. In order to achieve a generalizable network, the variability of all possible evaluation datasets should be contained within the training datasets. With a limited range of data, current methods to achieve equalization of the variability within the training and evaluation data are intensity normalization3 and data augmentation1,2. However, the exact influence of the latter method on the network performance has not yet been described. The aim of this work is to evaluate the influence of intensity augmentation on the performance of a CNN for segmenting the cerebellum on MR images.Methods
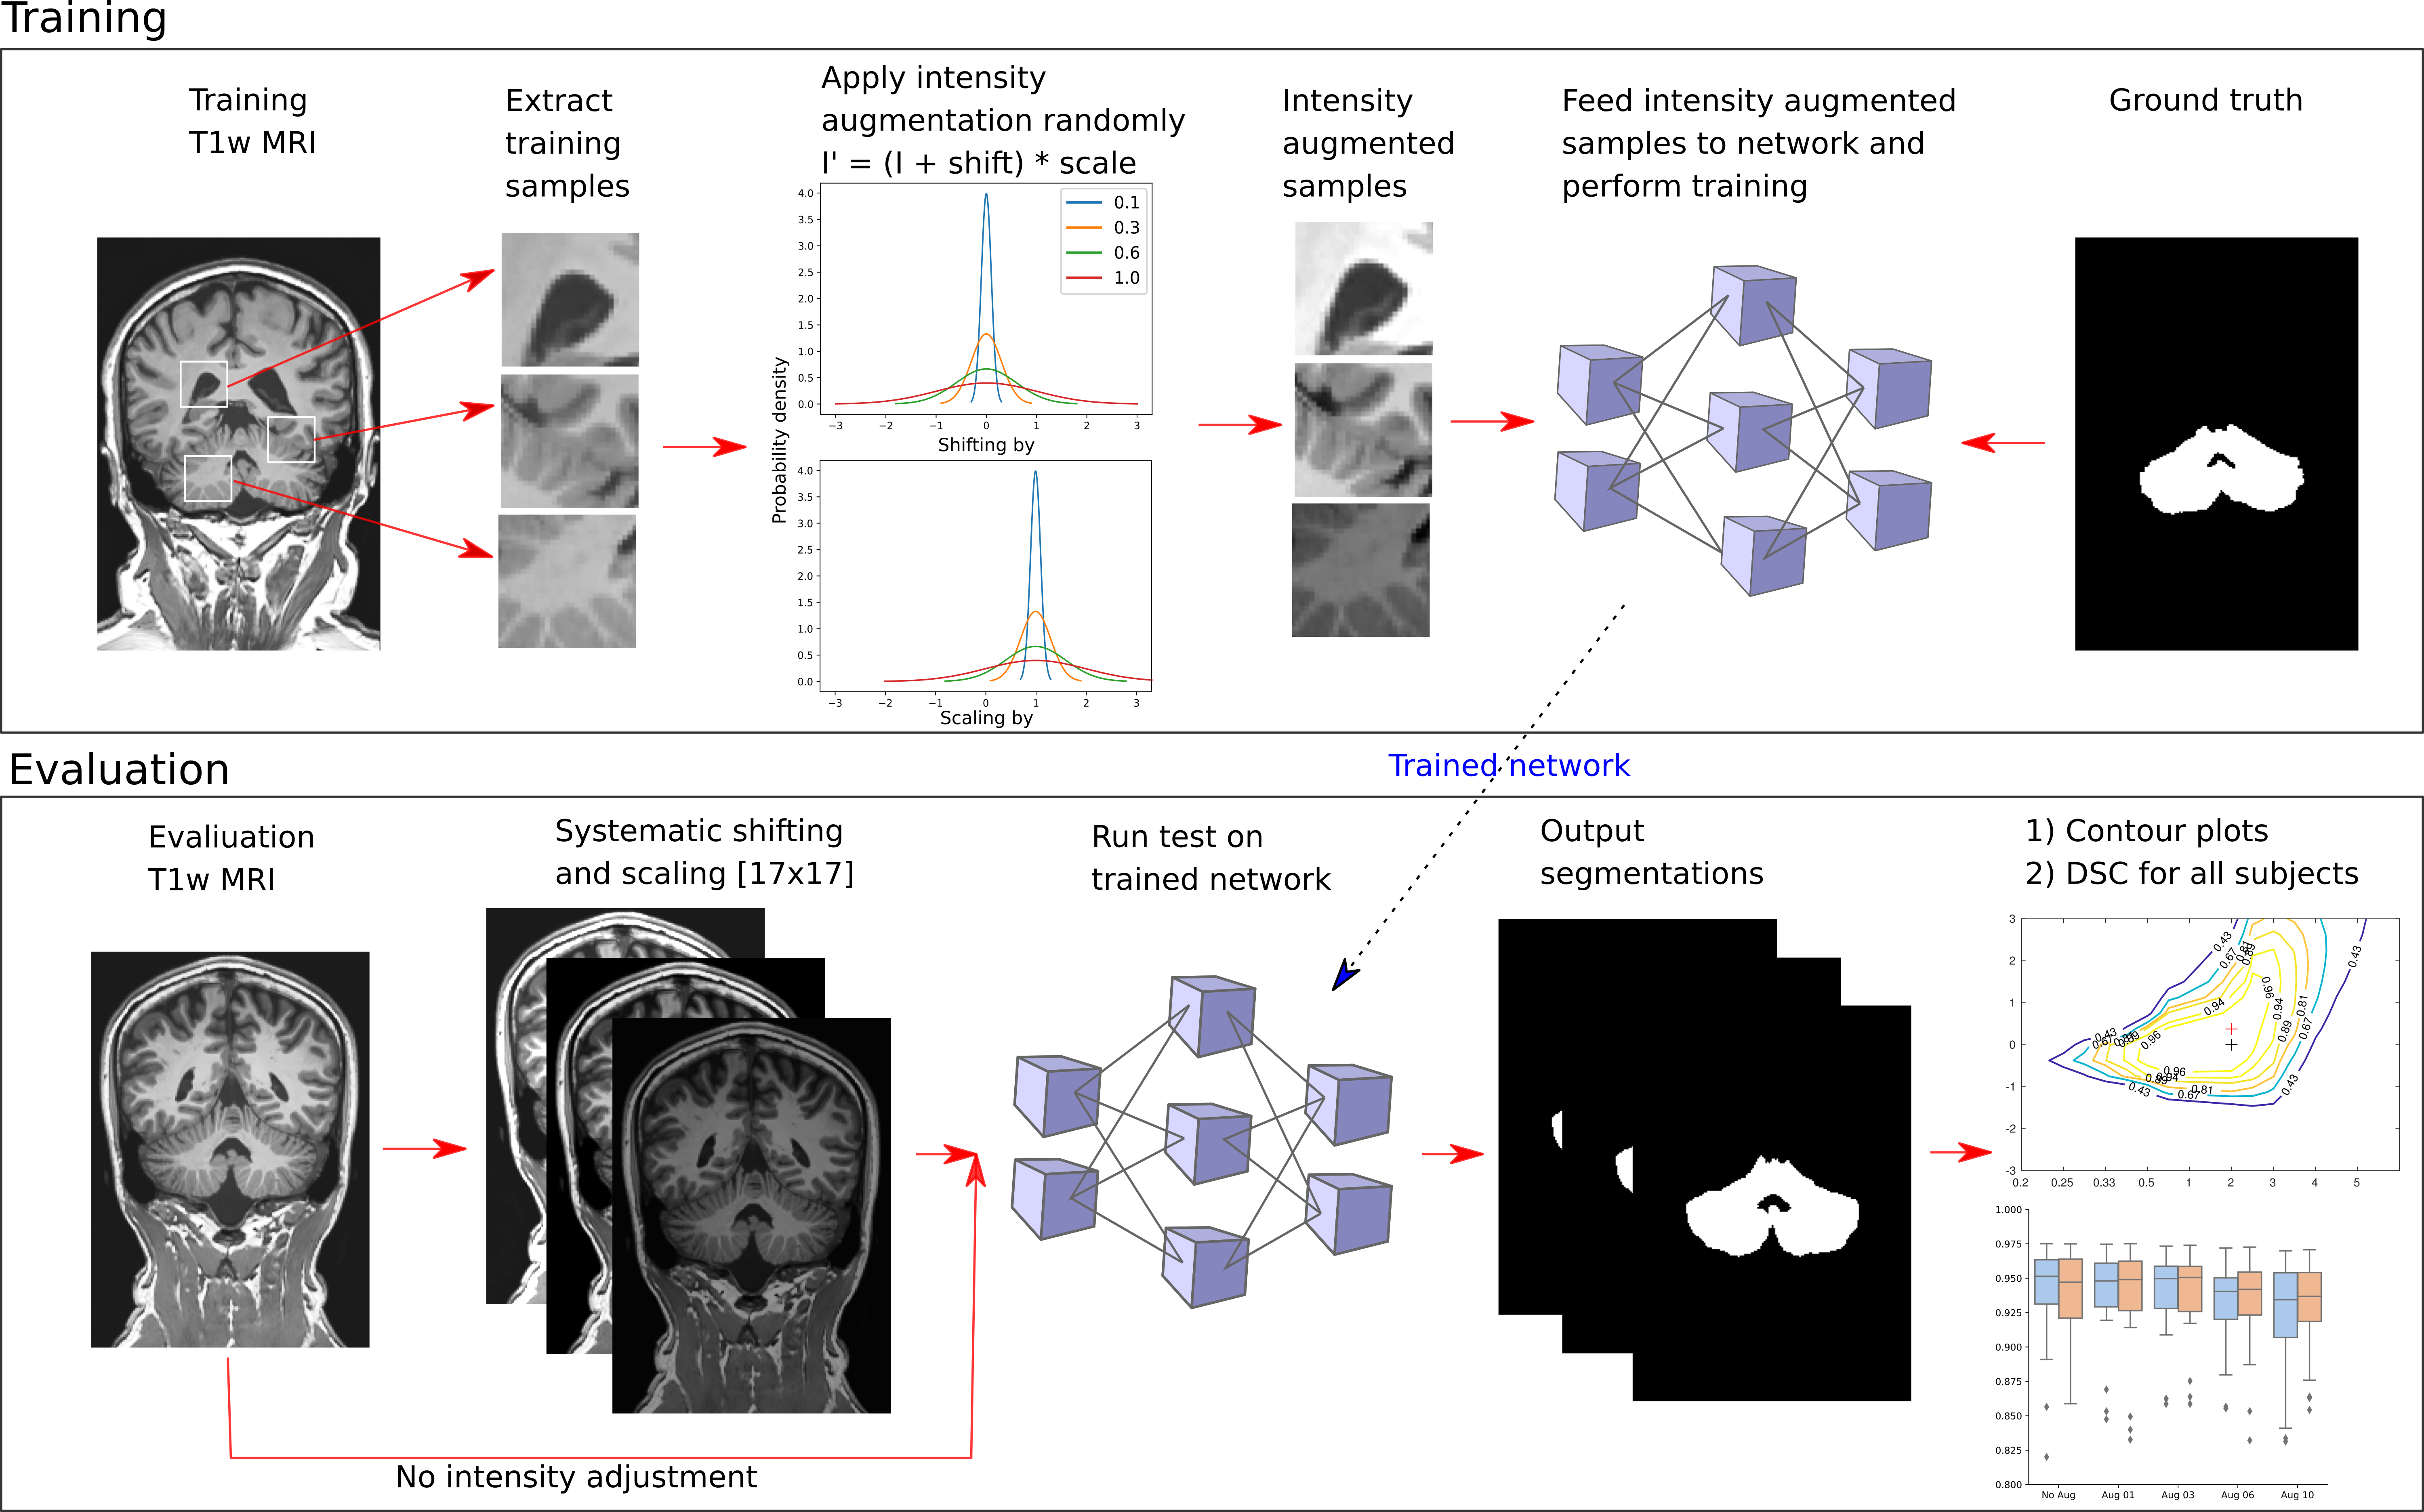
This study included three population samples with a total number of 218 datasets, all including a T1w MRI dataset acquired at 3T and a ground truth segmentation delineating the cerebellum. The first sample was collected at the Essen University Hospital (N=180) [EUH], the second sample (N=20) was released as part of the ENIGMA MICCAI cerebellum challenge 2017 [EMCC], and the third population (N=18) sample was obtained from the Internet Brain Segmentation Repository [IBSR]. Both the EUH and EMCC sample included patients. 150 healthy controls from the EUH sample were used as training data whilst the remaining were used as evaluation data. All datasets were intensity normalized using the decile method4. In order to analyze the influence of intensity augmentation, we trained a 12 layered 3D CNN5 10 times, changing the probability distribution of the intensity augmentation, simulating different intensity distributions, and the sample size. The sample size was changed to evaluate the influence of training data amount and was set to 3000 or 6000 samples per training subepoch, each with a size of 253 voxels. The intensity augmentation was applied as random shifting and scaling during the sampling process according to: I' = (I + shift) * scale, where values for shift and scale originated from a Gaussian distribution with [mean, standard deviation] equal to (Aug 01: [0,0.1][1,0.1]; Aug 03: [0,0.3][1,0.3], Aug 06: [0,0.6][1,0.6], and Aug 10: [0,1.0][1,1.0]), respectively. The CNNs were each trained for 20 subepochs in 30 epochs. The influence of intensity augmentation was evaluated by comparing the CNNs’ segmentation performance, assessed via the Sørensen Dice Similarity coefficient (DSC). Moreover, an intensity sensitivity analysis of the CNNs was carried out by systematically shifting and scaling each T1w MRI between [-3,3] and [0.22,5], respectively, and feeding all intensity adjusted datasets to the CNNs, resulting in 17x17 matrices containing the segmentation performance (DSC) for all configurations. Figure 1 contains an illustration of the study’s method.Results
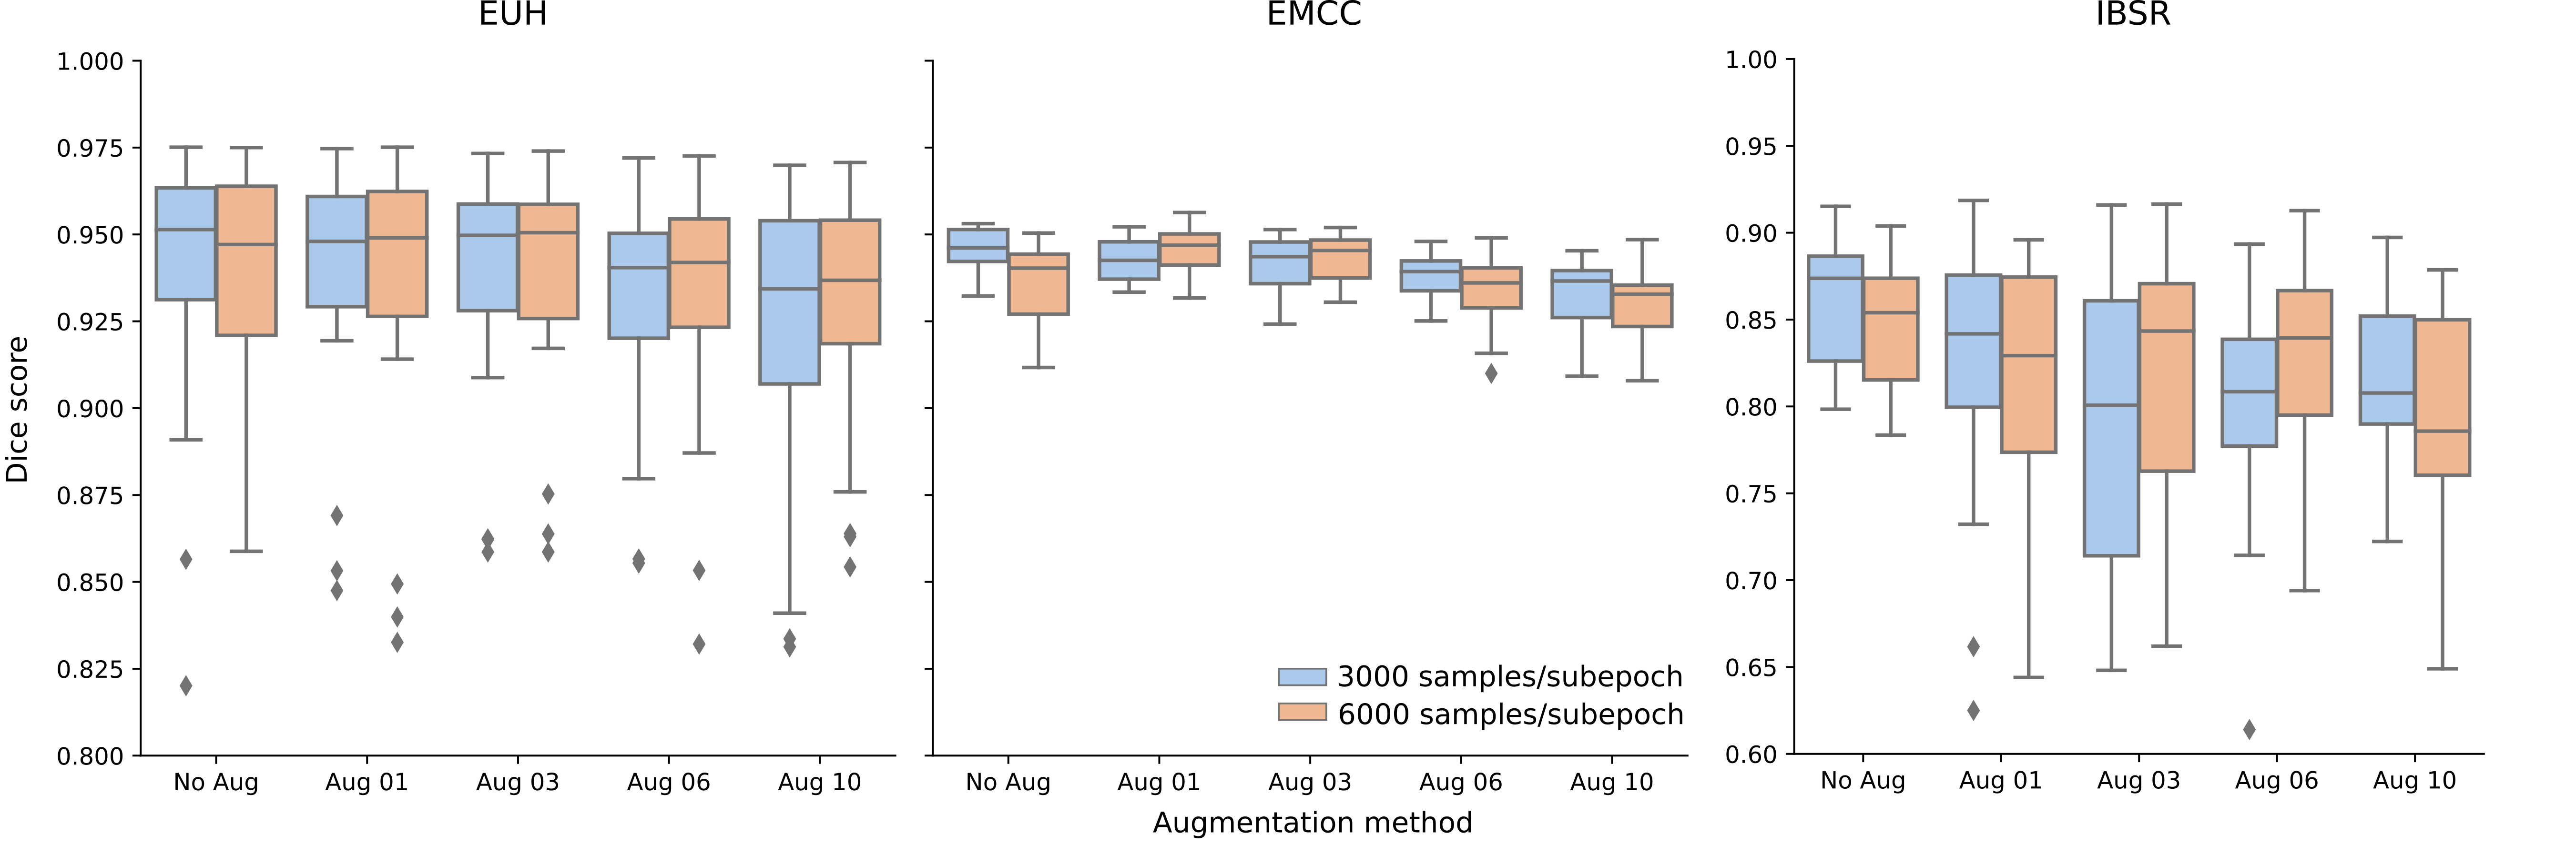
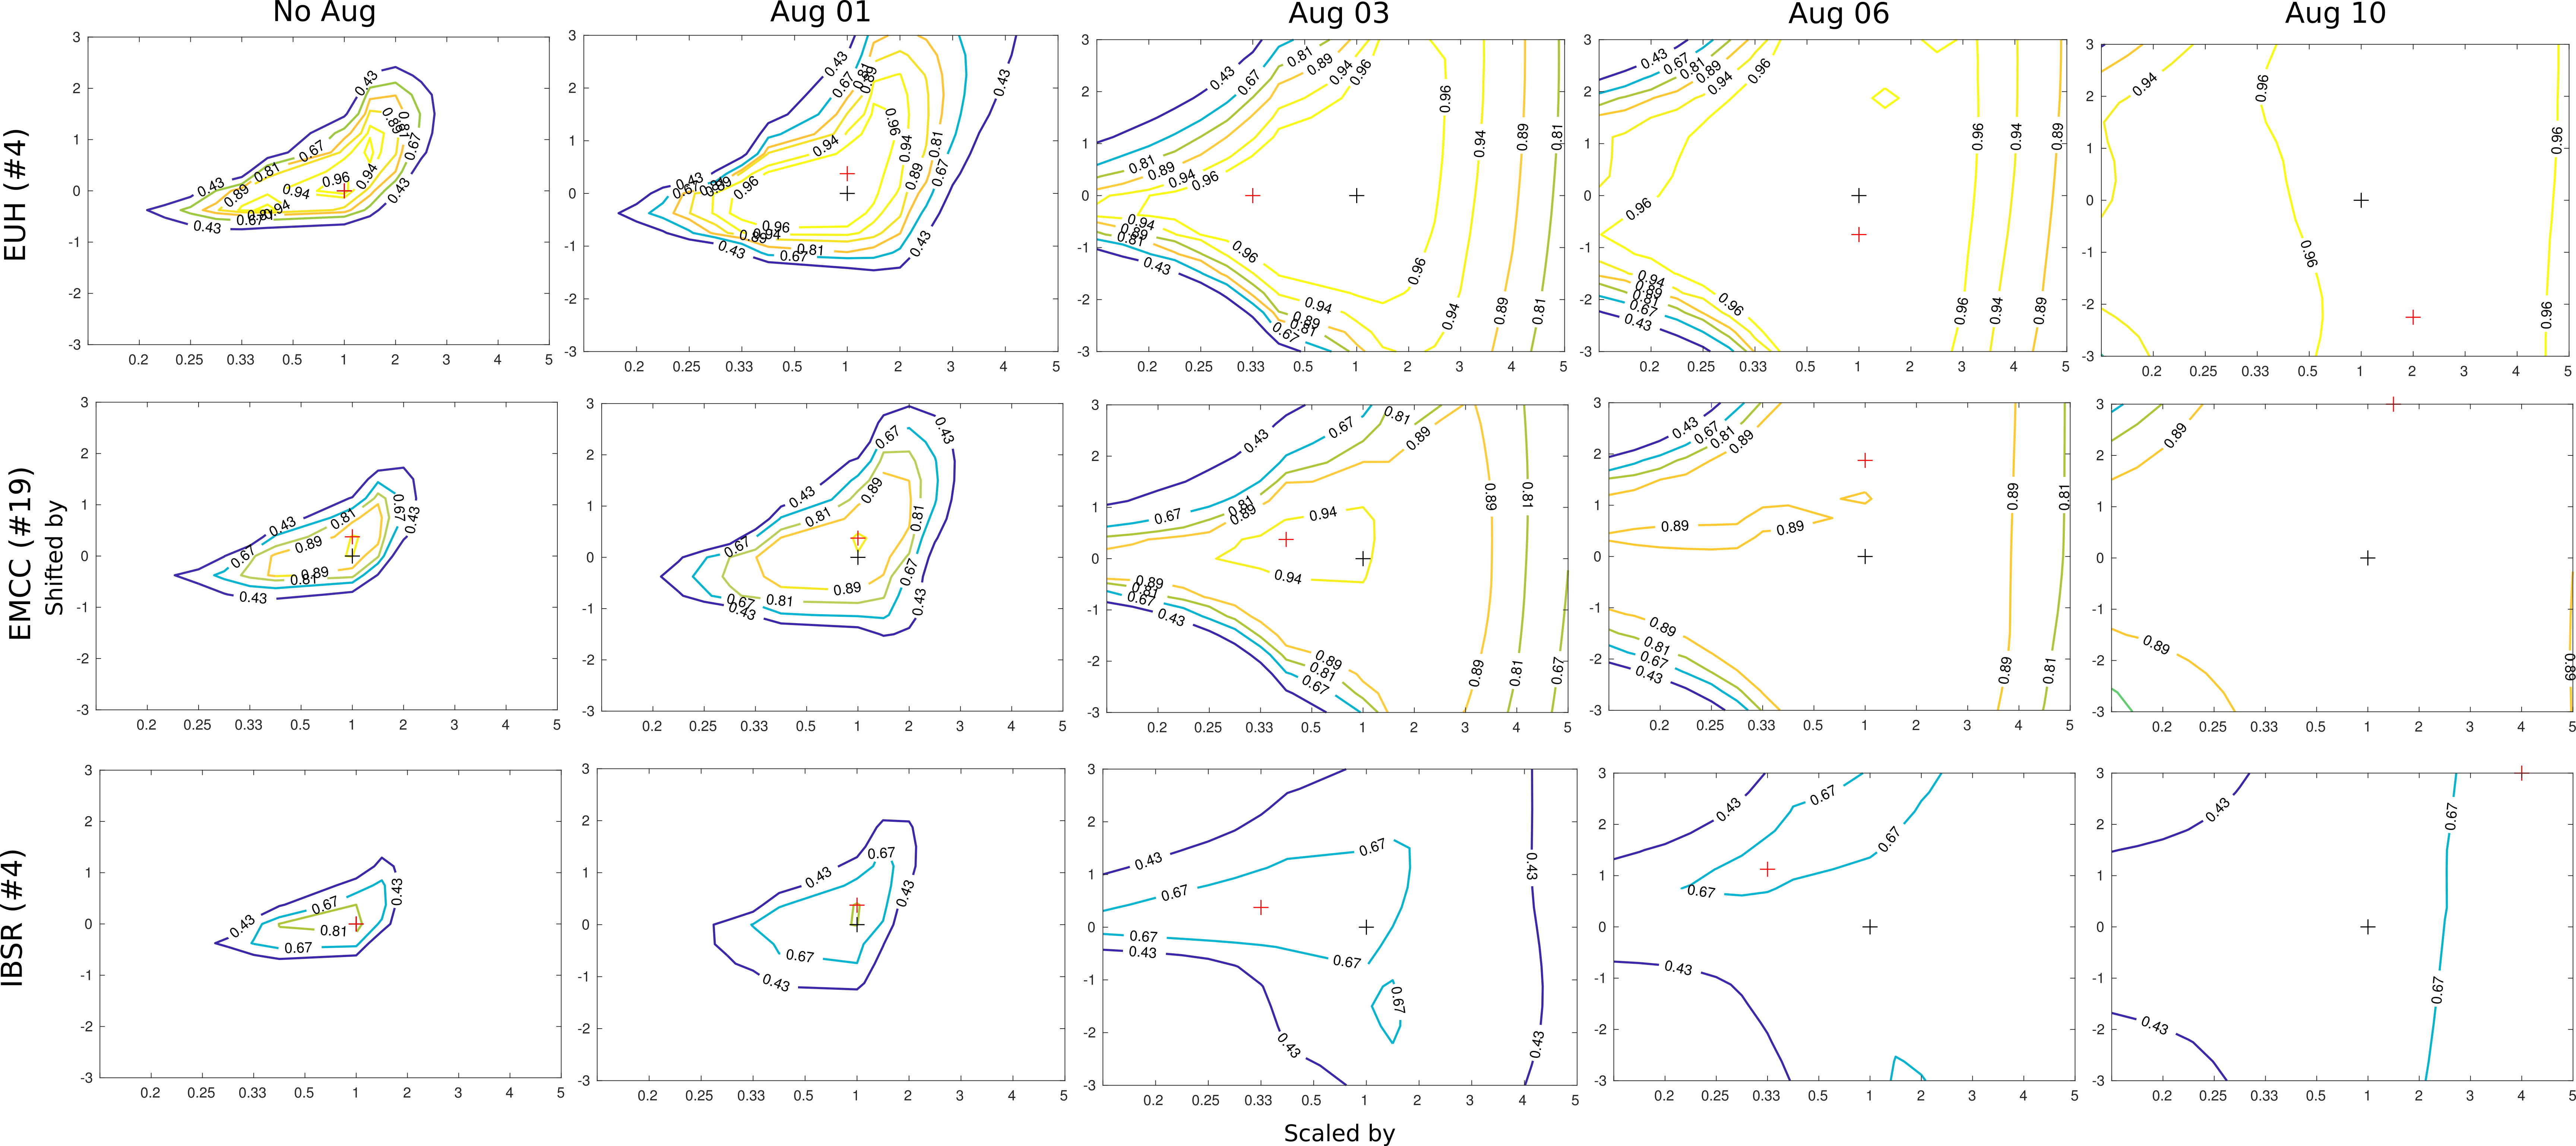
Figure 2 display boxplots of the DSCs achieved for all 68 evaluation datasets, describing the segmentation performance of all ten CNNs. The CNN achieving the best performance accuracy across all evaluation datasets did not include intensity augmentation, whilst the worst performing CNN included intensity augmentation with a standard deviation of 1 for both shift and scale. A general increase of the median DSC is present for the CNNs trained with the biggest amount of training samples. Figure 3 illustrates the resulting contour patterns from the intensity sensitivity analysis of the five networks trained using 3000 samples per subepoch and tested on three representative evaluation datasets. Across all subjects, the contour pattern broadens and flattens as the standard deviation of the augmentation distribution increases (No Aug -> Aug 01 - 10).Discussion and conclusion
The results indicate how intensity augmentation induces higher robustness of the CNN, as a broadening of the contour pattern (see Fig. 3) indicates a stabilization of the segmentation performance. In practice, this would make the CNN more generalizable and independent of variations in intensity distribution variations due to differing scanning parameters. However, the overall segmentation performance of the CNNs is decreasing as a result of increased variation in the training samples. This effect is partly counterbalanced by increasing the amount of training data (3000 to 6000 samples per subepoch) but is only sufficient for CNN Aug 01, 03, and 06 (see Fig. 2). Intensity augmentation is, in conclusion, a tool which may introduce higher generalizability, but not necessarily increase the segmentation performance. This effect should be further investigated in relation to different networks and image analysis problems.Acknowledgements
This work was supported by the German Research Foundation (DFG, DE2516/1-1, TI239/17-1).References
1. Litjens G, Kooi T, Bejnordi BK, Setio AAA, Ciompi F, Ghafoorian M, van der LaakBramvan J.A.W.M., van Ginneken B, Sánchez CL. A survey on deep learning in medical image analysis. Medical Image Analysis, 2017, 42: p. 60-88.
2. Anwar SM, Majid M, Qayyum A, Awais M, Alnowami M, Khan MK. Medical Image Analysis using Convolutional Neural Networks: A Review. Journal of medical systems, 2018, Vol. 42, Iss. 11.
3. Jacobsen N, Deistung A, Timmann D, Goericke SL, Reichenbach J, Güllmar J. „Analysis of intensity normalization for optimal segmentation performance of a fully convolutional neural network”. 16, ISMRM workshop on Machine Learning Part II, Washington D.C., 2018
4. Shah M, Xiao Y, Subbanna N, Francis S, Arnold DL, Collins DL, Arbel T. Evaluating intensity normalization on MRIs of human brain with multiple sclerosis. Medical Image Analysis, 2018, 15: 267–282.
5. Kamnitsas K, Ledig C, Newcombe VFJ, Simpson JP, Kane AD, Menon DK, Rueckert D, Glocker B. Efficient multi-scale 3D CNN with fully connected CRF for accurate brain lesion segmentation. Medical Image Analysis, 2017, 36: 61–78
Figures