4800
Automatic Segmentation of Brain Metastases Using Saturation Transfer Magnetic Resonance Imaging1Medical Biophysics, University of Toronto, Toronto, ON, Canada, 2Physical Sciences Platform, Sunnybrook Research Institute, Toronto, ON, Canada, 3Electrical and Computer Engineering, Lassonde School of Engineering, York University, Toronto, ON, Canada, 4Radiation Oncology, University of Toronto, Toronto, ON, Canada, 5Biological Sciences Platform, Sunnybrook Research Institute, Toronto, ON, Canada, 6Radiation Oncology, Sunnybrook Health Sciences Centre, Toronto, ON, Canada, 7Neurosurgery and Paediatric Neurosurgery, Medical University of Lublin, Lublin, Poland
Synopsis
Chemical exchange saturation transfer (CEST) and magnetization transfer (MT) are MR contrast mechanisms that have been shown to correlate with cancer metabolism. Given that CEST does not require exogenous contrast agents, the goal of this study was to investigate the potential of CEST for segmenting the images of brain metastasis. As such, the tumour, and edema were segmented on CEST images and compared with segmentation performed on FLAIR and post-gadolinium T1-weighted images. The results indicate that the Dice similarity coefficient ranges between 0.78 to 0.84, suggesting that CEST can potentially be used for segmentation of brain metastases.
Introduction
Chemical exchange saturation transfer (CEST) and magnetization transfer (MT) are MR contrast mechanisms that have been shown to correlate with cancer metabolism1. Given that CEST does not require exogenous contrast agents, the goal of this study was to segment tumour, edema, and white and grey matter on CEST images and compare the results with segmentation performed on FLAIR and post-gadolinium T1-weighted (post-Gd T1w) images.Methods
Imaging: Z-spectra were acquired in patients (n = 3 scanned pre-treatment, and post-treatment, which consisted of either single treatment stereotactic radiosurgery or fractionated radiotherapy) in a metastatic tumour-bearing axial slice of the brain at 3 T (Achieva, Philips Healthcare) using an eight-channel head coil and magnetization transfer-prepared turbo field echo sequence (resolution = 1.5 mm × 1.5 mm × 3 mm, SENSE factor = 2, TFE factor = 26, partial Fourier factor = 0.8). The saturation preparation consisted of four saturation B1 pulses each of 242 ms duration and 0.522 µT (linearly spaced frequency offsets; two repetitions; 4 min 45 s each), 3, or 5 µT (both log spaced; 1 min and 2 min 20 s, respectively) amplitude. Voxelwise B0-correction was performed with WASSR [DOI:10.1002/mrm.21873]. Inversion recovery images (1 min total) were acquired to calculate a T1 map. Whole brain 2D FLAIR and post-Gd T1w 3D fast field echo images were also acquired. In this study, only the post-treatment images were analyzed.
Data analysis: To perform segmentation, for each saturation B1, all Z-spectra were grouped with T1 maps to perform independent component analysis (ICA) before performing region of interest (ROI) delineation. ICA is a linear transformation from the original feature space to a new feature space such that each of the new individual features are mutually independent2. One of the ambiguities with ICA is the order of the computed components. The independent components of the CEST data were sorted according to the mutual information between each component and one of the original CEST images. To segment the ROIs, a semi-automatic segmentation algorithm was performed on the first two independent components (IC) of the CEST data. The segmentation procedure involves k-means clustering of the CEST ICs followed by the simple region growing algorithm3. To investigate the potential of CEST data for brain ROI segmentation, first, the tumour, necrotic tissue, edema, and grey and white matter were segmented on FLAIR and post-Gd T1w images to be used as the ground truth. Next, the segmentation algorithm was run on the independent components of the CEST data.
Results
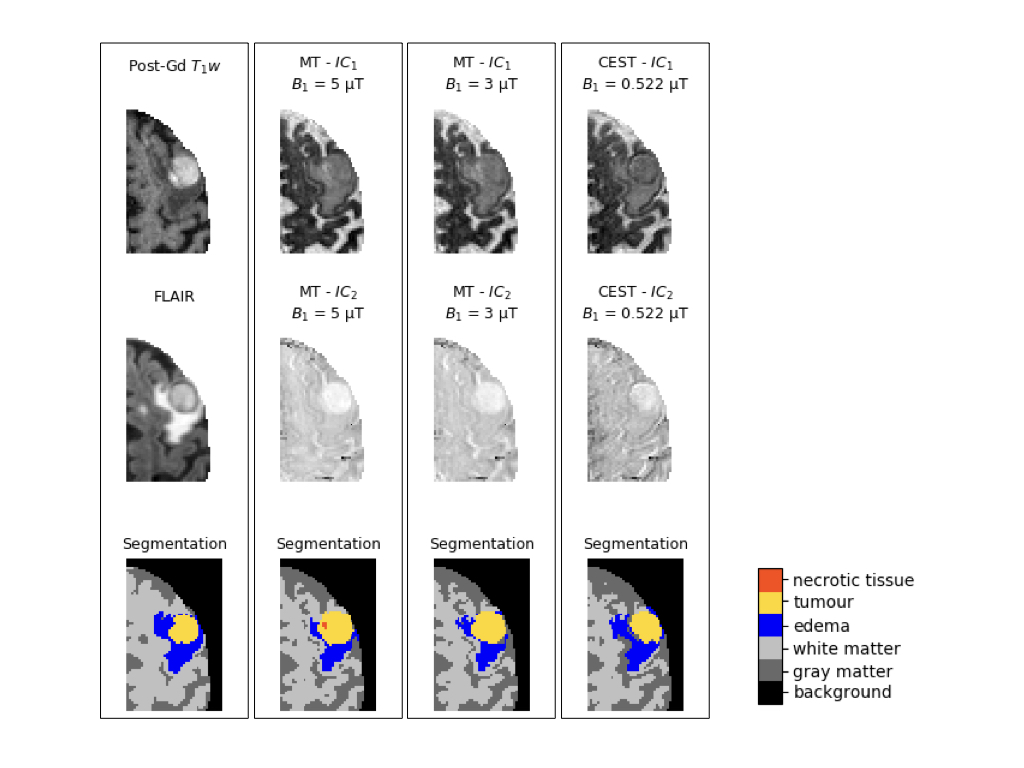
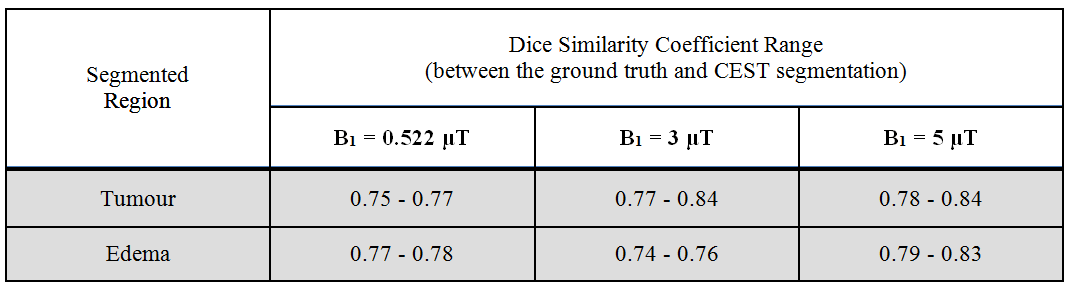
Figure 1 depicts the post-Gd T1w, and FLAIR images, and the independent components of the CEST/MT data acquired at different saturations B1, along with the segmented ROIs. Quantitative assessment of the segmented regions indicates that the best results belong to CEST data acquired at 5 µT where the Dice similarity coefficients between the corresponding segmentations for all patients ranged from 0.78 to 0.84 for tumour, and from 0.79 to 0.83 for edema. The quantitative results for tumour and edema segmentation are reported in Table I.Discussion
The results indicate that, not only can the tumour, edema and grey and white matter be successfully segmented using the independent components of the CEST or MT data, but also the MT data acquired at 5 µT can be used to segment the necrotic tissue which is not visible on FLAIR or post-Gd T1w images. According to Table I, the best results can be obtained using B1 = 5 µT. Given the long acquisition times of CEST, the next step is to use computational methods to find the minimum data required for accurate segmentation of the ROIs.Conclusion
The results of this study suggest that CEST imaging and computational methods can potentially be used to segment images of brain metastasis. The proposed method can potentially be incorporated into cancer diagnosis and treatment planning workflows to eliminate the need for using exogenous contrast agents for brain imaging.Acknowledgements
The authors would like to thank the CIHR (grant number PJT148660), and Terry Fox Research Institute (grant number 1083) for funding this project.References
1. Lam WW, Oakden W, Murray L, et al. Differentiation of normal and radioresistant prostate cancer xenografts using magnetization transfer-prepared MRI. Sci Rep. 2018. doi:10.1038/s41598-018-28731-0
2. Hyvärinen A, Oja E. Independent component analysis: Algorithms and applications. Neural Networks. 2000. doi:10.1016/S0893-6080(00)00026-5
3. Gonzalez RC, Woods RE, Masters BR. Digital Image Processing, Third Edition. J Biomed Opt. 2009. doi:10.1117/1.3115362
Figures