4794
Automatic Segmentation Of The Myocardium in Cardiac Arterial Spin Labelling Images Using a Deep Learning Model Facilitates Myocardial Blood Flow Quantification1Bioengineering, Universidad Carlos III de Madrid, Leganés, Spain, 2Instituto de Investigación Sanitaria Gregorio Marañón, Madrid, Spain, 3Radiology Deparment, Clínica Universidad de Navarra, Pamplona, Spain
Synopsis
Arterial Spin Labelling (ASL) allows to quantify Myocardial Blood Flow (MBF) by averaging over multiple ASL pairs. However, the procedure heavily depends on the manual segmentation of the myocardium. In this work, we introduce a Deep Learning model to segment this region and build a completely automatic pipeline for the MBF estimation. The accomplished evaluation results prove the success of the proposed method, which presents: 1) high overlap between the automatically extracted masks and those manually segmented by an expert (Dice Similarity Coefficient around 90%) and 2) good agreement of the MBF estimations with those obtained from the manual annotations.
Introduction
Arterial Spin Labelling (ASL) is increasingly being explored1 in cardiovascular magnetic resonance (CMR) due to its ability to quantify myocardial blood flow (MBF) without an exogenous contrast agent1,2. However, quantification is based on manual segmentation of the Region of Interest (ROI) which is time consuming and prone to errors. The number of manually extracted ROIs is reduced by registration of the ASL series, but, this introduces new errors and requires supervision. Therefore, there is a need for a reliable automatic segmentation of the myocardium in the cardiac ASL imaging series.
In this context, we propose a Deep Learning model to automatically segment the myocardium and consequently, enable an automatic extraction of the MBF.
Materials
Cardiac MRI series: Eleven subjects were scanned on a 3T Skyra. The scanning session included: localizers to obtain a mid-ventricular short-axis plane of the myocardium, a baseline image for quantification and a FAIR labeling ASL sequence. 60 free breathing ASL images were obtained per volunteer (TI = 1s, TR = 4RR) employing bSSFP readout with the parameters: FOV:300x300mm, matrix: 96x96, slice thickness:10mm, flip angle:70º, Grappa-2i.
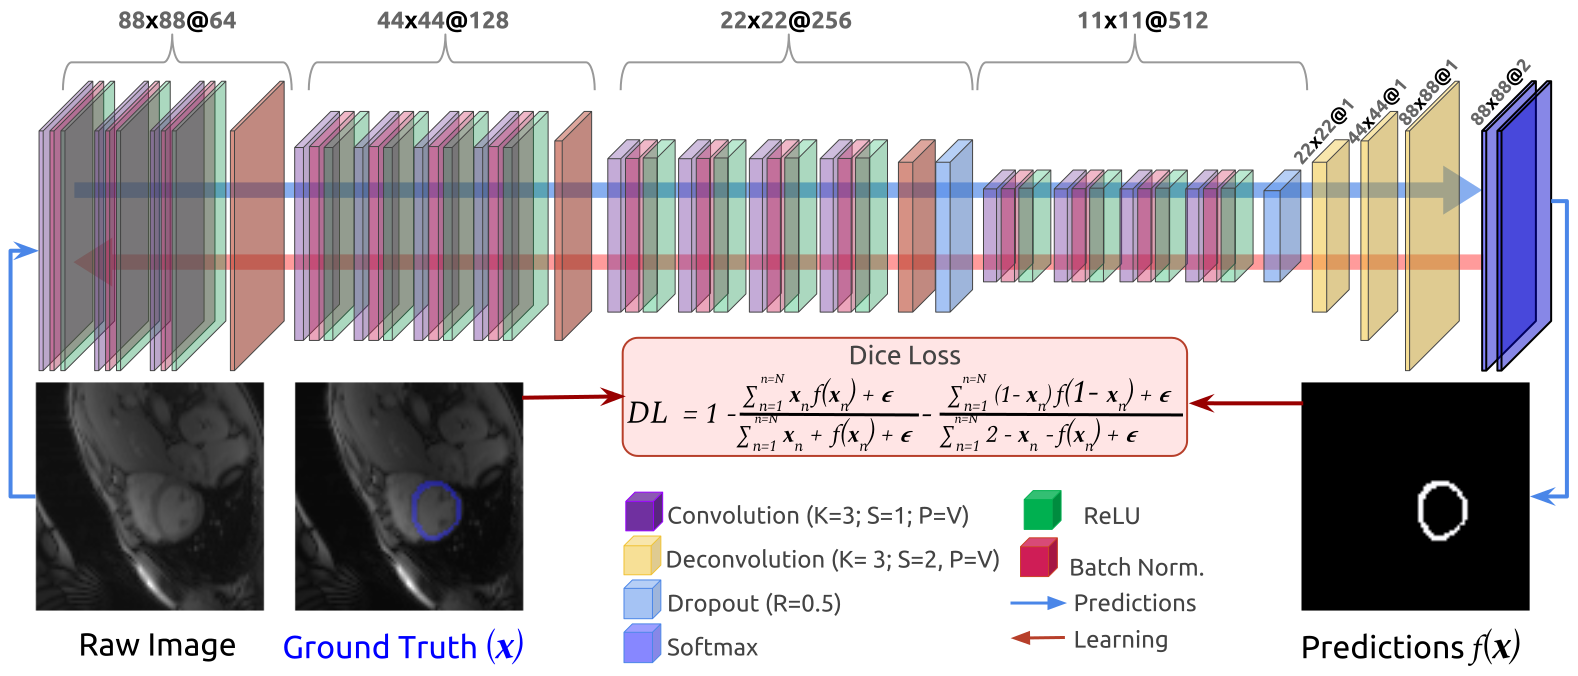
Ground Truth Myocardium Masks: The myocardium was manually segmented by an expert in thirteen of the available sixty frames per subject(Fig.1).
Myocardial Blood Flow (MBF) values: The myocardium mask is manually delimited on the preregistered ASL serie in order to apply the Buxton model2. Outliers are not discarded
Methods
We readapted the vu-tran3 model, successfully employed in several cardiac MRI non-ASL applications4,5.
The ability of the proposed model (Fig.1) to infer trustworthy segmentations are based on the following foundations:
- Data augmentation: The small amount of labelled data (143 frames) is insufficient to provide a model able to generalize the segmentation to unseen cases. To avoid this issue, each original frame is modified (augmented) employing several randomized image operations5,6: Addition of noise, spatial transformations, and interpolations. The data augmentation step provides thousands of “new” valid images to train the model.
- Model architecture: The model encodes each image, through sequences of convolutional, ReLUs (Rectifier Linear Units) and Batch Normalization layers assembled by size, which is reduced employing Max Pooling layers. To avoid overfitting, two Dropout layers are included at the densest levels of the architecture. Finally, the dense features are upsampled using three deconvolutions. The last one acts as bottleneck layer to pass its activations to the Softmax classifier which yields probability maps for a predicted mask.
- Learning process: The architecture parameters are learnt employing backpropagation of the error. Therefore, the selection of a proper loss function is critical. Recently7, the Dice Loss (DL) function, defined in Fig.1, has been proved useful in segmentation problems, thus DL is employed in our model. The model uses the ADAM method to minimize DL (learning rate=10−3) and train up to 500 epochs with a mini-batch of 5.
Results
We performed 11-fold cross-validation and describe results over all hold-out sets (e.g., 13 validation images per fold). Per subject, we obtain 61 masks (ASL images and baseline).
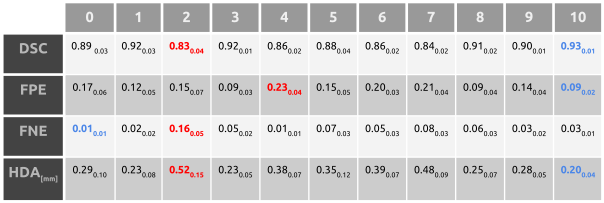
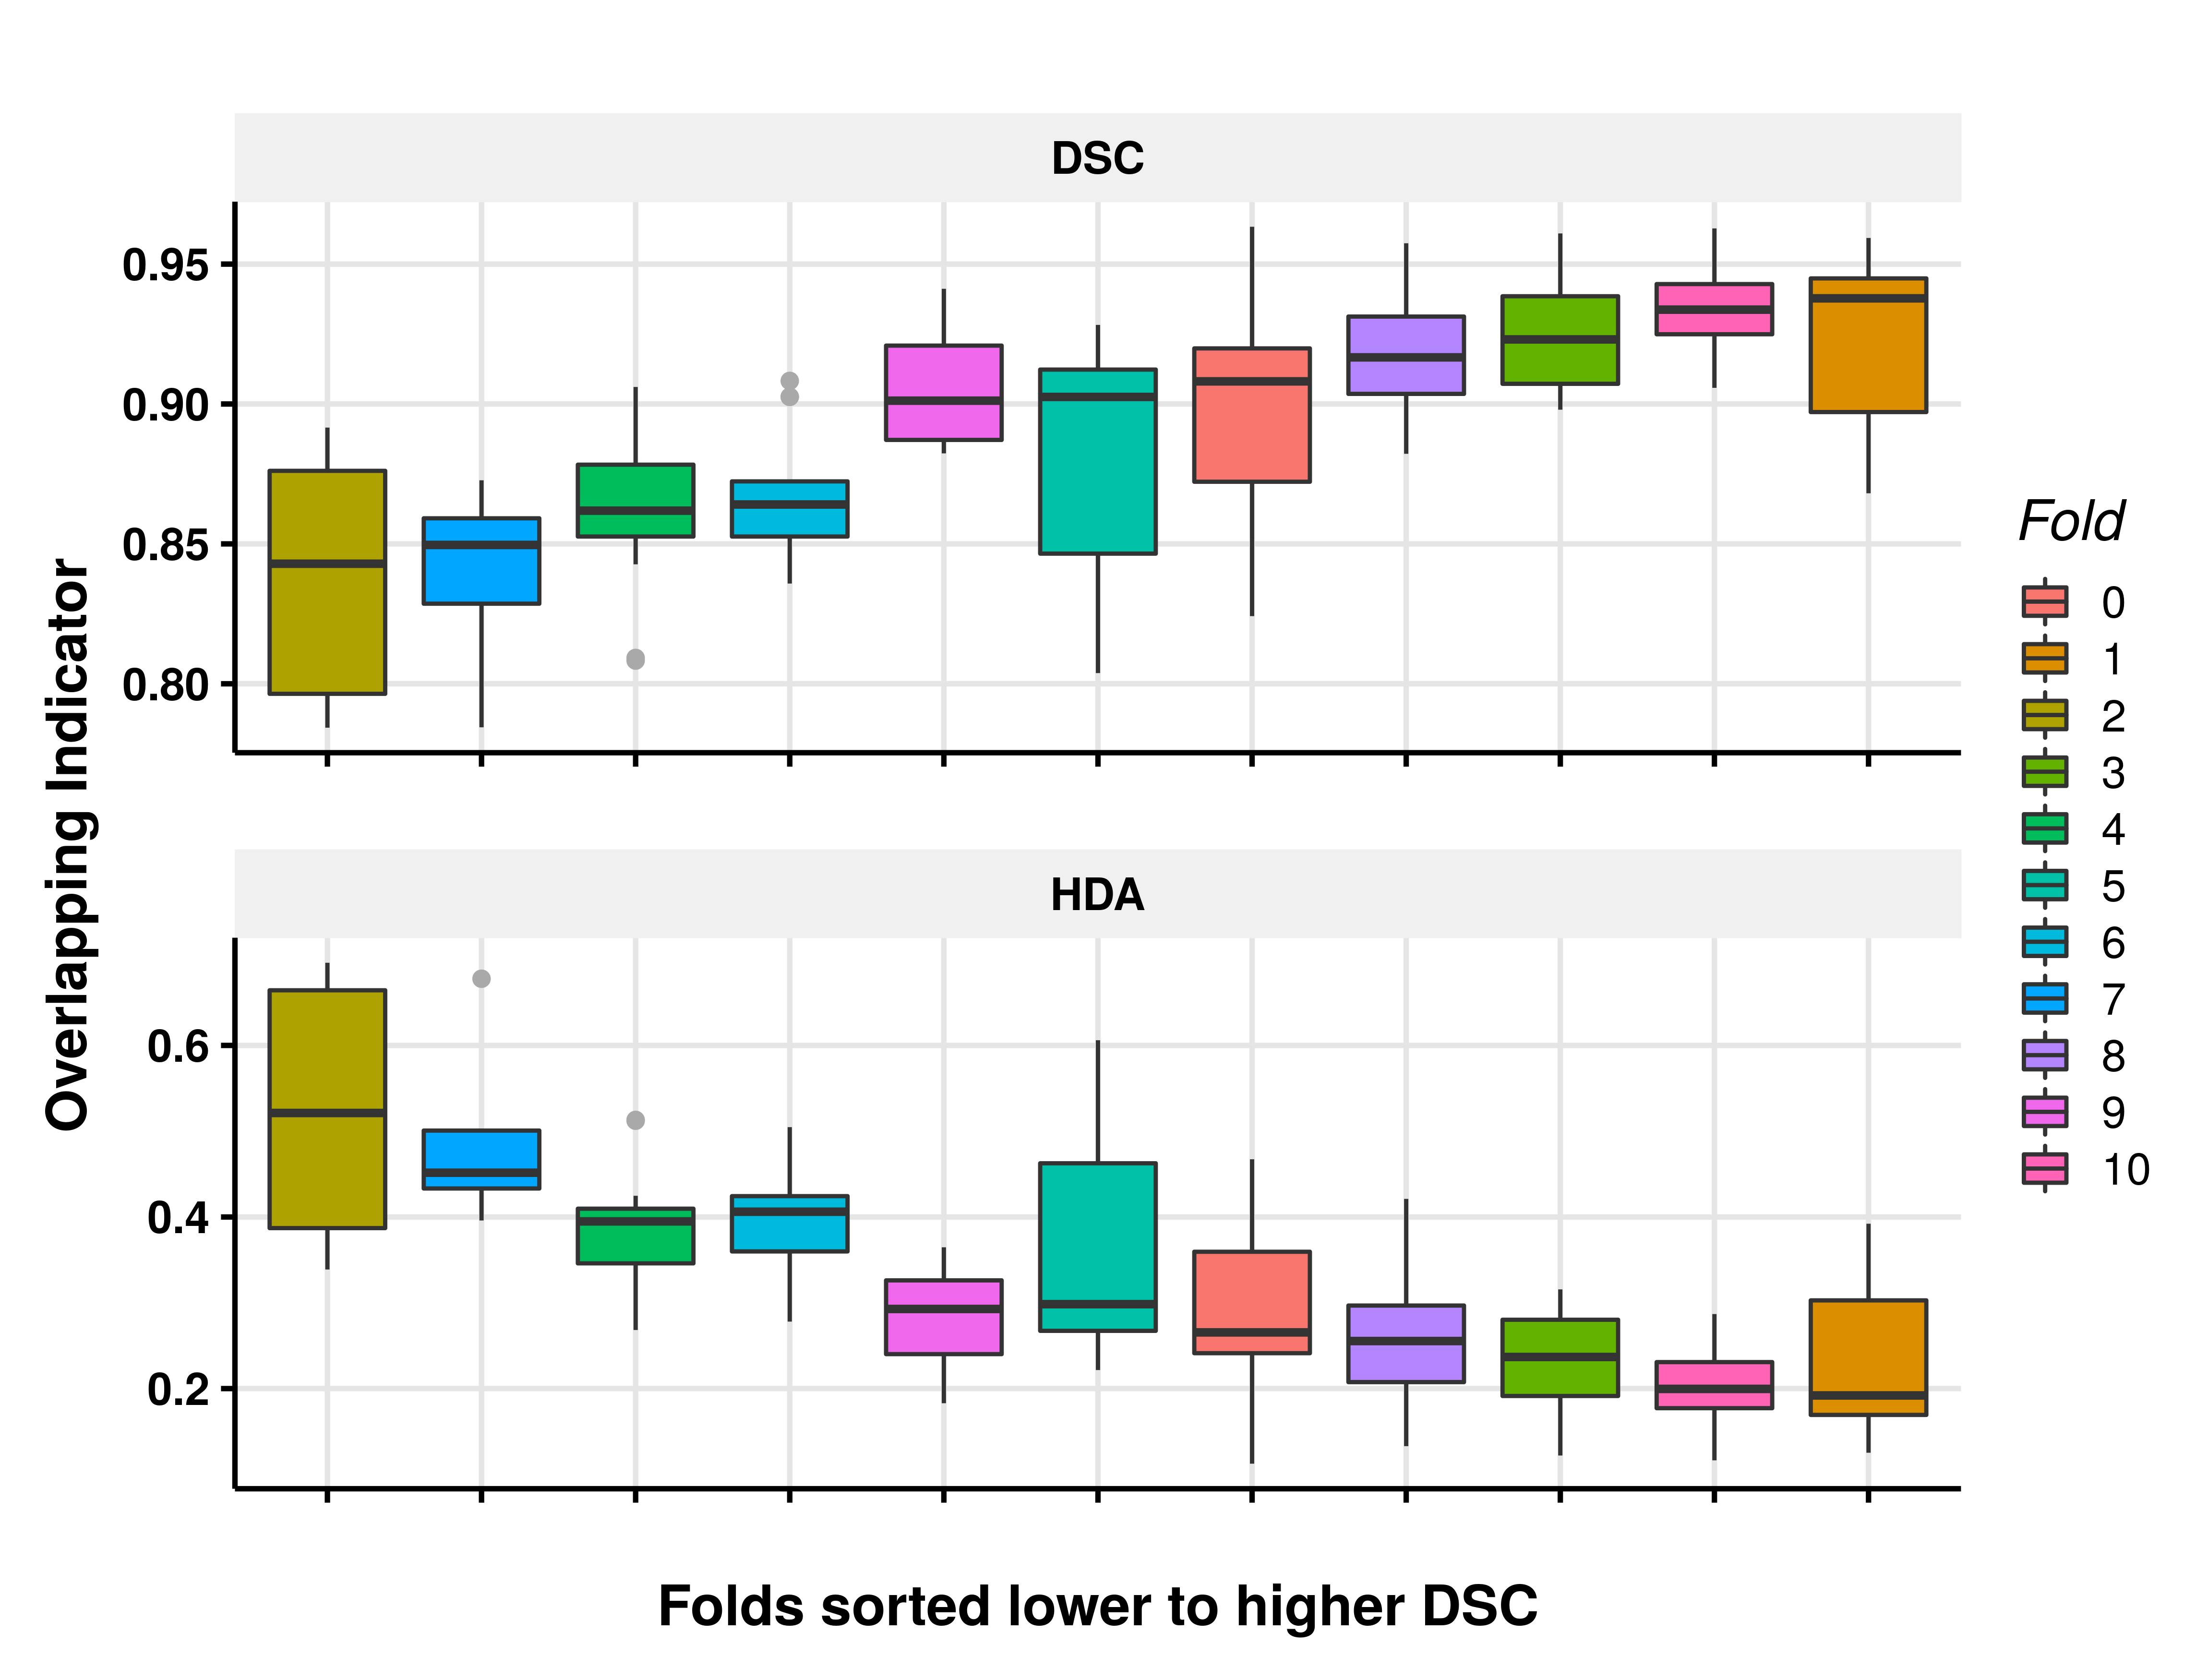
Table 1 and Fig.2 present the main indicators of overlap between ground truth masks and their respective automatic segmentations, e.g: Dice Similarity Coefficient(DSC); False Positive Error(FPE); False Negative Error(FNE) and Average Hausdorff Distance(HDA). The DSC shows coincidences between manual and automatic masks of 83% to 93%. These differences are, in average, mostly due to the FPE (9% - 23%). The HDA presents small values (0.20mm - 0.52mm) and a consistent inverse relation with the DSC results (Fig.2).
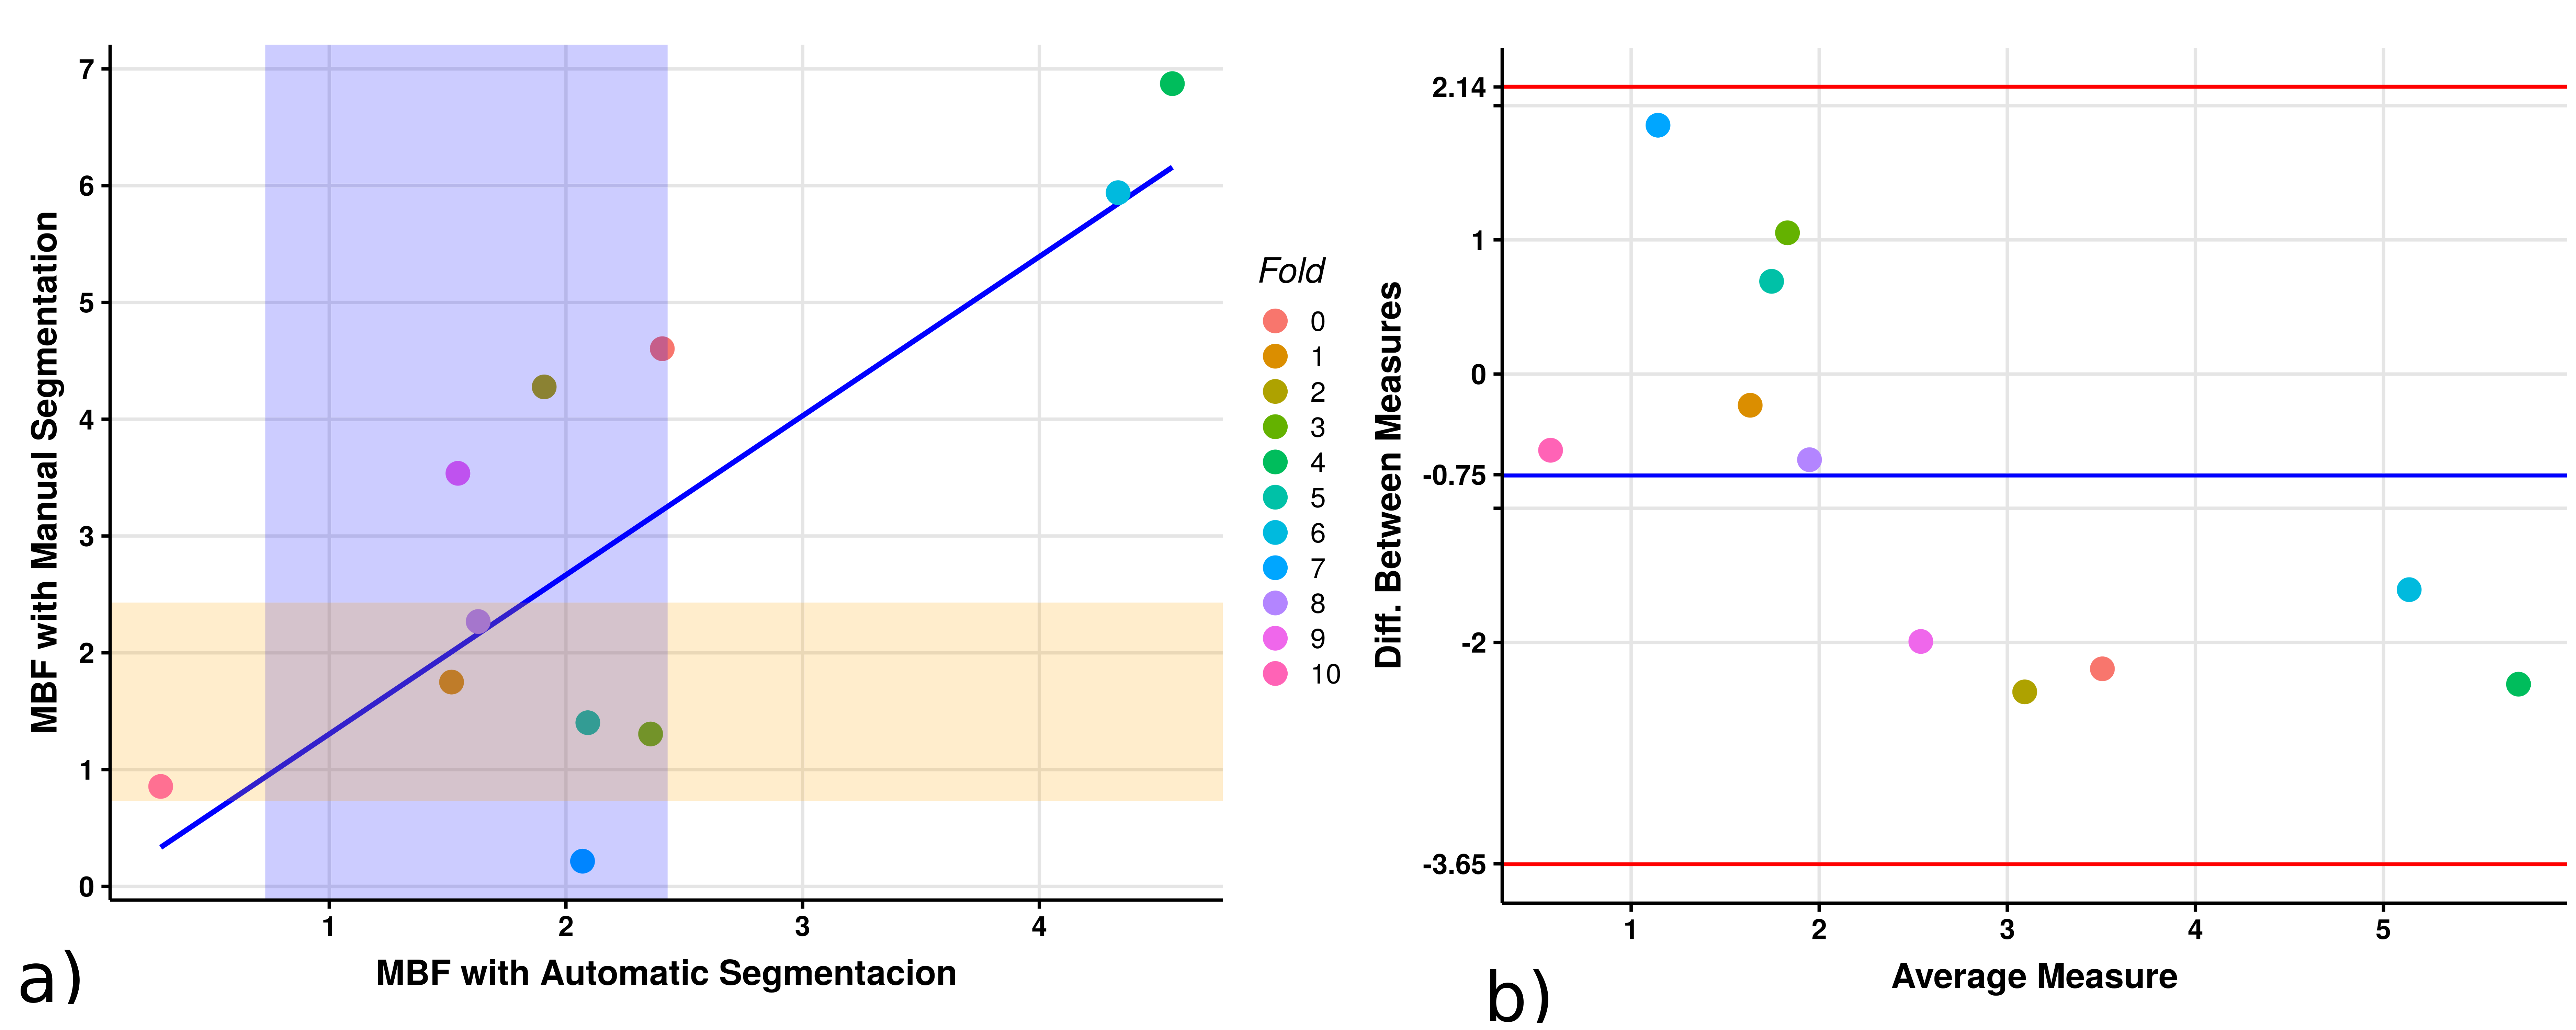
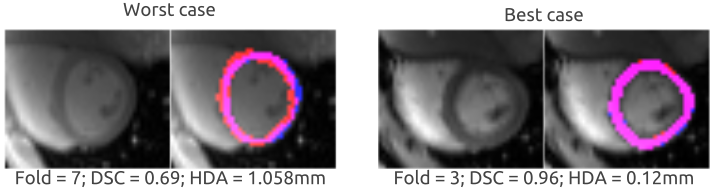
Figure 3.a, shows a comparison between MBF values obtained from manually segmented masks (see Materials) and their automatic counterpart presenting a correlation of 0.79. Fig 3.b, displays the good agreement between measures with all the data within the confidence interval and a bias for big differences.Figure 4, shows qualitative examples of the automatic segmentations obtained. The overlap between masks is clearly showed even in the worst case.
Discussion and Conclusion
The results have proven the proposed method as a reliable technique to automatically segment the myocardium and quantify MBF. Besides, the model avoids errors from the necessary registration step in the traditional approach to ASL quantification2.
Beyond the limitations of this pilot study, accomplished with a limited number of subjects, the results point to a model able to avoid the overfitting5,7. Namely, it could reach outstanding results with a bigger and heterogeneous sample of ground truth images.
Segmentation errors, mostly due to FPE, (i.e., thicker automatic segmentations than the manual ones), could be easily reduced by applying morphological operations. However, it is important to emphasize that the DSC is sensitive to small dissimilarities in the masks.
Acknowledgements
This work has been partially supported by Asociación de Amigos de la Universidad de Navarra and by projects TEC2015-73064-EXP and TEC2016-78052-R from the Spanish Ministry of Economy, Industry and Competitiveness.References
1. Karamitsos, T. D. Mapping the Future of Myocardial Ischemia Testing With Cardiac Magnetic Resonance. Journal of the American College of Cardiology. 71, 980–982 (2018).
2. Kober, F., Jao, T., Troalen, T. & Nayak, K. S. Myocardial arterial spin labeling. Journal of Cardiovascular Magnetic Resonance 18, 22 (2016).
3. Tran, P. V. A Fully Convolutional Neural Network for Cardiac Segmentation in Short-Axis MRI. 1–21. ArXiv (2016).
4. Xue, W., Brahm, G., Pandey, S., Leung, S. & Li, S. Full left ventricle quantification via deep multitask relationships learning. Medical Image Analysis 43, 54–65 (2018).
5. Litjens, G. et al. A survey on deep learning in medical image analysis. Medical Image Analysis. 42, 60–88 (2017).
6. Pawlowski, N. et al. DLTK: State of the Art Reference Implementations for Deep Learning on Medical Images. ArXiv (2017).
7. Milletari, F., Navab, N. & Ahmadi, S. A. V-Net: Fully Convolutional Neural Networks for Volumetric Medical Image Segmentation. Fourth Int. Conf. 3D Vis. 565–571, 565–571 (2016).
Figures