4736
Technical Considerations for Semantic Segmentation in Magnetic Resonance Imaging using Deep Convolutional Neural Networks: A Case Study in Femoral Cartilage Segmentation1Radiology, Stanford University, Stanford, CA, United States, 2Bioengineering, Stanford University, Stanford, CA, United States, 3Orthopedic Surgery, Stanford University, Stanford, CA, United States, 4Electrical Engineering, Stanford University, Stanford, CA, United States
Synopsis
Deep convolutional neural networks (CNNs) have shown promise in challenging tissue segmentation problems in medical imaging. However, due to the large size of these networks and stochasticity of the training process, the factors affecting CNN performance are difficult to analytically model. In this study, we numerically evaluate the impact of network architecture and characteristics of training data on network performance for segmenting femoral cartilage. We show that extensive training of several common network architectures yields comparable performance and that somewhat optimal network generalizability can be achieved with limited training data.
Introduction
Semantic segmentation is a critical task for localizing anatomy and identifying pathology in MR images. However, manual segmentation of tissue structures is a cumbersome process prone to inter-reader variations1. Recent advances in deep-learning and convolutional neural networks (CNNs) may decrease computational time and eliminate inter-reader variability2,3,4. However, due to the challenge in analytically modeling CNNs, it is difficult to evaluate the generalizability of these networks.
In this study, we performed segmentation of femoral articular cartilage as an archetype for tissues that are challenging to segment as cartilage has a volumetric, thin, curved structure and limited imaging contrast. We systematically evaluate how variations in network architecture and training data impact the generalizability of CNNs for segmentation of femoral cartilage in knee MRI.
Methods
Dataset
3D sagittal double-echo in steady-state (DESS) volumes and corresponding femoral cartilage segmented masks were acquired from the iMorphics dataset5. 88 patients, scanned at two time points one year apart, were randomly split into disjoint cohorts of 60 patients for training, 14 for validation, and 14 for testing, resulting in 120 (training), 28 (validation), and 28 (testing) volumes. An approximately equal distribution of Kellgren-Lawrence (KL) grades was maintained among all three groups. During training, network weights were initialized using He initialization6.
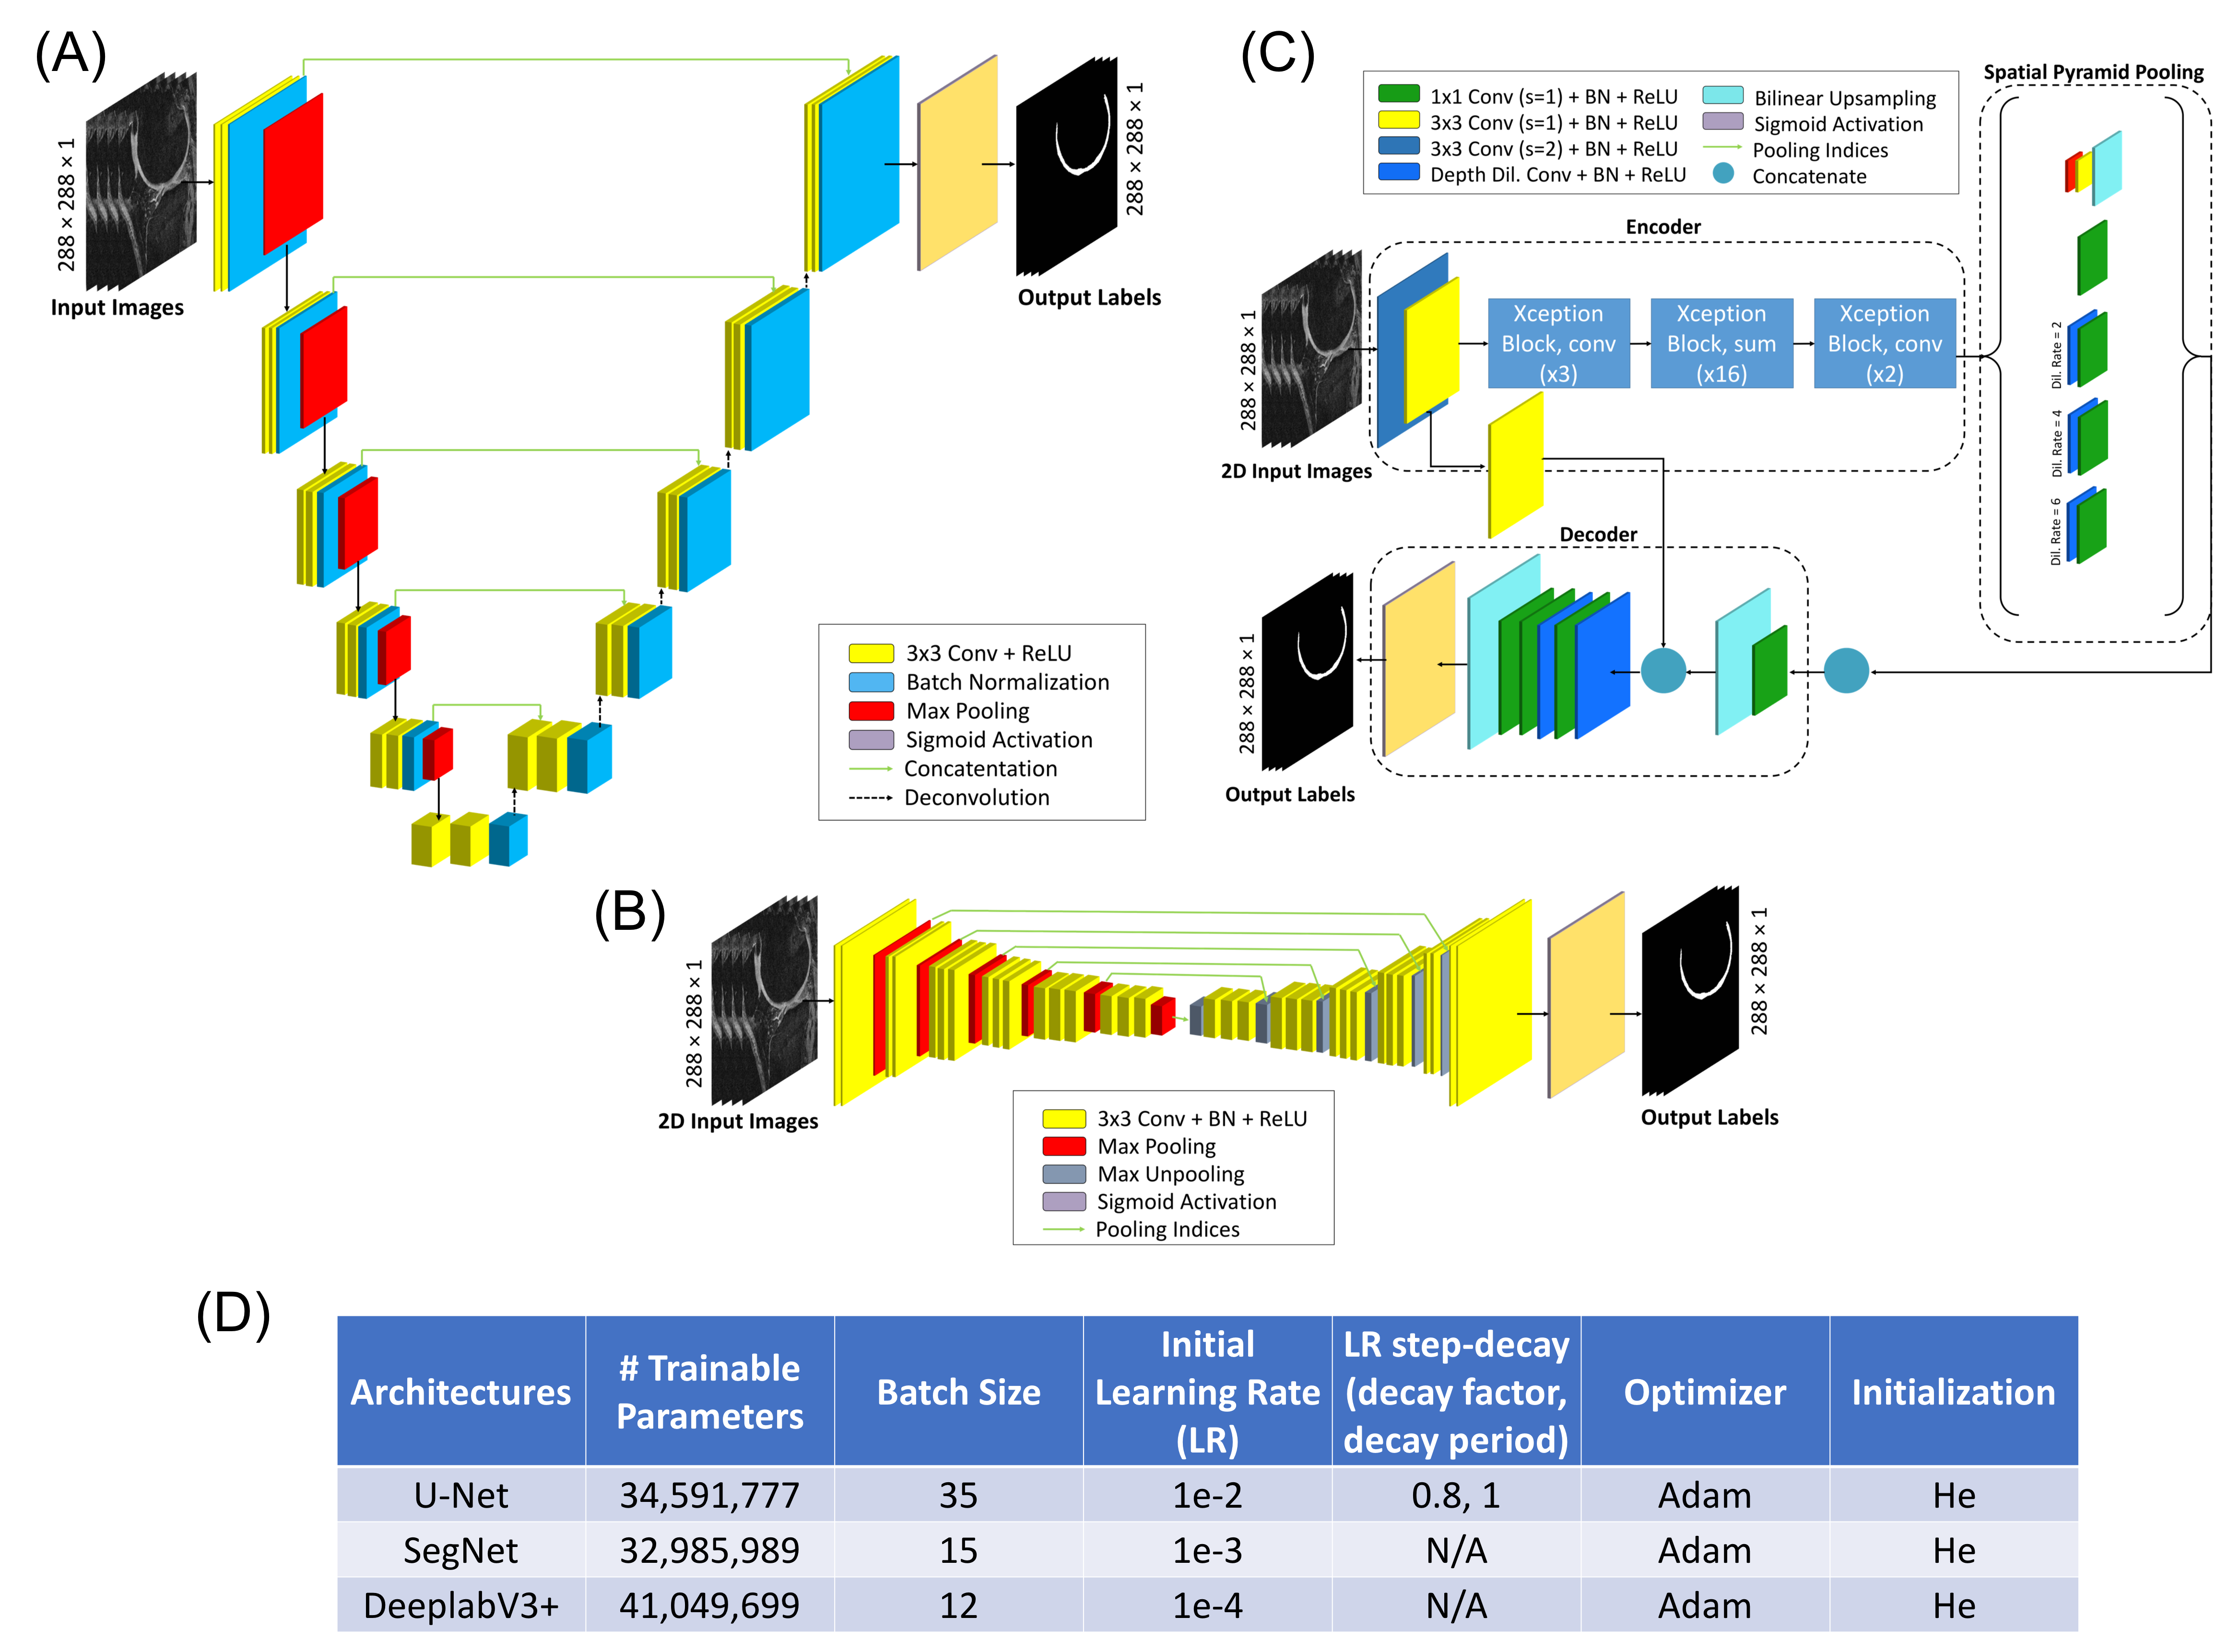
Base Network Architecture
We utilized three general 2D CNN architectures that use variations of the encoder-decoder framework: U-Net7, SegNet8, and DeeplabV3+9 (Fig.1a-c). All architectures were trained from scratch (20-epochs) and correspondingly fine-tuned (20-epochs), each with empirically optimized hyperparameters (Fig.1d).
Volumetric Architecture
To evaluate whether 3D inputs improve spatial localization of tissues, we developed two renditions of the 2D U-Net architecture: the 2.5D and 3D U-Nets. The 2.5D U-Net utilizes a N-to-1 mapping, taking N consecutive input slices and generating a 2D segmentation on the central slice. The 3D U-Net applies an N-to-N mapping. Three versions of the 2.5D U-Net were evaluated (N=3,5,7). The 3D U-Net was trained using 32 consecutive slices (N=32) to maximize the through-plane receptive field.
Loss Function
We evaluated three training loss functions, which are popular in semantic segmentation due to their robustness to class imbalances, for training instances of the 2D U-Net: dice loss, binary cross-entropy (BCE), and weighted cross-entropy (WCE). Class weights for WCE were empirically determined by the inverse of the relative frequencies of background and cartilage pixels in the training set.
Data Augmentation
We performed four-fold physiologically plausible data augmentation for 2D slices using random scaling, shear, contrast adjustment, and motion blurring to compare 2D U-Net performance on augmented versus non-augmented training data. To equalize the number of backpropagation steps, the non-augmented network was trained 5x longer (100 epochs) than the augmented network.
Data Limitation
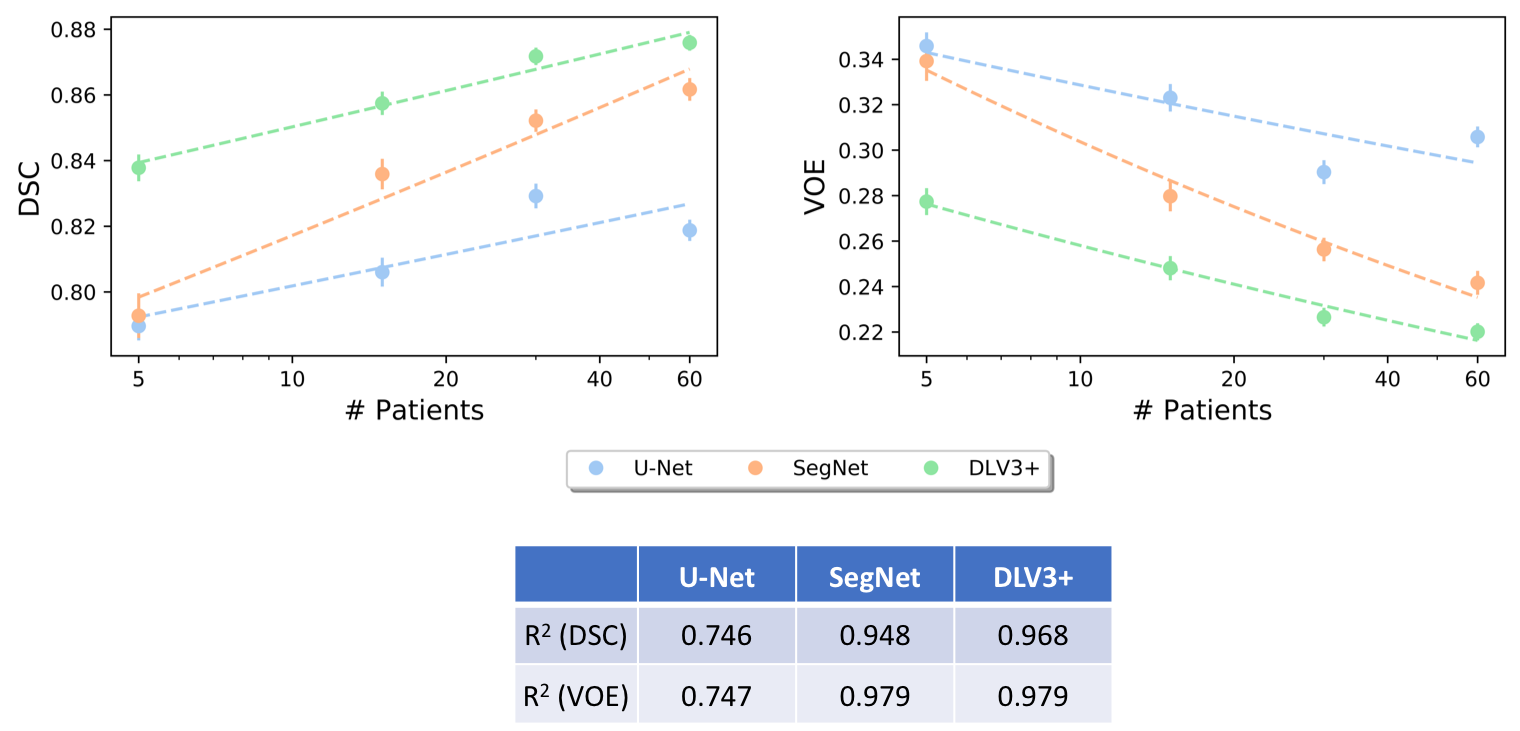
We trained the three 2D network architectures on varying extents of subsampled training data. The original training set (consisting of 60 patients) was randomly sampled (with replacement) to create 4 sub-training sets of 5, 15, 30, and 60 patients with similar distributions of KL grades. These networks were trained for 240, 80, 40, and 20 epochs, respectively, to ensure that all networks had an equal number of backpropagation steps.
Statistical Analysis
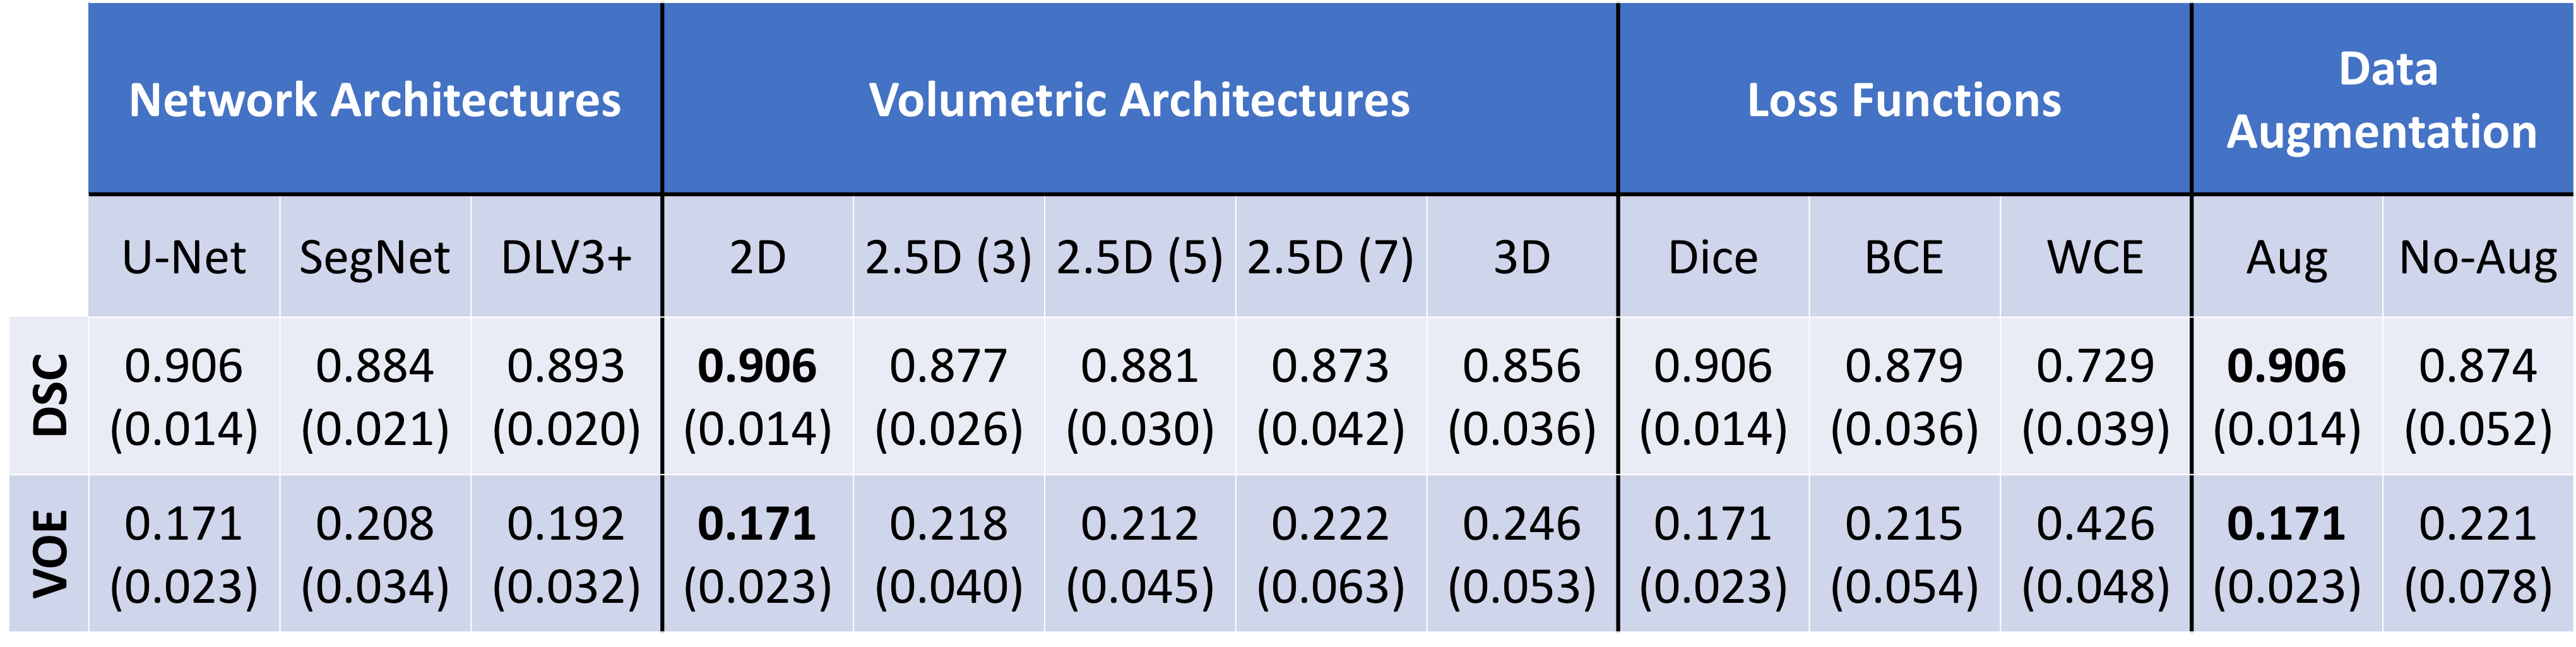
Dice score coefficients (DSC) and volumetric overlap errors (VOE) were used to quantify segmentation accuracy with reference to manual segmentations. Kruskal-Wallis tests, and corresponding Dunn post-hoc tests, (α=0.05) were used to quantify significance measures between different network instances.
Results
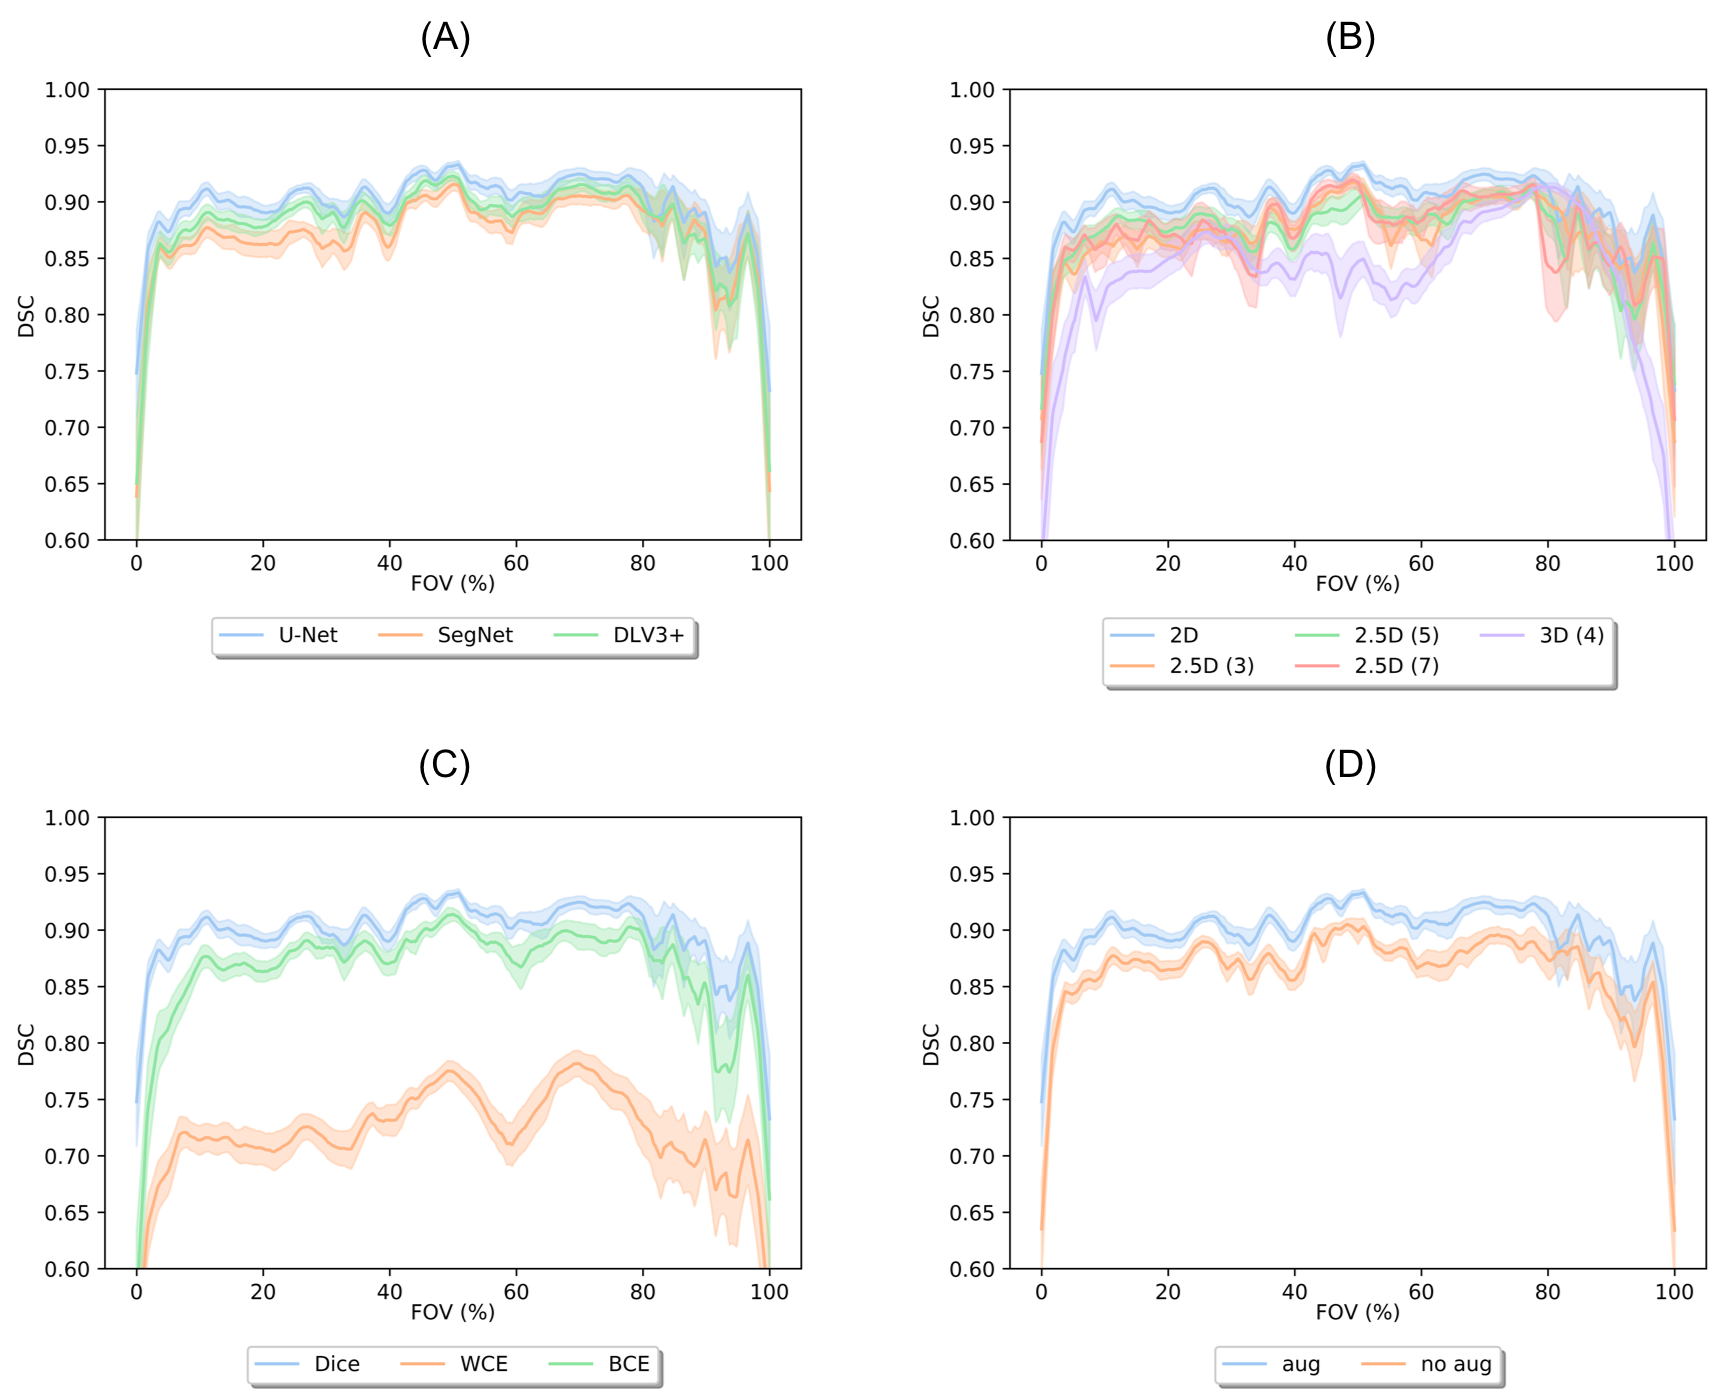
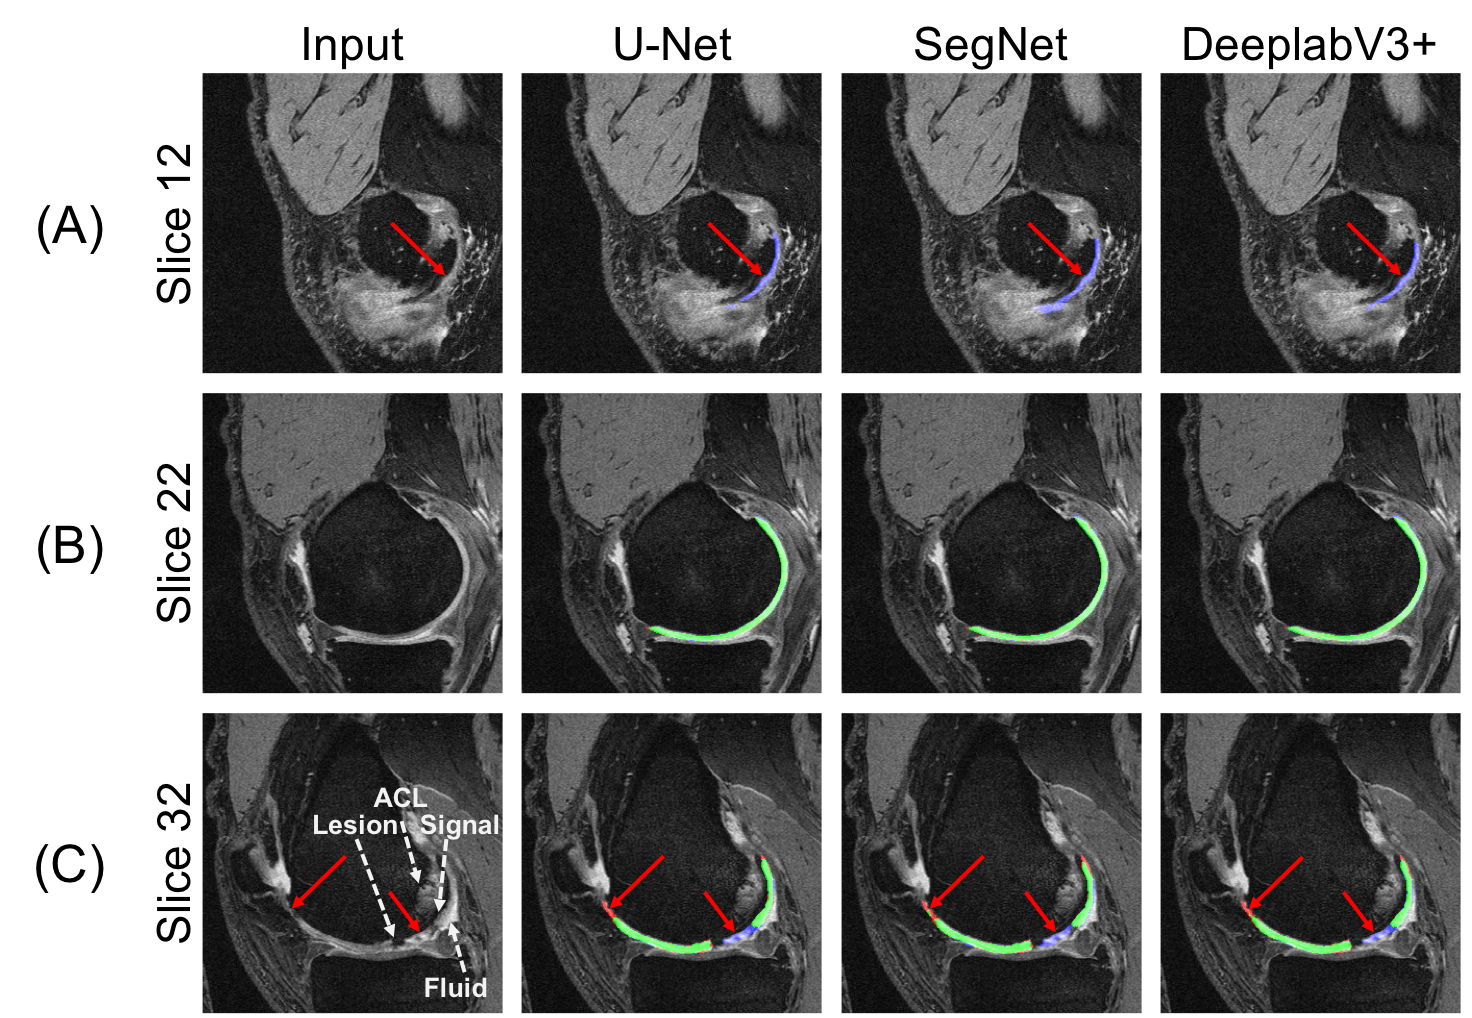
The 2D U-Net significantly outperformed SegNet as well as 2.5D and 3D U-Net volumetric models (p<0.01). The U-Net model using dice loss had higher DSC and VOE performance compared to WCE (p<0.01) and BCE. Data augmentation resulted in a significant (p<0.01) segmentation improvement. Comprehensive results are shown in Fig. 2. Retrospective subsampling of training data showed a power-law trend between number of patients (training) and segmentation accuracy (Fig.3). To map segmentation accuracy to anatomical regions in patients of variable knee sizes, each slice was normalized to the field-of-view (Fig.4).Discussion
All models with different base architectures displayed low precision to cartilage regions in edge and medial-lateral transition slices, while having high fidelity in central slices (Fig.5). While class-weighting is commonly performed, results on the model trained using WCE loss demonstrated low accuracy in classifying non-cartilage regions, suggesting that weighted losses favor false positives over false negatives. The power-law relationship between training data and segmentation accuracy suggests an asymptotic limit for network performance, corroborating previous studies on non-medical images10.Conclusion
In this study, we demonstrate the tradeoffs in optimizing CNN performance using variations in network architecture and training data characteristics. While robust networks can be optimally trained with limited data, these results also suggest an inherent performance limit for CNNs.Acknowledgements
Research support provided by NIH AR0063643, NIH EB002524, NIH AR062068, NIH EB017739, NIH EB015891, and Philips.References
[1] Eckstein F, Kwoh CK, Link TM, investigators O. Imaging research results from the Osteoarthritis Initiative (OAI): a review and lessons learned 10 years after start of enrolment. Annals of the rheumatic diseases 2014:annrheumdis-2014-205310.
[2] Avendi M, Kheradvar A, Jafarkhani H. A combined deep-learning and deformable-model approach to fully automatic segmentation of the left ventricle in cardiac MRI. Medical image analysis 2016;30:108-119.
[3] Liu F, Zhou Z, Jang H, Samsonov A, Zhao G, Kijowski R. Deep convolutional neural network and 3D deformable approach for tissue segmentation in musculoskeletal magnetic resonance imaging. Magnetic resonance in medicine 2018;79(4):2379-2391.
[4] Pereira S, Pinto A, Alves V, Silva CA. Brain tumor segmentation using convolutional neural networks in MRI images. IEEE transactions on medical imaging 2016;35(5):1240-1251.
[5] Peterfy C, Schneider E, Nevitt M. The osteoarthritis initiative: report on the design rationale for the magnetic resonance imaging protocol for the knee. Osteoarthritis and cartilage 2008;16(12):1433-1441.
[6] He K, Zhang X, Ren S, Sun J. Delving deep into rectifiers: Surpassing human-level performance on imagenet classification. 2015. p 1026-1034.
[7] Ronneberger O, Fischer P, Brox T. U-net: Convolutional networks for biomedical image segmentation. 2015. Springer. p 234-241.
[8] Badrinarayanan V, Kendall A, Cipolla R. Segnet: A deep convolutional encoder-decoder architecture for image segmentation. arXiv preprint arXiv:151100561 2015.
[9] Chen L-C, Papandreou G, Schroff F, Adam H. Rethinking atrous convolution for semantic image segmentation. arXiv preprint arXiv:170605587 2017.
[10] Hestness J, Narang S, Ardalani N, Diamos G, Jun H, Kianinejad H, Patwary M, Ali M, Yang Y, Zhou Y. Deep learning scaling is predictable, empirically. arXiv preprint arXiv:171200409 2017.
Figures