4726
Performance of Automatic Cerebral Arterial Segmentation of MRA Images Improves in Patients with Anemia and Sickle Cell Disease Compared with Healthy Volunteers.1Viterbi School of Engineering, University of Southern California, Los Angeles, CA, United States, 2Division of Cardiology, Children's Hospital Los Angeles, Los Angeles, CA, United States, 3Division of Neonatology, Children's Hospital Los Angeles, Los Angeles, CA, United States, 4Department of Pediatrics, Keck School of Medicine, University of Southern California, Los Angeles, CA, United States
Synopsis
Sickle cell disease (SCD) and chronic anemia cause morphological abnormalities in the cerebral arterial vasculature that are observable using time-of-flight magnetic resonance angiography (MRA). We seek to evaluate the accuracy of automatic vessel segmentation algorithms in extracting vessel data from these images for further analysis. Five segmentation algorithms were applied to three MRA images (one control, one anemic, and one SCD patient) and performance was measured against manually segmented ground truth data. We found that automatic segmentation performs better in anemic and SCD patients over healthy controls.
Introduction
Sickle Cell Disease (SCD) is associated with altered cerebral blood flow due to chronic anemia, recurrent ischemic and reperfusion injuries, and pathological neovascularization. These adaptations manifest as morphological abnormalities in vasculature1 that can be studied using time-of-flight magnetic resonance angiography (MRA), which creates contrast in vessels with faster-moving blood traveling perpendicular to the imaging plane.2 However once obtained, these images are not trivial to analyze. Radiological reviews of the images typically identify focal pathologies in large vessels, such as stenosis or aneurysms. Computer-aided methods can analyze the entire vasculature but require segmentation of the vessels and must overcome significant variation in vessel voxel intensity as vessel diameter and flow vector change. Because we would like to deploy vascular analysis tools to understand chronic anemia and SCD vasculopathies, we must first understand the accuracy of computational vessel segmentation methods in these patients.Methods
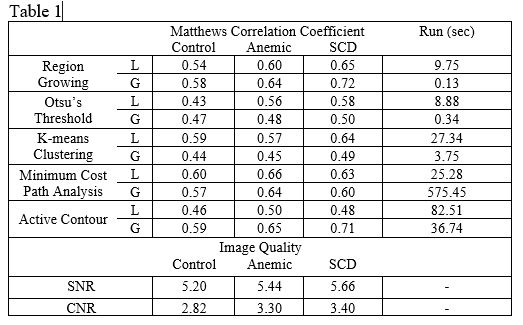
The Committee on Clinical Investigation at Children’s Hospital Los Angeles (CHLA) approved the protocol; written informed consent and/or assent were obtained from all subjects (CCI#2011-0083). MRA images for one normal control, one anemic, and one sickle cell disease patient were collected from the larger study. Each subject underwent an MRI study using a 3T Philips Achieva with an 8-element phased-array coil. For each subject, T1- and T2-weighted 3D image, and MR angiography images were acquired with the following parameters: TR = 23ms, TE = 3.45ms, flip angle = 18°, FOV = 220mm × 220mm, resolution = 0.38mm × 0.38mm and slice thickness = 1.4mm. Ground truth data was generated by manually segmenting vessels in five transverse slices in each patient. Vessel voxel classification involved a subjective determination based on all available information including intensity, location, surrounding voxel intensity, local morphology, and a neuroanatomical atlas. Afterward, each dataset was automatically segmented in MATLAB (Mathworks, Natick MA) with five different algorithms: (a) Otsu’s method thresholding, (b) K-means clustering, (c) static threshold region growing, (d) a modification of the minimum cost analysis algorithm proposed by Yi et al.,3 and (e) active contours. Each algorithm was applied globally to the entire imaging volume and locally using vessel-tracing techniques from Yi et al.3 The performance of each segmentation was quantified via Matthews correlation coefficient, which produces a balanced measure of binary classification quality despite a large difference between the number of vessel and non-vessel voxels in our images. Matthews correlation coefficients range from 1 (perfect classification) through 0 (random guessing), to -1 (perfect disagreement).Results
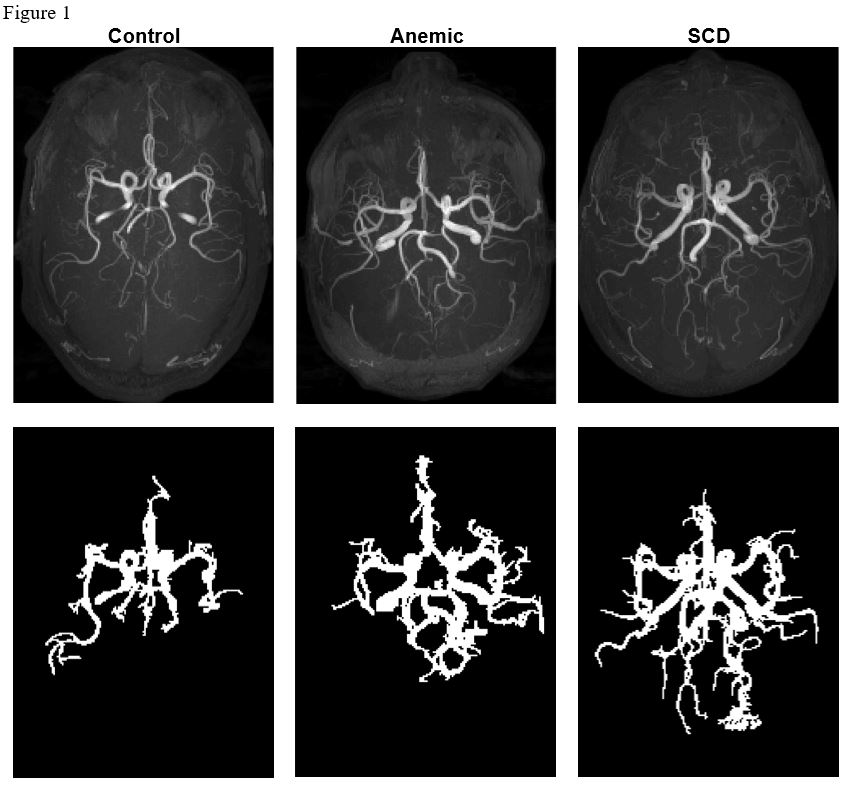
Axial maximum intensity projections for each patient are shown in Figure 1. These patients were representative of their respective cohorts. Image quality and algorithm performance metrics can be found in Table 1. Otsu’s threshold, K-means clustering, and minimum cost path performed better when restricted to local analysis while region growing and active contour worked better in global analysis. The computationally fastest method overall was global region growing, followed by global Otsu’s thresholding and global K-means clustering (0.13, 0.34 and 3.75 sec respectively). The most accurate methods were global active contouring, followed by global region growing, and local minimum path cost analysis (mean Matthew’s correlations of 0.65, 0.65 and 0.63 respectively). Signal to noise and contrast to noise were both highest in SCD, and lowest in healthy controls.Discussion
All algorithms performed significantly better than random guessing but did not approach manual segmentation. Signal-to-noise and contrast-to-noise values were highest in SCD, and anemic patients, hence segmentation should be more accurate in these patients than controls. We speculate that this is due to a known correlation between anemia and higher velocity, increasing signal in time-of-flight angiography. Since the global region growing algorithm inherently traces the vessel, decreased local performance in this algorithm indicates error in following the vessel that likely impacted all localized segmentations. Nevertheless, Otsu’s threshold, K-means, and minimum cost path still favor localized segmentation. Active contour has inherent localization and likely performs worse locally because contours are disrupted in each vessel-tracing step. Performance is defined here by volumetric agreement but since we are ultimately interested in developing a vessel skeleton, captured vessel path length may be a better measure. As we continue to process the segmentation data to extract useful conclusions about angiography in this cohort, we will gain further insight into how to best segment and analyze the images.Conclusion
Automatic segmentation performs better in anemic and SCD patients over controls. We speculate that this was a result of the better image signal and contrast that occur in patients with higher velocities.Acknowledgements
No acknowledgement found.References
1. L.H Pecker and H.C. Ackerman, “Cardiovascular Adaptations to Anemia and the Vascular Endothelium in Sickle Cell Disease Pathophysiology,” in Sickle Cell Anemia: From Basic Science to Clinical Practice. Cham: Springer, 2016, pp.129-175.
2. F. R. Korosec, “Basic Principles of Phase-contrast, Time-of-flight, and Contrast-enhanced MR Angiography,” Principles of MR Angiography, pp. 1–10, 1999.
3. J. Yi and J. B. Ra, “A locally adaptive region growing algorithm for vascular segmentation,” Int J Imag Syst Tech, vol. 13, no. 4, pp. 208–214, 2003.
Figures