4725
Rapid virtually automated technique for renal corticomedullary segmentation from volumetric arterial phase imaging: Initial experience1Radiology, Austin Health, Heidelberg, Australia, 2Austin Health, Heidelberg, Australia, 3Florey Institute of Neuroscience and Mental Health, Heidelberg, Australia, 4Radiology, New York University, New York, NY, United States, 5New York University, New York, NY, United States
Synopsis
Efficient, reproducible and accurate corticomedullary renal segmentation is challenging but important for MR renography and disease monitoring. We assessed segmentation time, reproducibility and accuracy of a virtually automated (VA) approach (<5 second user interaction), compared to gold standard (GS) manual segmentation. Segmentation time per subject (n=11) was 78.6±7.0s for VA and 60-120min for GS. VA intra- and inter-rater agreement was near perfect for cortex, medullary and whole kidney segmentation (concordance correlation coefficient all ≥0.99), with excellent concordance with GS segmentation (CCC all >0.80). VA is a rapid, accurate and highly reproducible corticomedullary segmentation tool which has promising clinical potential.
Introduction
Accurate, reproducible and efficient corticomedullary segmentation is challenging but important for MR renography and monitoring of kidney disease1-5. The aim of our study was to assess the reproducibility and accuracy of a rapid virtually automated (VA) approach with minimal user-dependence. Manual segmentation was used as the gold standard.Methods
The VA kidney segmentation algorithm from arterial phase volumetric images refines an earlier “blanket segmentation” algorithm3. It is designed for minimal (<5 sec) user interaction and is otherwise fully automatic.
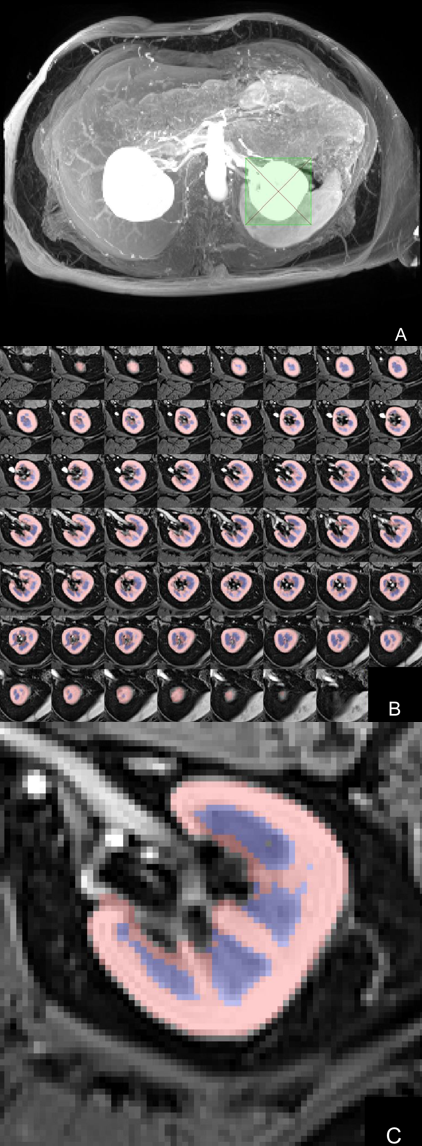
The segmentation is performed separately on each kidney in a locally developed C++ program. The user places a bounding rectangle encompassing the kidney (Figure 1) on a Maximum Intensity Projection (MIP) image, removing the need for slice selection and maximising inter-observer agreement. A single keystroke activates a fully automatic segmentation:
- The bounding rectangle is extended through all slices in the z-direction to form a rectangular prism.
- 2D Locally Adaptive Thresholding (LAT)6 is performed to extract thin locally bright binary ROIs on each slice of the prism.
- The integral of signal intensity is calculated over these ROIs. The slice with the greatest total is designated the Central slice and a 3D Kidney Bounding Box (BB) is subsequently generated by extending the Central slice in the z-axis by 100mm in both directions.
- Non-uniformity correction using a BiCal algorithm7 and conversion of BB to isotropic voxels is performed, yielding a volume (V) for subsequent processing.
- Thin bright ridges are detected on the Central slice to obtain a binary 2D ROI, from which the maximum connected component is extracted. This step yields the Cortex Seed ROI, with mean signal intensity (CSS).
- A 3D LAT operation is then performed over the entire V to define a new region that serves as input to the Edgewave algorithm8 (lower threshold = 0.75*CSS). 3D convex hull operator then yields the Blanket ROI. Whole kidney ROI (WK) is then produced using an Edgewave algorithm with a lower threshold of 0.5*CSS.
- LAT is applied over WK to produce the Cortex mask. Medulla mask is produced from remaining WK voxels. In the final step, any WK surface voxels designated as Medulla are reassigned to Cortex.
7 healthy volunteers and 4 diabetic patients (8F, 3M, mean 53y, range 27-77y) were prospectively imaged at 3T (Skyra, Siemens). Dixon volume interpolated breath-hold examination was performed axially after a second injection of 5ml gadoteric acid (Dotarem), with a prior injection for DCE imaging: TR 3.97 ms, TE 1.26 (out of phase) and 2.49 (in phase) ms, FA 9o, FOV 400 x 325 x 320 mm, true voxel size 1.3 x 1.7 x 4.0 mm3 interpolated to 1.3 x 1.3 x 2.0 mm3, acceleration factor 4 (CAIPIRINHA), TA 14s.
Two raters (R1 and R2) performed VA segmentation on the water-only arterial phase images, with R1 repeating all segmentations. Segmentation time per subject was recorded.
An experienced abdominal radiologist performed gold standard (GS) manual segmentation in all subjects. Inter- and intra-rater agreement and concordance with GS of cortical (C), medullary (M) and whole kidney (WK) volumes were assessed with Lin’s concordance correlation coefficients and reduced major axis regression9.
Results
Segmentation was completed in 11/11 subjects (22 kidneys) in 78.6±7.0s for VA compared to 60-120min for manual segmentation per subject. Mean±SD GS volumes were: 95.01±14.15cm3 for C, 49.53±11.34cm3 for M and 144.53±24.31cm3 for WK.
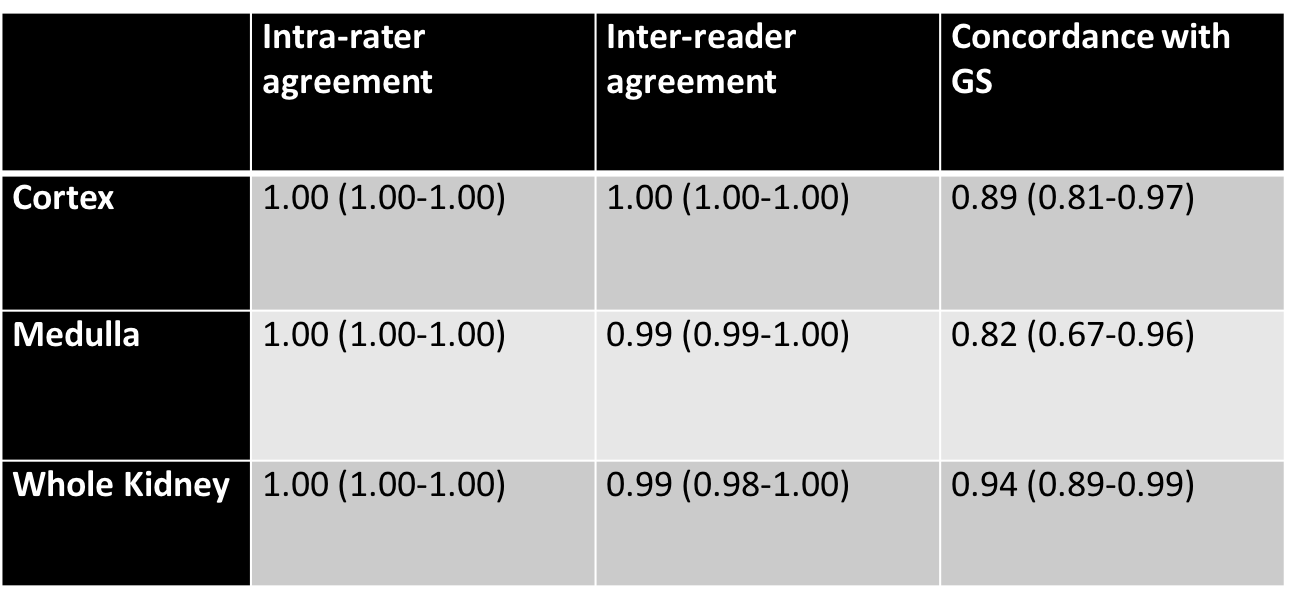
VA intra-rater agreement for C, M and WK was perfect (all 1.00), with excellent inter-rater (all ≥0.99) agreement. Concordance with GS was excellent for C (0.89), M (0.82) and WK (0.94) (Table 1).
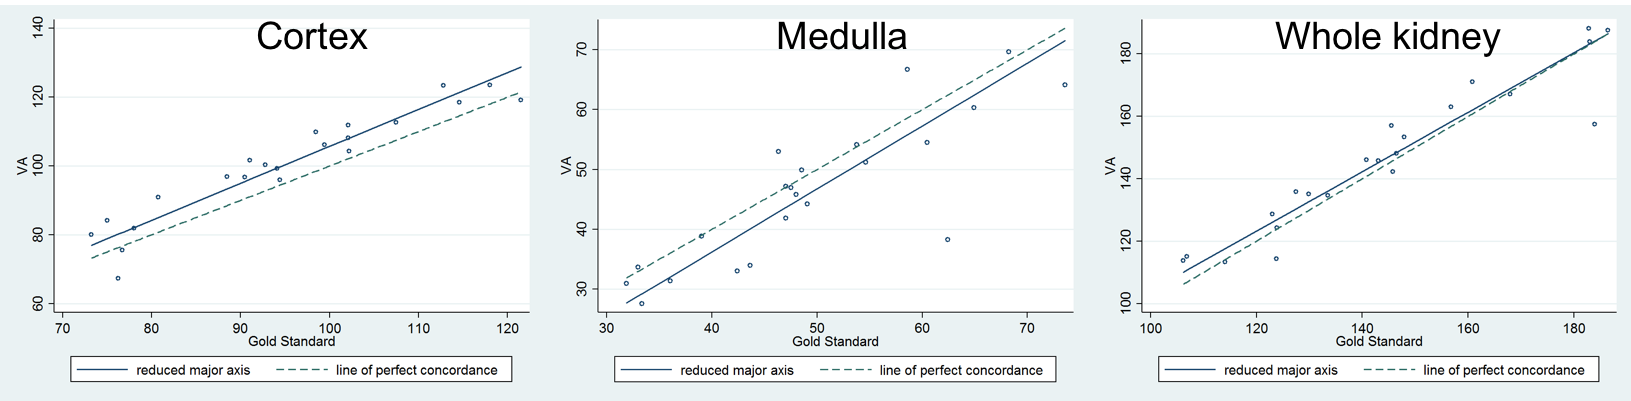
Reduced major axis regression (Figure 2) demonstrated mild overestimation of C (mean 5ml), underestimation of M (mean 3ml), and overestimation of WK (mean 2ml). Inclusion of portions of the contrast-filled collecting system in the cortical segmentation, large cysts (n=1 kidney) and paucity of perirenal fat (n=2 kidneys) contributed to discrepancies between VA and GS segmentation.
Discussion/Conclusion
We have demonstrated that a virtually automated technique is capable of rapid, accurate (within 7% of GS) and highly reproducible corticomedullary segmentation. A small fixed bias is present, with mild overestimation of cortical and underestimation of medullary volumes. Accuracy was impacted by segmentation of the contrast-filled collecting system, presence of large cysts and paucity of perirenal fat. Further work to refine the algorithm, including rejecting the collecting system, is underway. It has promising clinical potential for disease monitoring and as part of MR renography workflow.Acknowledgements
This work was supported by funding from the Royal Australian and New Zealand College of Radiologists.References
- Zollner FG, Svarstad E, Munthe-Kaas AZ, et al. Assessment of kidney volumes from MRI: acquisition and segmentation techniques. AJR Am J Roentgenol. 2012;199(5):1060-9.
- Grenier N, Merville P, Combe C, et al. Radiologic imaging of the renal parenchyma structure and function. Nat Rev Nephrol. 2016;12(6):348-59.
- Rusinek H, Lim JC, Wake N, et al. A semi-automated “blanket” method for renal segmentation from non-contrast T1-weighted MR images. MAGMA. 2016;29(2):197-206.
- Will S, Martirosian P, Wurslin C, et al. Automated segmentation and volumetric analysis of renal cortex, medulla, and pelvis based on non-contrast-enhanced T1- and T2- weighted MR images. MAGMA. 2014;27(5):445-54.
- Cheong B, Muthupillai R, Rubin MF, et al. Normal values for renal length and volume as measured by MRI. Clin J Am Soc Nephrol. 2007;2(1):38-45.
- Kramme R, Hoffmann KP, Pozos RS. Springer handbook of medical technology, 1st edition. Titisee, Germany: Springer Science & Business Media;2011. 1497 p.
- Mikheev A, Rusinek H, Wiggins G. Non-uniformity normalisation using 3D canny edges and legendre polynomial approximation of the bias field: Validation on 7T T1W brain images. Proc Int Soc Magn Reson Med. 2013;2695.
- Mikheev A, Nevsky G, Govindan S, et al. Fully automatic segmentation of the brain from T1-weighted MRI using Bridge Burner algorithm. J Magn Reson Imaging. 2008;27(6):1235-41.
- Ludbrook J. Statistical techniques for comparing measurers and methods of measurement: a critical review. Clin Exp Pharmacol Physiol. 2002;29(7):527-36
Figures