4713
Exploration on deep-learning based sorting of k-space data for ECG-free cardiac cine-MRI1TU Eindhoven, Delft, Netherlands, 2UMC Utrecht, Utrecht, Netherlands, 3TU Eindhoven, Eindhoven, Netherlands
Synopsis
Cine-cardiac MRI reconstruction relies on the ECG signal to sort k-space data. However, ECG triggering comes with disadvantages among which increased setup time. Here we suggest an alternative method of sorting cine MRI k-space data using deep-learning. An explorative study has been performed using an encoder-decoder network with Sinkhorn layer to sort k-space data that was randomly disordered in one spatial dimension. Good reconstructions were obtained using a group size of 8 or more k-space lines during randomization. These results hold promise for subsequent application in the time dimension.
Introduction
Cardiac cine-MRI conventionally relies on ECG-triggering to sort the acquired k-space lines over a range of heart phases (e.g. 30). However, ECG triggering has some disadvantages: there is increase in lead time due to equipping of the apparatus, there can be interference with the MR signal1, 2 , by gradient switching, or a magneto-hydrodynamic effect. Besides these technical complications, certain patients are not fit for an ECG, e.g. fetal heart3 , or heart arrhythmia4 . Previous work has focused on novel gating techniques, in which they modelled the RR interval by analysing the k-space data5 , by providing a new echo sequence6 , or by using the vector-cardiogram7 . However, these models for the RR interval provide no generic solution to the problem of movement in MR imaging. We suggest a novel approach to sort cine-MRI k-space data using deep-learning. In this work the feasibility of such method is explored by training a network to sort k-space data that has been randomly disordered to various degrees. Although the primary foreseen application will be in cardiac imaging, also MRI on other moving imaging targets may benefit from this procedure.Method
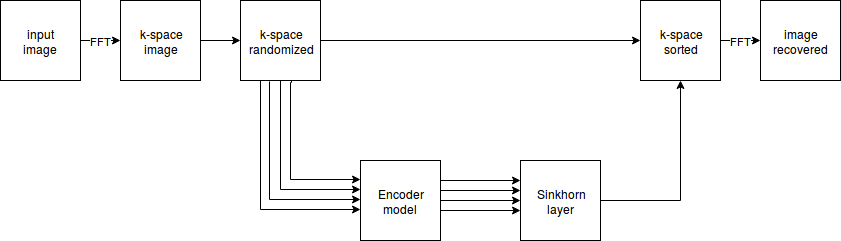
In the conventional setting, given a volume of the heart, the data at hand will be two or three dimensional plus a time dimension.The k-space lines that are acquired by the MRI system are randomly distributed across the time dimension and afterwards corrected via the ECG signal, or by a(n) (self-gating) algorithm. They key idea in the deep-learning approach is to learn howto sort the randomized data such that it can be reconstructed retrospectively. This task of learning can be performed on 3Dplus time data and 2D plus time data to mimic a realistic setting. In this work, we start with a simplified problem: to sort two dimensional k-space data, which is randomized on a spatial axis. We assume that the architecture which can successfully tackle this simplified problem, is also able to handle the situation with a time dimension. Inspired by the problem defined by Noroozi et al.8 , and understanding the structure of U-Net9 , we developed a model with an encoding layer based on VGG10 and a decoding layer based on the Sinkhorn operation11. An outline of this model is presented in Figure 1. Encoding models based on fully connected, convolution, and (max)pooling layers have been tested, where a combination of convolution and (max)pooling was the most successful. In addition, also a U-Net was tested to address the same problem. Here the encoding-decoding mechanism is already build in.From the MICCAI 2017 we obtain cardiac data from 100 patients and extracted around 250 images, where the train-test split is the conventional 70-30 ratio. Since we are dealing with complex k-space data, we train multiple models that use either the real-, or complex-part, the absolute value, or the argument of the complex number. Normalization of the data was based onsubtracting the mean and division by the standard deviation. The Adam optimizer12 was used with a base learning rate around 7e−5, with a cyclic variation of max 3e−4. The loss function was based on the mean squared error.Results
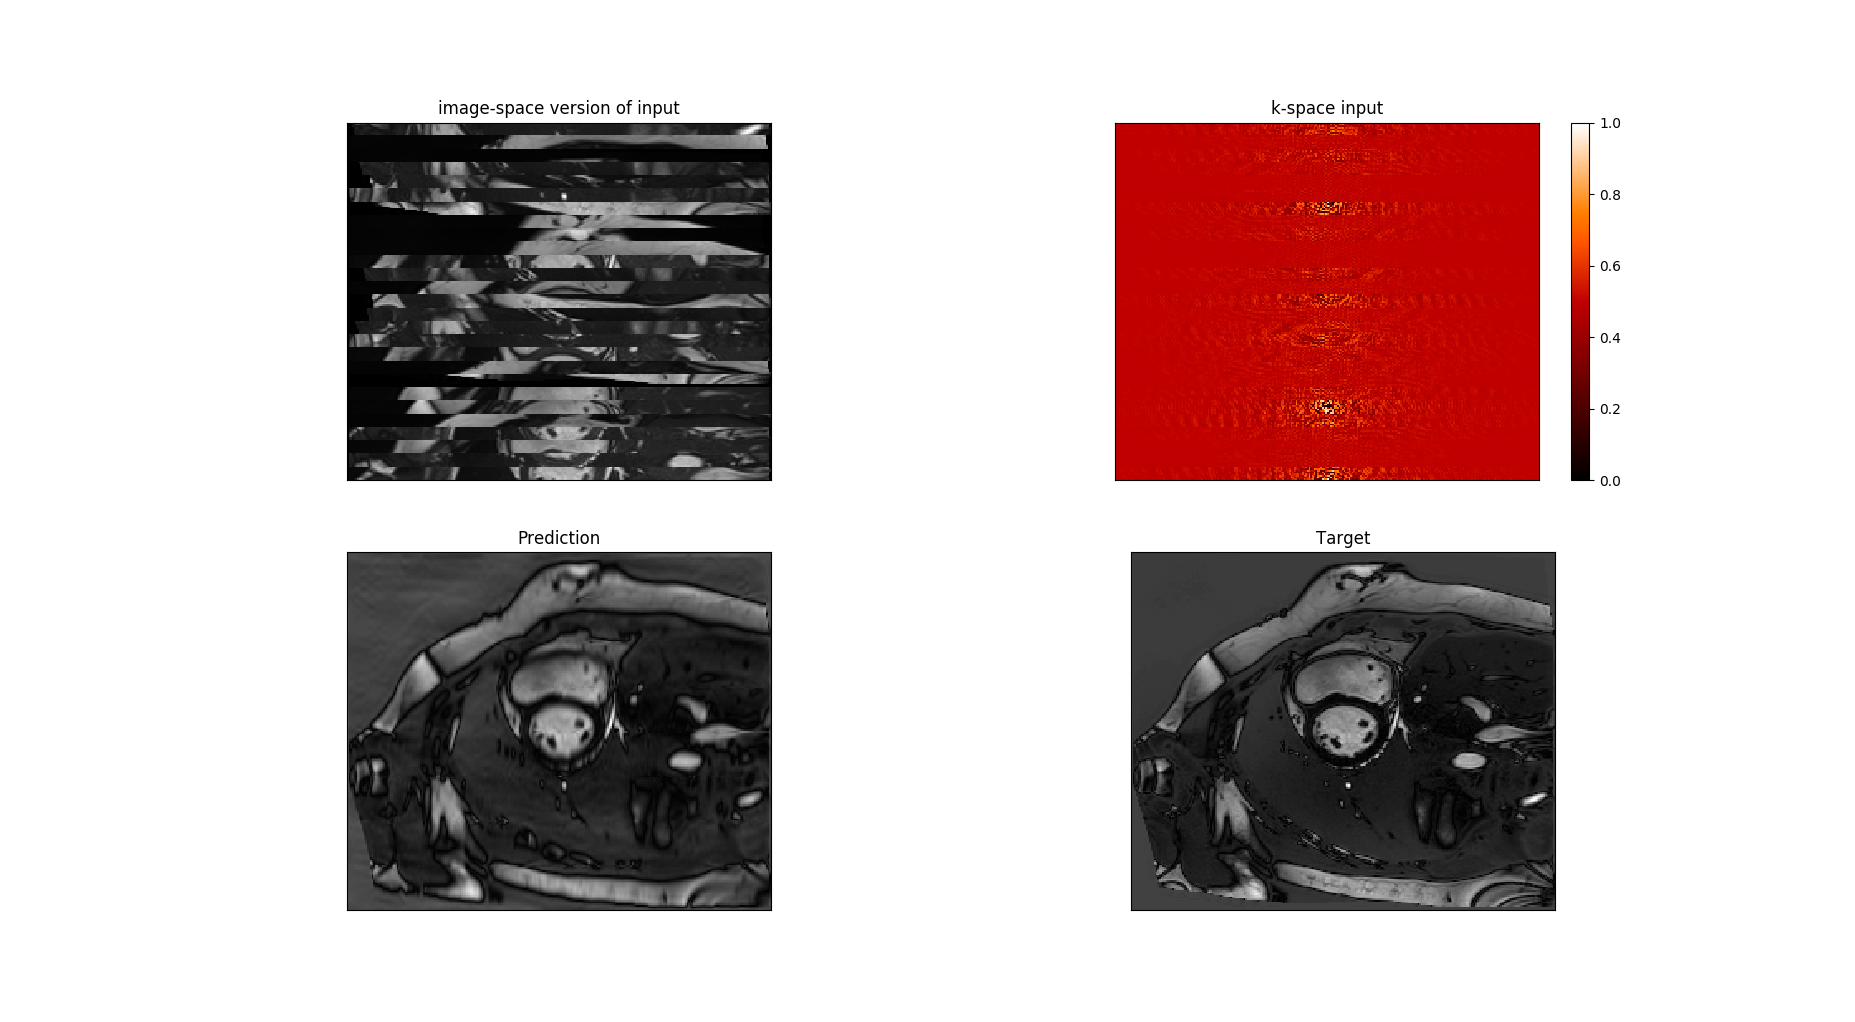
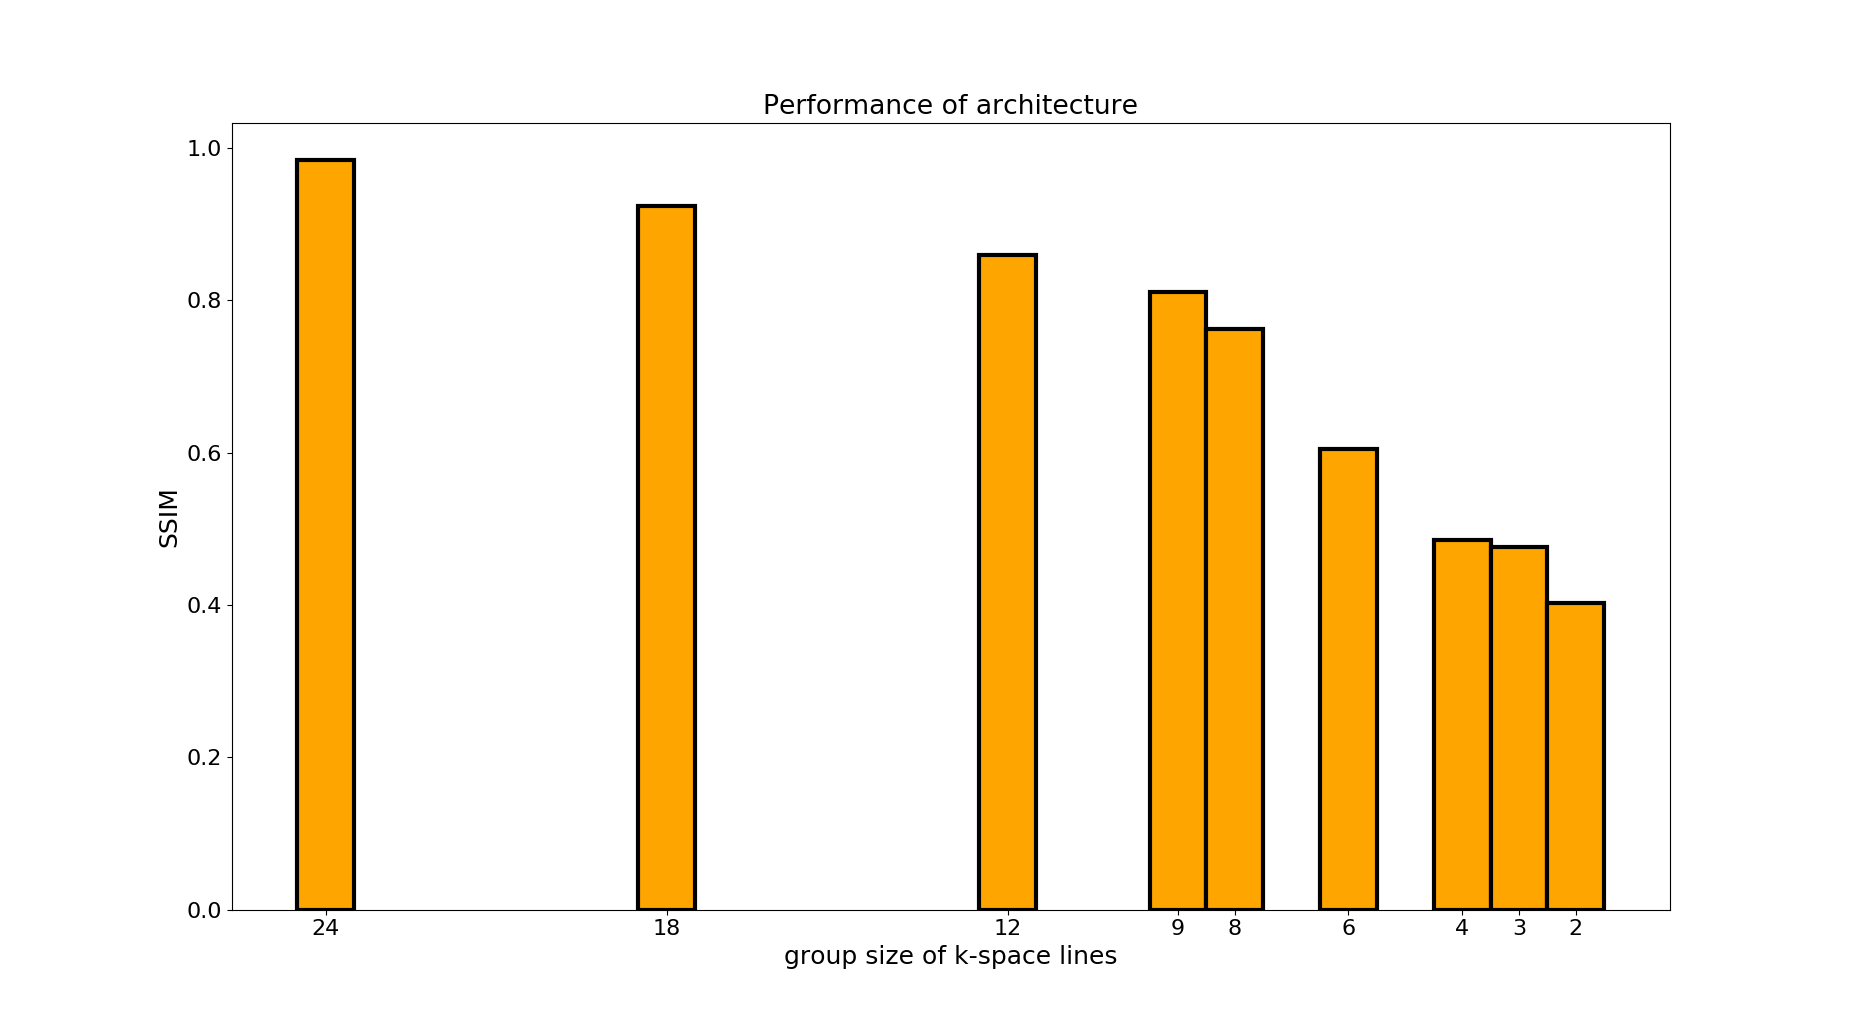
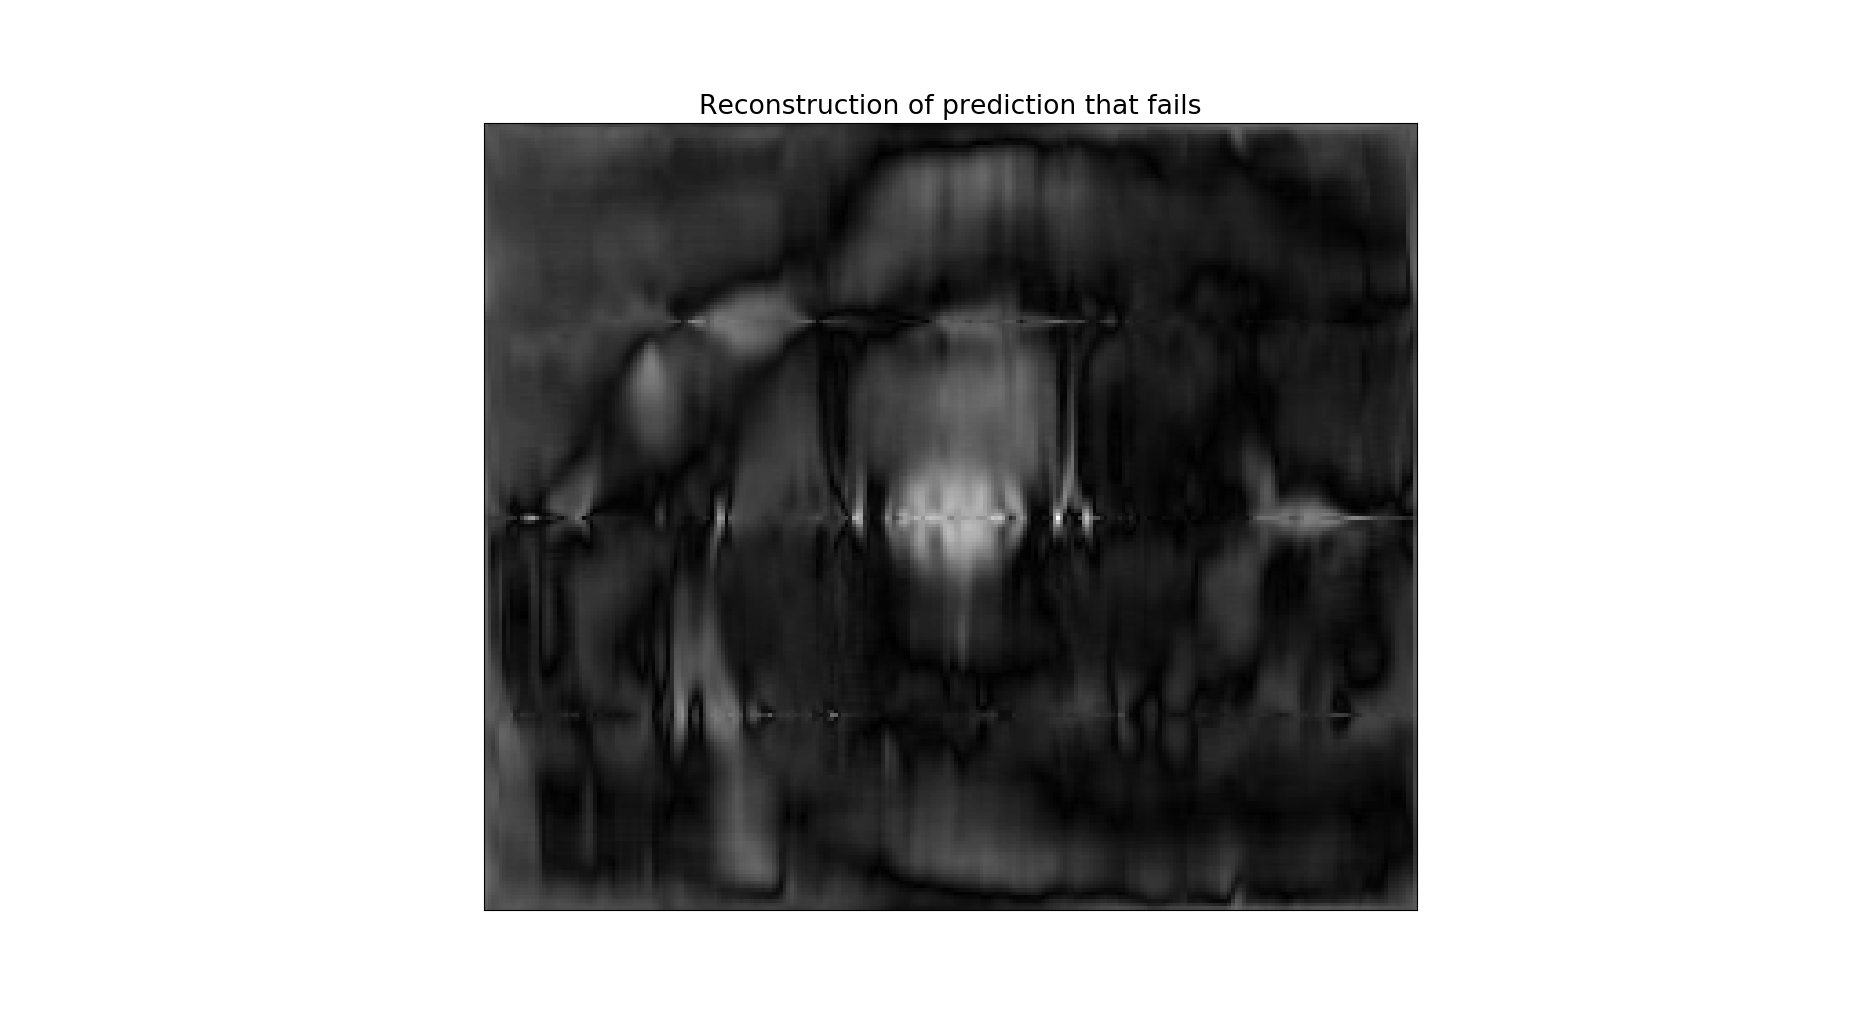
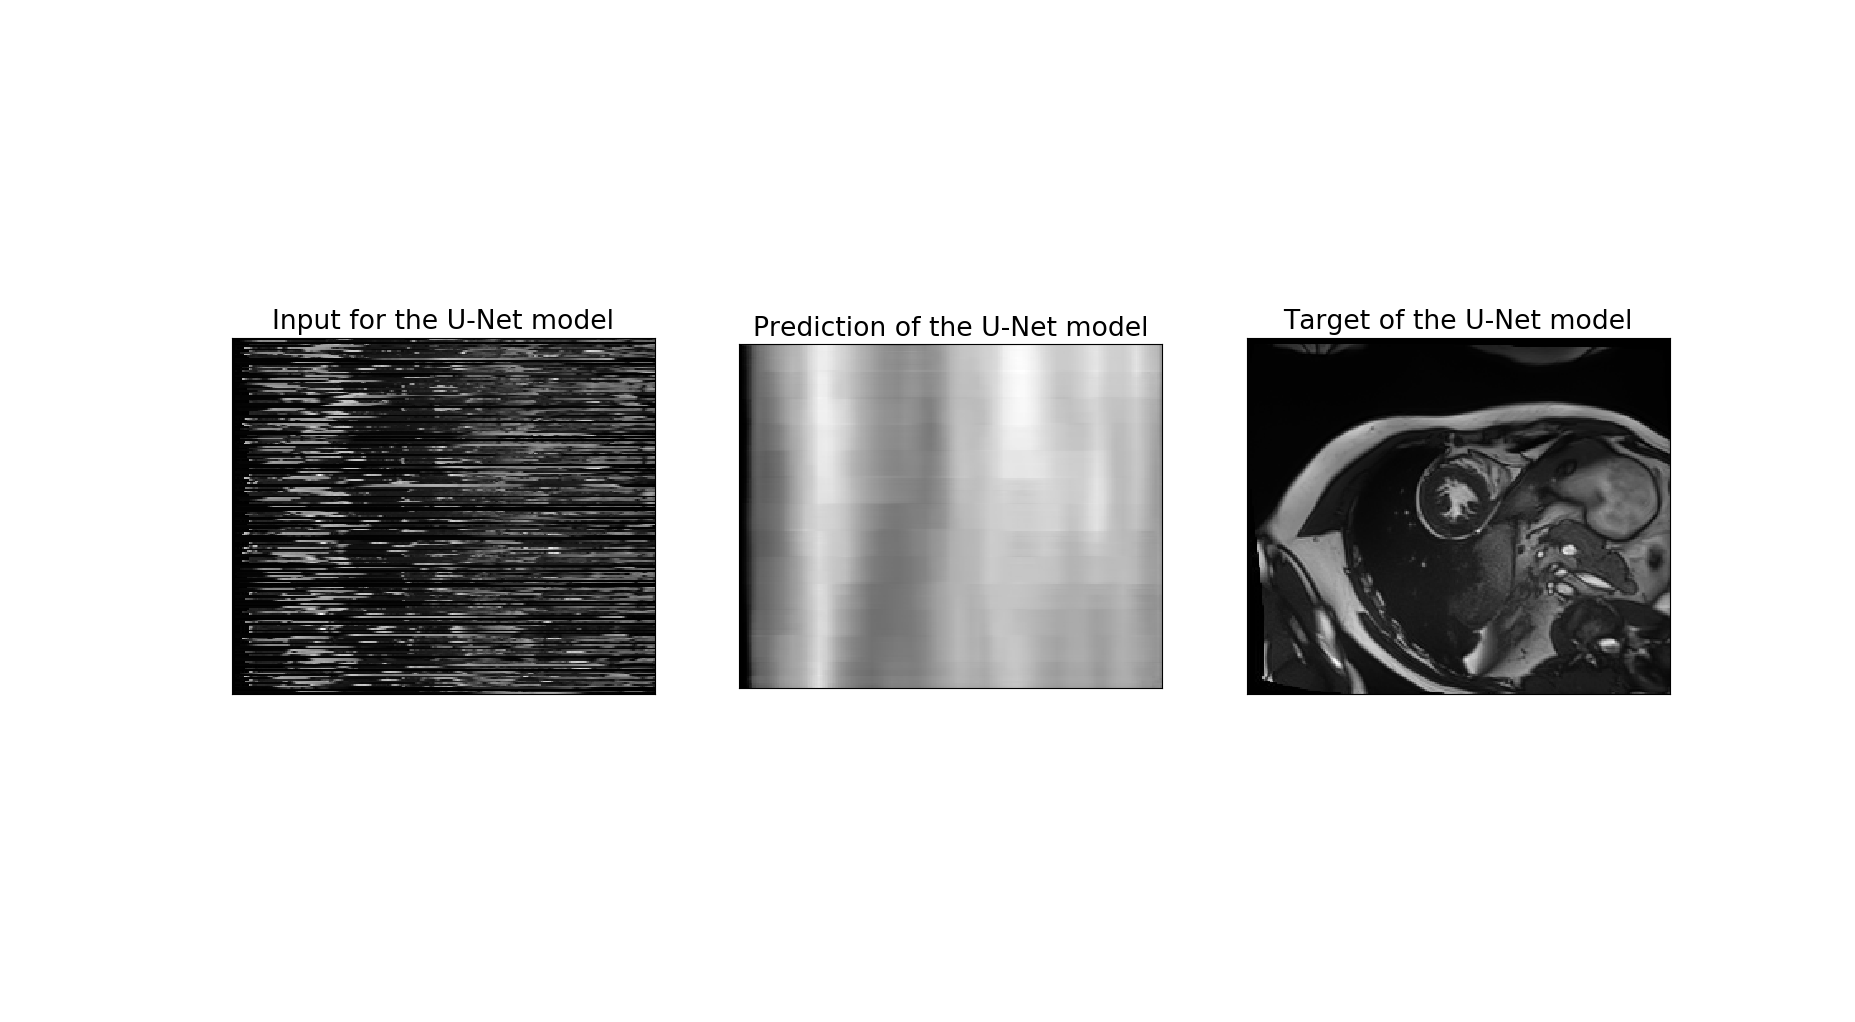
An overview of the model results can be viewed in Figure 2, which shows the outcome when groups of 8 k-space lines are being randomized. The performance of the re-ordering still heavily depends on the degree of randomization. If the k-space is grouped in subsets of 6 or less k-space lines, which are subsequently shuffled, the reconstruction fails. This is visualized by Figure 3,which shows the Structural Similarity Index (SSIM) 13 between the predicted and the target image when decreasing the group size. This value ranges in theory from -1 to 1, where a value of 1 is given to two identical images. An example of an actually failed reconstructed image is given in Figure 4, notable is the symmetry in the solution. In addition, Figure 5 displays the odd performance of the U-Net architecture. Based on those results, it does not seem a proper architecture for this type of problem.Discussion and conclusion
The results show that a model is able to reconstruct images from randomly disordered k-space data of cardiac MR images. Good reconstructions are obtained if the k-space data is divided in groups of minimum 8 k-space lines that are subsequently shuffled.Further improvements are expected on the encoding mechanism that has been used, which should enable better performance for smaller group sizes. For now the given data is randomized along one of the spatial axes, but the results that have been achieved hold promise for subsequent application in the time domain.Acknowledgements
No acknowledgement found.References
1. Damji, A. A., Snyder, R. E., Ellinger, D. C., Witkowski, F. X. & Allen, P. S. RF interference suppression in a cardiacsynchronization system operating in a high magnetic field NMR imaging system. Magn Reson. Imaging 6, 637–640 (1988).
2. Rokey, R., Wendt, R. E. & Johnston, D. L. Monitoring of acutely ill patients during nuclear magnetic resonance imaging:use of a time-varying filter electrocardiographic gating device to reduce gradient artifacts. Magn Reson. Med 6, 240–245(1988).
3. Wielandner, A., Mlczoch, E., Prayer, D. & Berger-Kulemann, V. Potential of magnetic resonance for imaging the fetalheart. Semin Fetal Neonatal Med 18, 286–297 (2013).
4. Nacif, M. S. et al. Cardiac magnetic resonance imaging and its electrocardiographs (ECG): tips and tricks. Int J Cardiovasc.Imaging 28, 1465–1475 (2012).
5. Buehrer, M., Curcic, J., Boesiger, P. & Kozerke, S. Prospective self-gating for simultaneous compensation of cardiac andrespiratory motion. Magn Reson. Med 60, 683–690 (2008).
6. Crowe, M. E. et al. Automated rectilinear self-gated cardiac cine imaging. Magn Reson. Med 52, 782–788 (2004).
7. Fischer, S. E., Wickline, S. A. & Lorenz, C. H. Novel real-time R-wave detection algorithm based on the vectorcardiogramfor accurate gated magnetic resonance acquisitions. Magn Reson. Med 42, 361–370 (1999).
8. Noroozi, M. & Favaro, P. Unsupervised learning of visual representations by solving jigsaw puzzles. CoRR abs/1603.09246(2016). 1603.09246.
9. Ronneberger, O., Fischer, P. & Brox, T. U-net: Convolutional networks for biomedical image segmentation. CoRRabs/1505.04597 (2015). 1505.04597.
10. Simonyan, K. & Zisserman, A. Very deep convolutional networks for large-scale image recognition. CoRR abs/1409.1556(2014). 1409.1556.
11. Mena, G., Belanger, D., Linderman, S. & Snoek, J. Learning Latent Permutations with Gumbel-Sinkhorn Networks. ArXive-prints (2018). 1802.08665.
12. Kingma, D. P. & Ba, J. Adam: A Method for Stochastic Optimization. ArXiv e-prints (2014). 1412.6980.
13. Wang, Z., Bovik, A. C., Sheikh, H. R. & Simoncelli, E. P. Image quality assessment: From error visibility to structuralsimilarity. Trans. Img. Proc. 13, 600–612, DOI: 10.1109/TIP.2003.819861 (2004).
Figures