4701
Deep Learning Based Adaptive Noise Reduction in Multi-Contrast MR Images1MRI System Division, Canon Medical Systems Corporation, Otawara-shi, Japan, 2Corporate Research and Development Center, Toshiba Corporation, Kawasaki-shi, Japan, 3Department of Diagnostic Radiology, Faculty of Life Sciences, Kumamoto University, Kumamoto-shi, Japan
Synopsis
We have proposed a deep learning-based approach for MR image denoising that can adapt to the input noise power. We compare the performance of the proposed denoise approach with Deep Learning based Reconstruction (dDLR) method with state-of-the art image denoising method called Block-matching and 3D filtering method (BM3D) on multiple contrast MR images. Our experiments demonstrate that the proposed method outperforms the state-of-the art BM3D image denoising method.
Purpose
Images with high-spatial resolution are extremely desirable in medical imaging. However, MRI inherently suffers from a trade-off between image resolution, scan duration, and SNR. In this work, we propose a denoise approach with Deep Learning based Reconstruction (dDLR) method which improves SNR in high-resolution MR images without additional scan time. We compare the performance of the proposed dDLR method with state-of-the art image denoising method called Block-matching and 3D filtering method (BM3D) 1.Materials and Methods
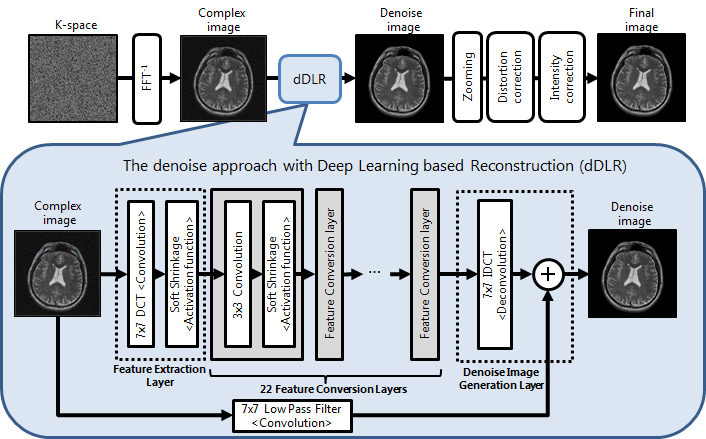
Our newly developed noise reduction method is based on deep-CNN using soft shrinkage as activation function. The soft shrinkage aims to provide noise level adaptive denoising with a single CNN without the need to train a unique CNN for each noise level 2. Our deep-CNN architecture has two paths (Figure 1), one with feature extraction and multiple feature conversion layers and the other with a convolution layer of low-pass filter. In the feature extraction layer, the convolution with discrete cosine transform (DCT) and the soft shrinkage activation function are applied to the input noisy image. The 7x7 DCT generates 48 channels of feature maps. In the feature conversion layers, the convolution and the soft shrinkage activation function are repeatedly applied to the 48 channels of feature maps. The kernel size of convolution layers is 3 x 3. The number of the feature conversion layers was set to 22. Finally, in the image generation layer the denoised image is generated by deconvolution with a 7 x 7 inverse DCT kernel followed by addition with the low pass filtered image from the other path. For training, we acquired images from eight exams that contain 150 head and knee images from healthy volunteers using T1WI, T2WI, fluid-attenuated inversion recovery (FLAIR), T2*WI, and PD-WI protocols. Each protocol used 10 averaging repetitions. The ground truth images were generated by in-plane image registration followed by averaging of the 10 images. Noisy input images were generated by adding Gaussian noise, between 0-20% of the maximum image intensity, to the 10-averaged images. Training data was augmented through horizontal and vertical flipping. Finally, each training image was divided into nine patches, to obtain 32,400 training pairs. Validation loss was computed during training on six exams that contained 110 images of brain and knee. Testing was performed on five brain data sets from one healthy volunteer acquired with 10 averages. And noisy images were generated by adding Gaussian noise, between 1-10% of the maximum image intensity. All training, validation and test images were acquired on a 3-T clinical MRI scanner (Vantage Galan 3T ZGO, Canon Medical Systems Corporation).Block-matching and 3D filtering method (BM3D) which is a state-of-the art denoising method was compared with dDLR. Two quantitative metrics were used to evaluate denoising performance. Peak-signal-to-noise ratio (PSNR) and structure similarity index measure (SSIM) with reference to the 10-averaged image were averaged across all slices of each contrast. Statistical analysis was performed on the two metrics between BM3D and dDLR using the paired sample t-test.
Results and Discussion
Table 2 and Figure 2 summarize PSNR and SSIM for each noise level and denoising method on T1WI, T2WI and FLAIR. In all images, across all noise levels from 1% to 10%, dDLR produced higher PSNR and SSIM values than BM3D. At lower noise levels, dDLR and BM3D provided similar PSNR and SSIM values. However, the performance of dDLR unambiguously improved with increasing noise levels in all contrast images. In T1WI with 10% noise, after denoising the PSNR values improved from 19.99 in the base image to 30.78 in BM3D and to 31.21 in dDLR. Similarly, the SSIM improved from 0.27 to 0.85 in BM3D and to 0.87 in dDLR. In T2W images with 10% noise, the PSNR value increased from 20 to 30.31 in BM3D and to 30.77 in dDLR. Similar trends were observed in the FLAIR. It should be noted that even though quantitatively the PSNR and SSIM values from dDLR were not significantly different from BM3D, visually dDLR images were interpreted to be of higher diagnostic quality compared to BM3D. Two radiologists assessed that even though both BM3D and dDLR significantly reduce image noise, dDLR preserved structures in temporal lobe and cerebellum than BM3D, as shown in Figure 3. The quantitative improvements obtained with dDLR are of similar scale as reported by the popular residual learning based DnCNN 3 image denoising method.Conclusion
We have proposed a deep learning-based approach for MR image denoising that can adapt to the input noise power. Our experiments demonstrate that the proposed method outperforms the state-of-the art BM3D image denoising method.Acknowledgements
We would like to thank Mitsue Miyazaki, Ph.D. of UC San Diego for dedicated supports.
References
1. K. Dabov, A. Foi, V. Katkovnik, and K. Egiazarian, Image denoising by sparse 3D transform-domain collaborative filtering, IEEE Trans. on Image Proc. Vol. 16(8), pp. 2080-2095, 2007.
2. Isogawa K, Ida T, Shiodera T, and Takeguchi T. Deep Shrinkage Convolutional Neural Network for Adaptive Noise Reduction. IEEE Signal Processing Letters Vol. 25(2), pp. 224-228, 2018.
3. Zhang K, Wangmeng Z, Yunjin C, Deyu M, Lei Z, Beyond a Gaussian denoiser: residual learning of deep CNN for image denoising. IEEE Trans. on Image Proc. Vol. 26(7) pp. 3142-3155, 2017.
Figures
CNN Architecture
Our deep-CNN, called dDLR, is implemented after converting k-space to real-space with Inverse FFT. After dDLR processing, the rest of reconstruction process such as zero padding zooming, gradient distortion correction and so on is performed to generate a final reconstructed image. Our deep-CNN architecture has two paths, one with feature extraction and multiple feature conversion layers and the other with a convolution layer of the low-pass filter.
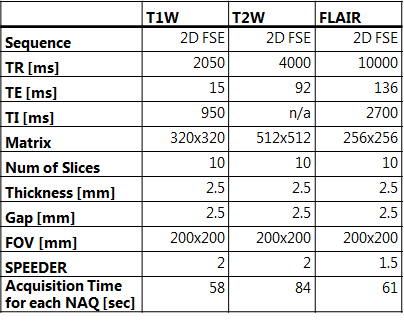
Scan Parameters of Testing Data Sets
For T1W, two-dimensional (2D) fast spin echo (FSE) with inversion recovery; TR/TEeff/TI, 2050/15/950 ms; field of view (FOV), 200x200 mm; matrix, 320x320; slice thickness, 2.5 mm; echo train length (ETL), 6; parallel imaging (SPEEDER), 2; acquisition time, 58 sec for each number of acquisition (NAQ). For T2W, 2D FSE; TR/TEeff, 4000/92 ms; FOV, 200x200 mm; matrix, 512x512; slice thickness, 2.5 mm; ETL 13, SPEEDER, 2; acquisition time, 84 sec. For FLAIR, 2D FSE; TR/TEeff/TI, 10000/136/2700 ms; FOV, 200x200 mm; matrix, 256x256; slice thickness, 2.5 mm; ETL, 29; SPEEDER, 1.5; acquisition time, 61 sec.
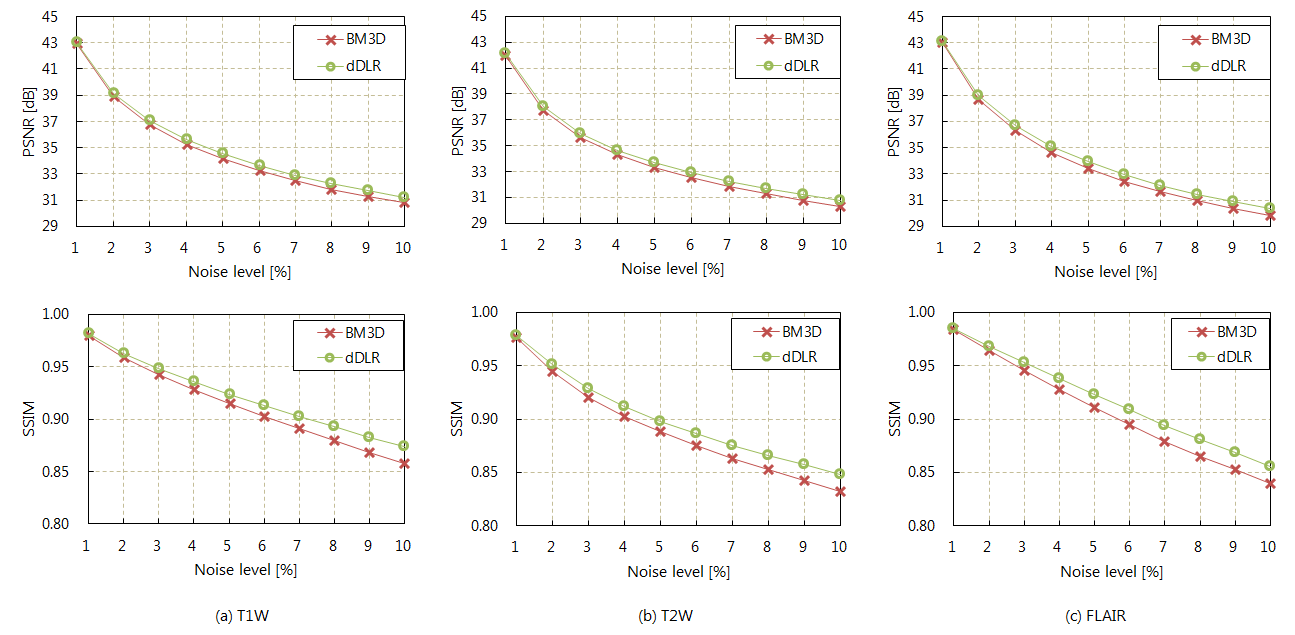
Denoise Performance to Noise Level of each Contrast MR images
(a) T1W, (b) T2W, (c) FLAIR. PSNR and SSIM of each noise level and de-noising method. dDLR: our proposed deep-CNN based method, BM3D: Block-matching and 3D filtering method. Across all noise levels from 1% to 10% on the all contrast images, dDLR produced higher PSNR and SSIM values than BM3D. At lower noise levels, dDLR and BM3D provided similar PSNR and SSIM values; however, the performance of dDLR improved with increasing noise levels.
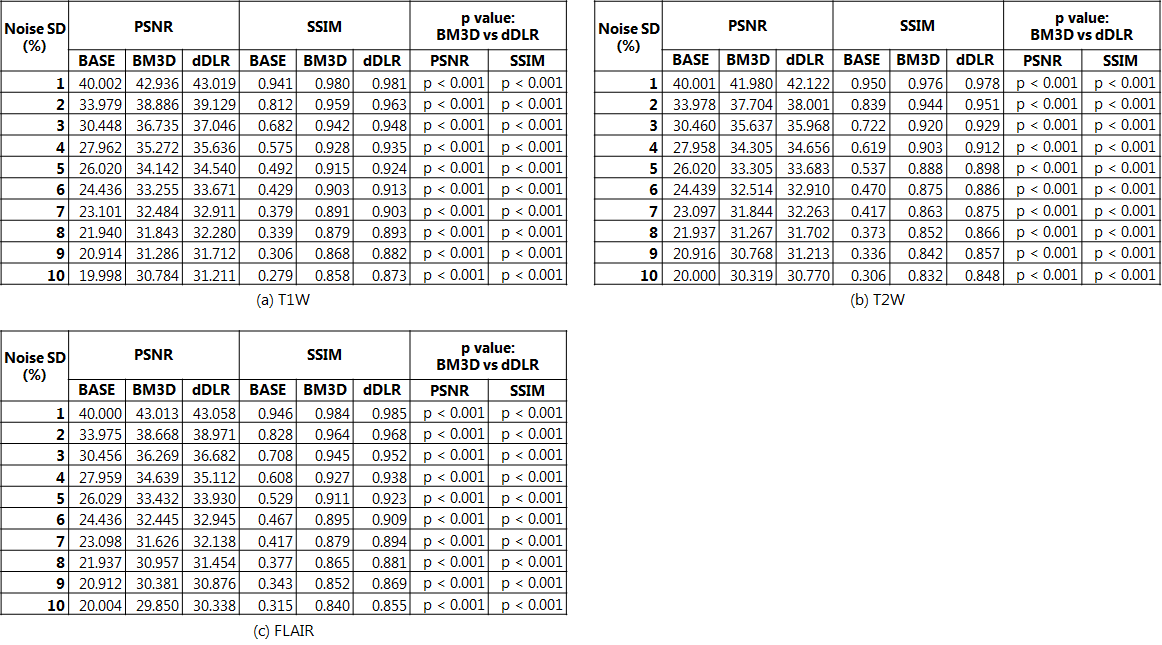
Statistic Analysis of Quantitative Metrics
(a) T1W, (b) T2W, (c) FLAIR. PSNR and SSIM of base, BM3D, and dDLR images with each noise level. dDLR: our proposed deep-CNN based method, BM3D: Block-matching and 3D filtering method. In all images, across all noise levels from 1% to 10%, dDLR produced higher PSNR and SSIM values than BM3D. As results of the paired sample t-test between BM3D and dDLR, the p values are less than 0.001 in all contrast images across all noise levels.
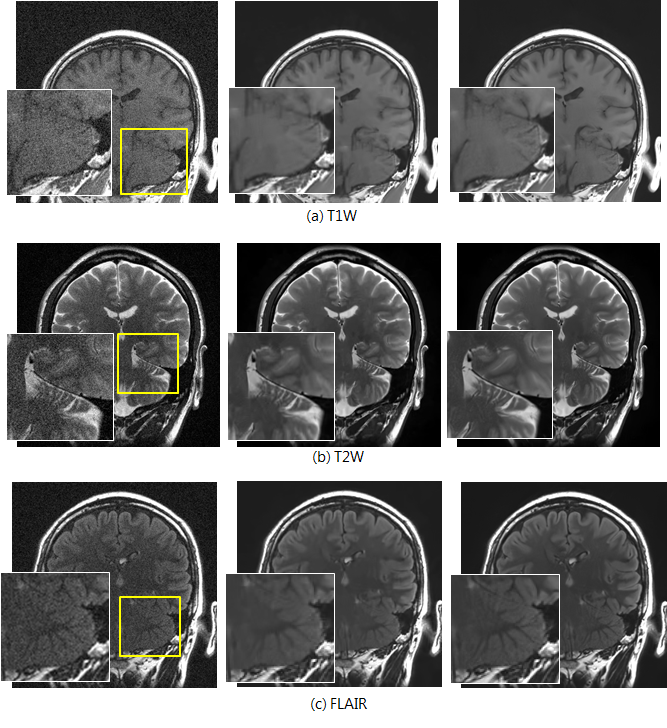
Comparison of Noise Reduction Results
Left: Noisy image, Center: BM3D image, Right: dDLR image. Denoising method is applied to the noisy image whose noise level is 5% in T1W, 7% in T2W and 3% in FLAIR. Two radiologists assessed that dDLR unambiguously preserved intrinsic structures in temporal lobe and cerebellum than BM3D.