4697
Comparison of Quality Assessment Methods for Deep-Learning-Based MR Image Reconstruction1School of Computing, Informatics, and Decision Systems Engineering, Arizona State Univerisity, Tempe, AZ, United States, 2Department of Neurosurgery, Barrow Neurological Institute, St. Joseph’s Hospital and Medical Center, Phoenix, AZ, United States, 3Center for Devices and Radiological Health, US Food and Drug Administration, Silver Spring, MD, United States, 4A. A. Martinos Center for Biomedical Imaging, Massachusetts General Hospital, Charlestown, MA, United States, 5Harvard Medical School, Boston, MA, United States, 6Department of Physics, Harvard University, Cambridge, MA, United States
Synopsis
The proper methodology to perform rigorous quantitative task-based assessment of image quality for deep learning based MR reconstruction methods has not been devised yet. In this study we reconstructed T1-weighted brain images using neural networks trained with five different datasets, and explored the consistency and relationship between rankings of image quality using three different assessment metrics and FreeSurfer-based quantitative analysis. Our study indicates that assessment of image quality for a data-driven reconstruction algorithm may require several types of analysis including using different image quality assessment metrics and their agreement with clinically relevant tasks.
Introduction
Deep learning-based techniques have the potential to improve MR acquisition and reconstruction time; however, the proper methodology to perform rigorous quantitative task-based assessment of image quality for these methods has not been devised. In this study, we reconstructed T1-weighted brain images using neural networks trained with five different datasets and investigated the assessment of image quality using three assessment metrics and FreeSurfer-based quantitative analysis. Our study seeks to explore the consistency and relationship between these different types of quality assessment methods.Methods
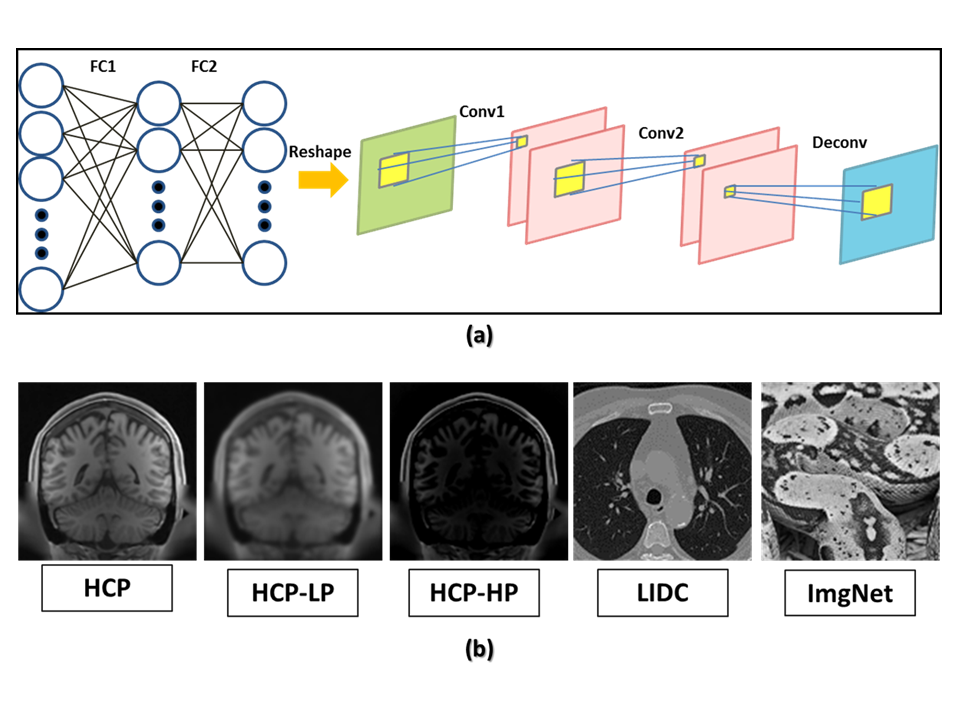
Automated transform by manifold approximation1 (AUTOMAP) was used in this study for MRI reconstruction from k-space. Figure 1(a) shows the AUTOMAP network architecture. AUTOMAP was trained in a supervised fashion using k-space and image pairs from data derived from five different datasets to result in reconstruction networks of varying performance: human connectome project data2 (HCP) (50,000 T1-weighted MRI images from 131 normal subjects), Gaussian low-pass filtered HCP (HCP-LP), Gaussian high-pass filtered HCP (HCP-HP); lung image database consortium3 (LIDC) data (50,000 lung CT scans from 292 patients), and ImageNet4, (50,000 natural images from 1,000 classes). Examples of each dataset are shown in Figure 1(b). All images were downsampled to 2 mm isotropic resolution. Each network was trained for 300 epochs. The reconstruction models were tested using 9,600 coronal slices from 30 HCP subject datasets which were not used during training.
We compared the reconstructed images against the reference images using three full-reference image quality assessment (FR-IQA) metrics: peak signal to noise ratio (PSNR), feature similarity5 (FSIM), and structural similarity6 (SSIM). FreeSurfer7,8 analysis was performed on each dataset. The bias-correction step was tuned to process all steps in FreeSurfer. Cortical thickness and segmented volumes were compared. Cerebellum and deep gray matter (Caudate, Putamen, and Pallidum) were chosen as regions of interest. Averaging objective image quality maps across the entire image provides an aggregate measure of quality. Restricting the IQA metric to a brain sub-region allows us to obtain a localized analysis of image quality (e.g. for regions with more clinical significance). We compared the IQA metrics using both overall and region-based approaches.
Results
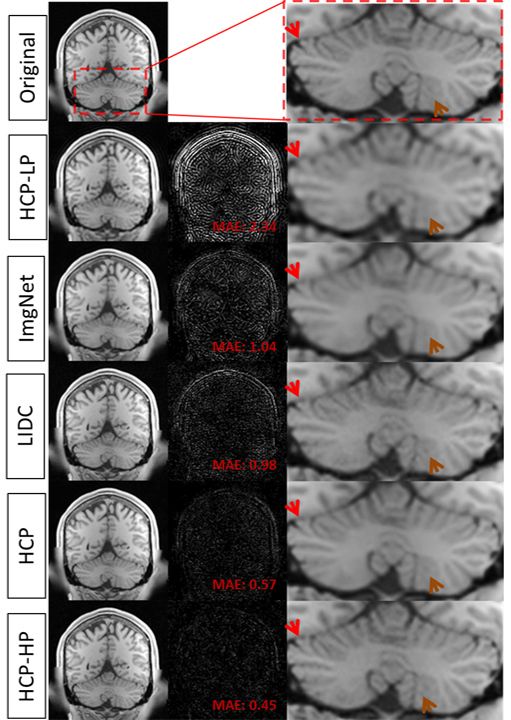
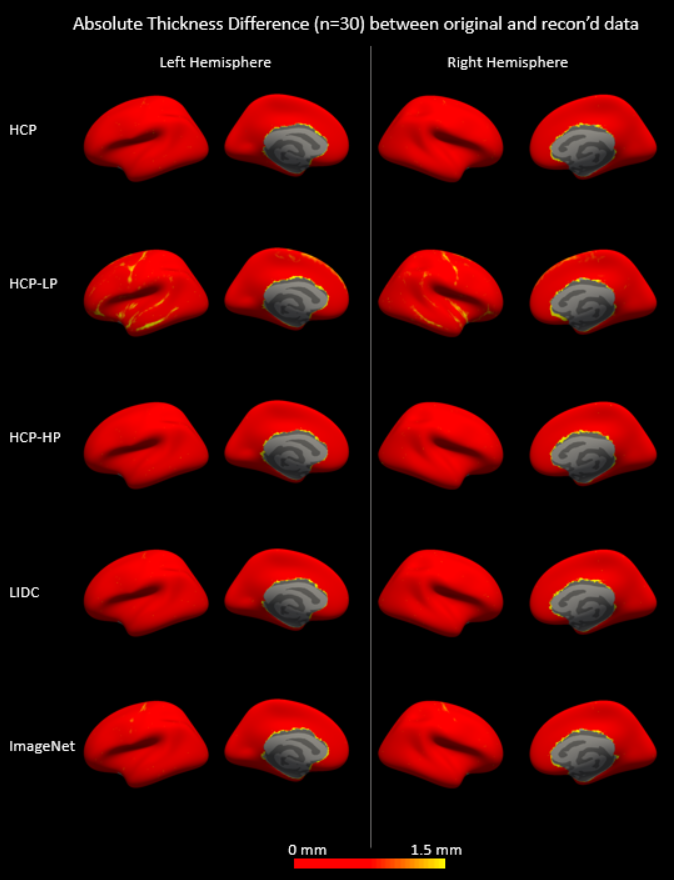
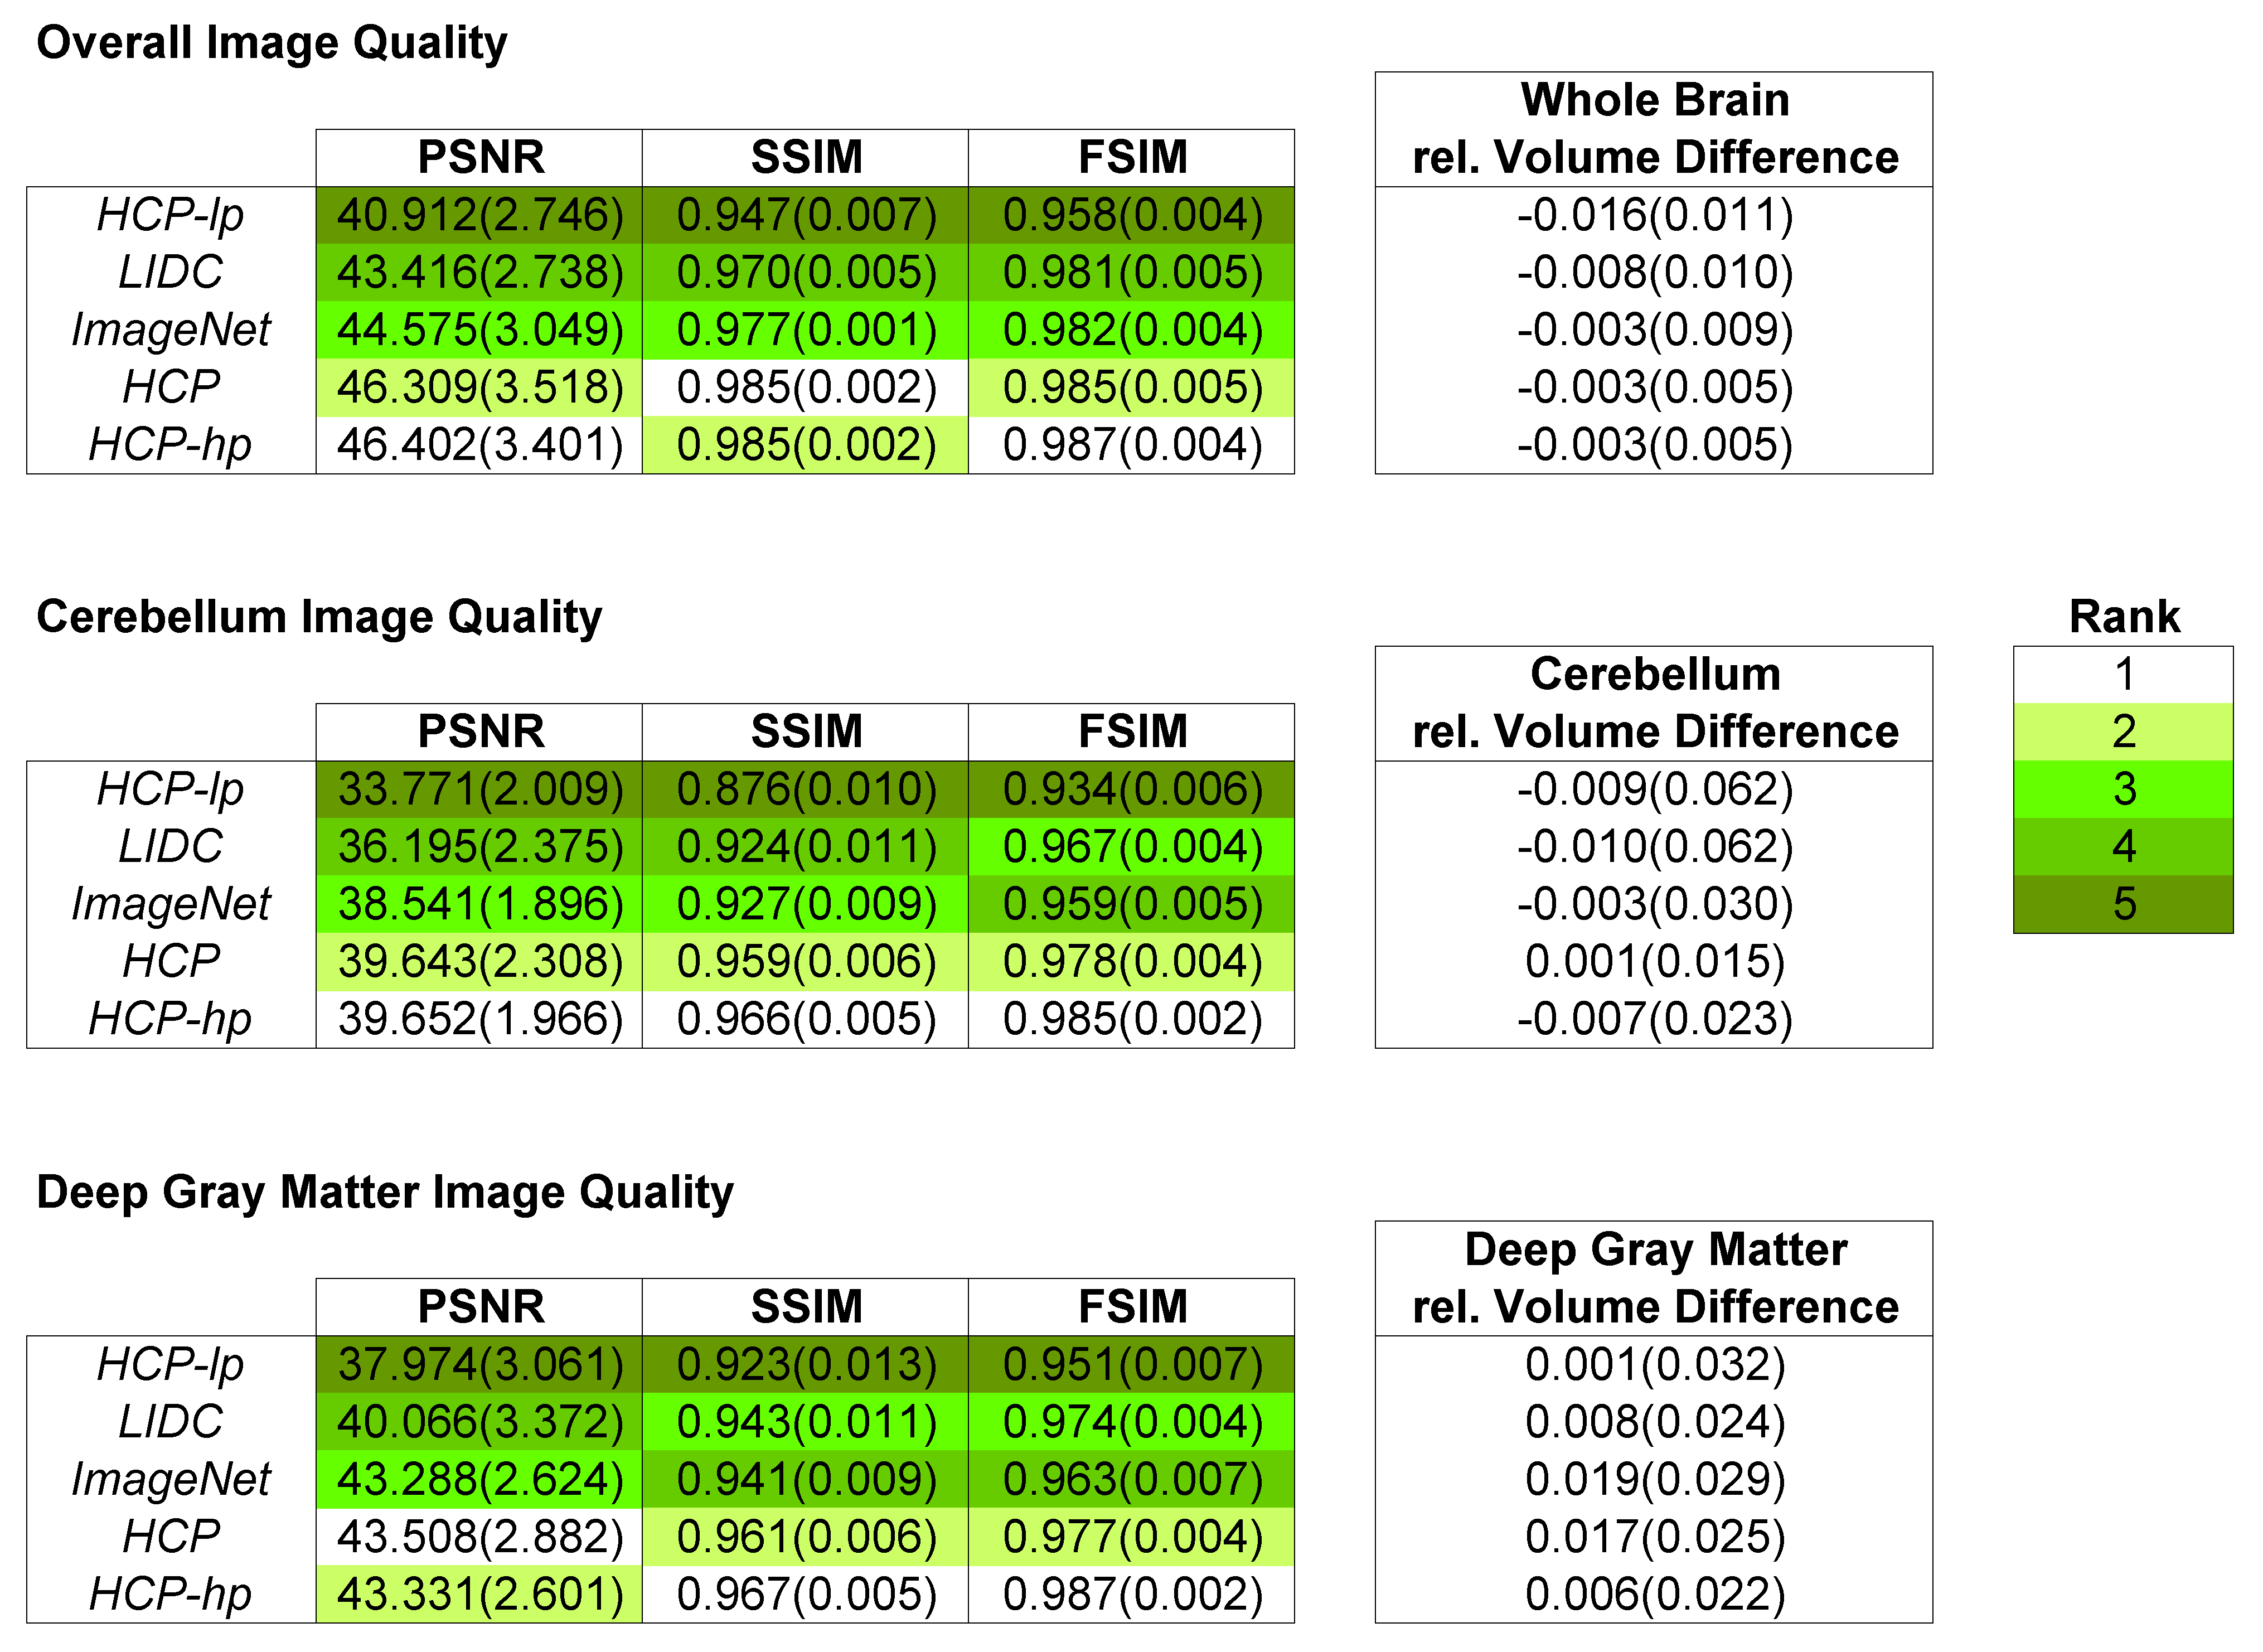
We reconstructed the slices in the test set using each trained AUTOMAP model and processed them using FreeSurfer. Cerebellum in images from HCP-LP and ImageNet-trained models appeared connected to cerebrum as shown in Figure 2 (indicated by red arrows). Additionally, gray and white matter boundaries in Cerebellum were subjectively blurry (indicated by brown arrows). HCP-LP had the largest mean absolute difference (MAD) while HCP-HP had the lowest MAD for cortical thickness relative to values derived from the reference images (Figure 3), though all algorithms produced thickness differences on average substantially below the 2 mm voxel size used in this study. Table 1 compared the three FR-IQA metrics and volume estimates for whole brain, and two sub-regions (cerebellum, and deep gray matter) across subjects. HCP-HP and HCP generally provided the highest image quality in terms of PSNR, SSIM, FSIM, whereas the relative volume differences were less than 2% for all algorithms, with no clear rank order observed. While some patterns can be noted, ranking of the reconstruction methods was not always consistent across metrics and brain regions.Discussion and Conclusion
We calculated image quality rankings based on two clinically relevant tasks (measurements of cortical thickness and segmented volumes obtained from FreeSurfer) and compared to rankings based on standard FR-IQA metrics. The 2 mm resolution and need to adapt HCP data for use in FreeSurfer prevents making any definitive conclusions regarding ranking of clinical utility of the reconstructions; however agreement to the reference standard was high for all algorithms, and, observed cortical thickness differences were largely consistent with FR-IQA rankings.
There was some agreement in the ranking across the metrics: generally, HCP-HP and HCP performed the best and HCP-LP performed the worst according to both the FR-IQA and relative cortical thickness analysis; however, in the volume comparison, no clear ranking was found, illustrating that image quality is ultimately task dependent.
Our results indicate that characterizing the performance of a data-driven reconstruction algorithm cannot solely rely on overall assessment of visual quality, any one metric or type of analysis. Instead, several types of analysis including multiple image quality assessment methods and their agreement with clinically relevant tasks may be required.
We observed that high-pass filtering the training data led to improved image quality across several metrics and regions. This can also be observed qualitatively as reduced blurring compared to other models. In the future, we intend to further investigate the effects of training image pre-processing on reconstruction model performance.
Acknowledgements
This work was supported in part through an Office of Women’s Health grant from the U.S. Food and Drug Administration, and by an appointment to the Research Participation Program at the Center for Devices and Radiological Health administered by the Oak Ridge Institute for Science and Education through an interagency agreement between the U.S. Department of Energy and the U.S. Food and Drug Administration.
References
1. Zhu B, Liu JZ, Cauley SF, et al. Image reconstruction by domain-transform manifold learning. Nature. 2018;555(7697):487-492.
2. https://db.humanconnectome.org/
3. https://wiki.cancerimagingarchive.net/display/Public/LIDC-IDRI
4. http://image-net.org/challenges/LSVRC/2017/download-images-1p39.php
5. Zhang L, Zhang L, Mou X, et al. FSIM: a feature similarity index for image quality assessment. IEEE transactions on Image Processing. 2011;20(8):2378-86.
6. Wang Z, Bovik AC, Sheikh HR, et al. Image quality assessment: from error visibility to structural similarity. IEEE transactions on image processing. 2004;13(4):600-12.
7. Dale AM, Fischl B, Sereno MI. Cortical surface-based analysis: I. Segmentation and surface reconstruction. Neuroimage. 1999;9(2):179-94.
8. Fischl B, Sereno MI, Dale AM. Cortical surface-based analysis: II: inflation, flattening, and a surface-based coordinate system. Neuroimage. 1999;9(2):195-207.
Figures