4692
Multispectral nonlocal means filters incorporating rotations and reflections for improved noise reduction with edge preservation in magnetic resonance imaging1Magnetic Resonance Imaging and Spectroscopy Section, National Institute on Aging, National Institutes of Health, Baltimore, MD, United States
Synopsis
Image denoising is used extensively for MR image post-processing. The nonlocal means (NLM) filter shows excellent noise reduction while preserving detail. NLM takes advantage of the structural redundancy in MR images by comparing local neighborhoods of voxels throughout the image, and estimating the intensity of an index voxel to be denoised through a weighted average of voxel intensities. However, this excludes patches that may be similar except for rotation or reflection, and therefore does not make full use of image redundancy. We introduce a multispectral implementation of NLM incorporating rotations and reflections, finding improved performance compared to conventional non-multispectral filtering.
Purpose
The multispectral nonlocal means filter (MS-NLM) incorporates information from MR data sets obtained with a variable acquisition parameter, and shows excellent edge preservation and noise reduction1-3. The MS-NLM algorithm exploits structural redundancy inherent in MR images by comparing local neighborhoods, or patches, surrounding an index voxel to be denoised and other voxels within a search window. Index voxel intensity is then estimated from a weighted average of these voxels. However, patches may exhibit similarity to the index voxel patch after rotations or reflection (RR), rather than in their native orientation. We introduce filters incorporating RR into the NLM and MS-NLM filters, and denote them as RR-NLM and RR-MS-NLM.Materials and Methods
The RR-NLM and RR-MS-NLM filters
We consider MS image sets defined on a discrete grid I describing the bounded 3D spatial domain spanned by the image, given by $$$S= \left\{S(i)|i\in I,S(i)\in ℝ^{k}\right\}$$$ where K is the number of frames of the MS data set. We define a frame k as a particular image within the multispectral dataset obtained with a particular value of a varying acquisition parameter such as echo time. For NLM, K = 1, while for MS-NLM, K > 1. The intensity of an index voxel i is estimated as the weighted mean of signal intensities calculated over all voxels j in a large search window of size R centered on i through2-3:
$$A_{k}(i) =\frac{ \sum_j^R w(i,j)S_{k}(j)}{\sum_j^R w(i,j)}, [1]$$
where w(i, j) is the weight quantifying the similarity between two voxels i and j in a frame k and is given by: $$$w(i,j) = exp(-\sum_{k=1}^K d_{k}(i,j)/Kh^{2})$$$ where $$$d_{k}(i,j) = \sum_{l=1}^L (n_{k,l}(i) - n_{k,l}(j))^{2}$$$ is the Euclidean distance defining the local similarity between voxels i and j of the frame k. $$$n_{k,l}(i)$$$ refers to the lth signal intensity within a local patch, n, centered on voxel i of the frame k. The weights are parameterized by the smoothing parameter h.
In the RR-MS-NLM, the local patch n(j) is rotated and reflected for each rotation. These re-oriented patches are then compared to the local patch, n(i), centered on i. For each rotation and reflection, t, the weight wt(i,j) is calculated as described above. Eq. 1 then becomes:
$$A_{k}(i) = \frac{\sum_{t=1}^T\sum_j^R w_{t}(i,j)S_{k}(j)}{\sum_{t=1}^T\sum_j^R w_{t}(i,j)}, [2]$$
where T is the total number of rotations and reflections.
Analysis
We illustrate the RR-NLM and RR-MS-NLM filters with quadrature rotations, that is, weights were calculated for local patch rotations of 0°, 90°, 180°, and 270° and their corresponding reflections (i.e. T = 8). More finely-spaced rotations may readily be implemented. Results were compared to those from NLM and MS-NLM, that is, without rotation or reflection. Analyses were performed on a synthetic two-dimensional checkerboard image as well as on synthetic MS T2-weighted brain datasets obtained from BrainWeb.4 Representative T2 values for white matter, gray matter, and cerebrospinal fluid were chosen as 60 ms, 85 ms, and 180 ms. MS T2-weighted images were then generated with twenty values of TE (i.e. K = 20) ranging uniformly from 10ms to 200ms. NLM, MS-NLM, RR-NLM, and RR-MS-NLM were used to filter the images, with R = 11 x 11 voxels and n = 5 x 5 voxels. The smoothing parameter h was set equal to the image noise σ determined by adding noise to achieve an SNR of 45, defined as the peak signal intensity at TE = 10 ms divided by σ. Error maps defined as the absolute difference between the reference and filtered images were generated to further assess filtering performance.
Results and Discussion
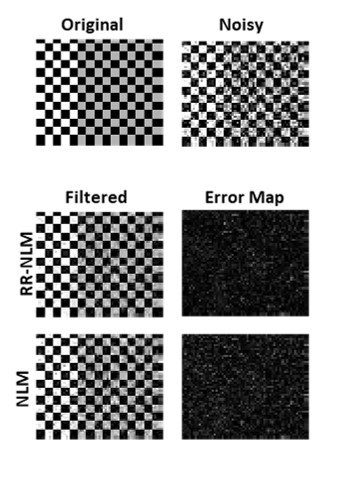
Figure 1: Results of filtering a noisy checkerboard image using NLM and RR-NLM. Visual inspection of filtered images and error maps indicate the superior performance of RR-NLM.
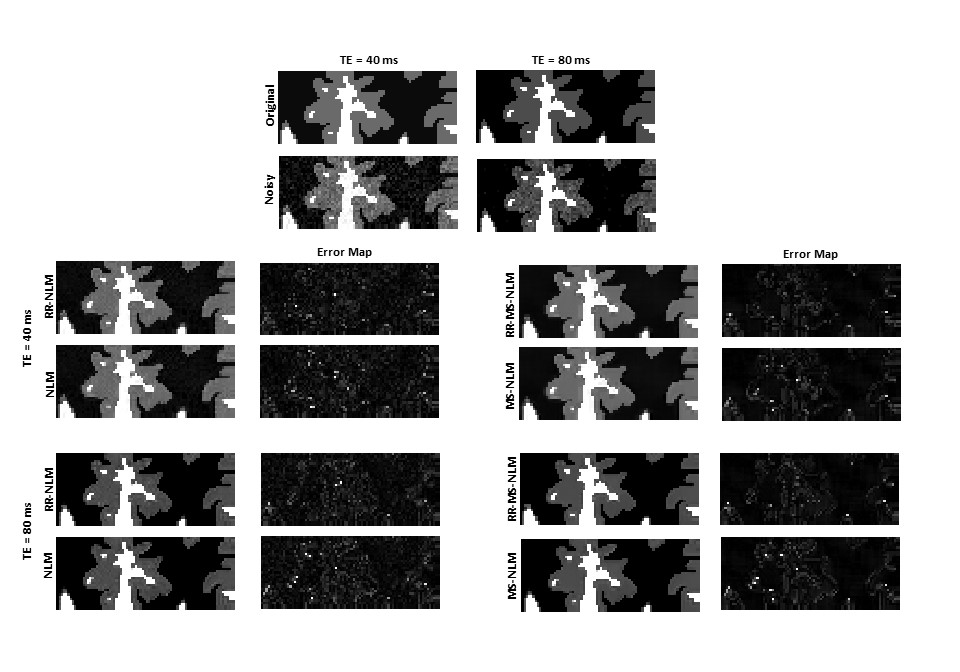
Figure 2: Results of filtering noisy MS synthetic brain datasets using NLM and RR-NLM. The full dataset was used for filtering, with results shown for two values of TE. Visual inspection of filtered images and error maps indicate that RR-NLM and RR-MS-NLM out-perform their counterparts that do not incorporate RR. In addition, as expected, the use of MS information leads to enhanced filtering performance,2 as seen by comparing the results of MS-NLM with NLM, and the results of RR-MS-NLM with RR-NLM. The best performance was seen with RR-MS-NLM.
Conclusions
Modifications of the NLM and MS-NLM filters that incorporate rotations and reflections, the RR-NLM and RR-MS-NLM filters, make increased use of image redundancy and show enhanced denoising performance while preserving edges. These filters are very general and may be applied to a wide range of MRI imaging modalities.Acknowledgements
The work was supported by the Intramural Research Program of the National Institute on Aging of the National Institutes of Health.References
1. Buades A, Coll B, Morel JM. A review of image denoising algorithms, with a new one. SIAM Journal on Multiscale Modeling and Simulation. 2005;4(2):490-530.
2. Manjón JV, Robles M, Thacker NA. "Multispectral MRI de-noising using non-local means", Proc. MIUA. 2007;41-45.
3. Bouhrara M, Bonny JM, Ashinsky BG, et al. Noise estimation and reduction in magnetic resonance imaging using a new multispectral nonlocal maximum-likelihood filter. IEEE Trans Med Imaging. 2017;36:181-193.
4. Kwan RKS, Evans AC, Pike GB. MRI simulation-based evaluation of image-processing and classification methods. IEEE T Med Imaging.1999; 8(11):1085-97.
Figures