4689
Myelin Water Fraction Maps with improved Fit to Noise using TGV and conventional filters1Department of Radiologic Technology, Carinthia University of Applied Sciences, Klagenfurt, Austria, 2Department of Engineering, University of Applied Sciences Wiener Neustadt, Wiener Neustadt, Austria, 3UBC MRI Research Centre, University of British Columbia, Vancouver, BC, Canada, 4Institute for Mathematics and Scientific Computing, University of Graz, Graz, Austria, 5Department of Radiology, Medical University of Graz, Graz, Austria
Synopsis
Myelin Water Imaging is the technique of choice to measure myelination changes in healthy and abnormal situations in the brain. However, calculation of myelin water fraction (MWF) maps is challenging due to the low signal-to-noise ratio in the acquired data. Here, we demonstrate different filter methods, such as TGV, Gaussian and Wiener to overcome this problem. 3D GRASE images filtered with all three methods show significant enhanced fit-to-noise (FNR) values compared to unfiltered, while TGV preserves sharper edges and detailed structures. Finally, noise reduction and thus more reliable MWF maps can lead to certain advantages in the field of MS.
Introduction
Over the last two decades, Myelin Water Imaging has become an important tool in magnetic resonance imaging for visualizing the myelination state of white matter in vivo. Several neurodegenerative diseases, such as multiple sclerosis (MS), schizophrenia or stroke are associated with a reduction of myelin water fraction (MWF).1 Usually, multi spin echo (MSE) or GRASE techniques are used to acquire the T2-decay curve.1–3 Subsequently, MWF maps are determined using a multicomponent T2 analysis approach by applying the non-negative least squares algorithm (NNLS). However, a low signal-to-noise ratio in the acquired data may decrease quality of MWF maps, which makes noise reduction an important aspect during pre-processing.4–6 In this study, we demonstrate the performance of the total generalized variation (TGV) concept 7 and compare it to conventional Gaussian and Wiener filtering methods, regarding Fit-to-noise (FNR), MWF values and visual inspection.
Material and Methods
3D GRASE data of a healthy subject was acquired with a Philips Achieva 3T-MRI system. Scan parameters were TR = 1000 ms, 32 echo times with 10, 20, 30, …, 320 ms, GRASE factor = 3, SENSE factor = 2 and a voxel size = 1.31mm x 1.31mm x 2.30mm. Before the calculation of the MWF maps TGV, Wiener and Gaussian filtering was applied to all 32 echoes . Here we started with conservative filtering parameters and increased them systematically. Within this work, the following filter parameters were used: TGV: automatic evaluation of regularization parameter with 7% noise assumed; Wiener: kernel size 3.93mm and Gaussian: FWHM 1.77mm. Finally, MWF (and FNR maps) were calculated. For quantitative comparison of the individual filtered datasets, calculation of the blur index 8 and both, mean MWF and mean FNR values of certain regions in the brain were calculated. Regions of Interests (ROIs) with an area of ≈1 cm² were defined in five bilateral white matter structures (Genu, Splenium, frontal WM, occipital WM and parietal WM), similar to the ROI localizations in 9. For each anatomical region, an ANOVA was used to determine FNR differences between the individual filtering methods. Bonferroni correction was applied and a p-value 0.05 was considered as statistically significant.Results
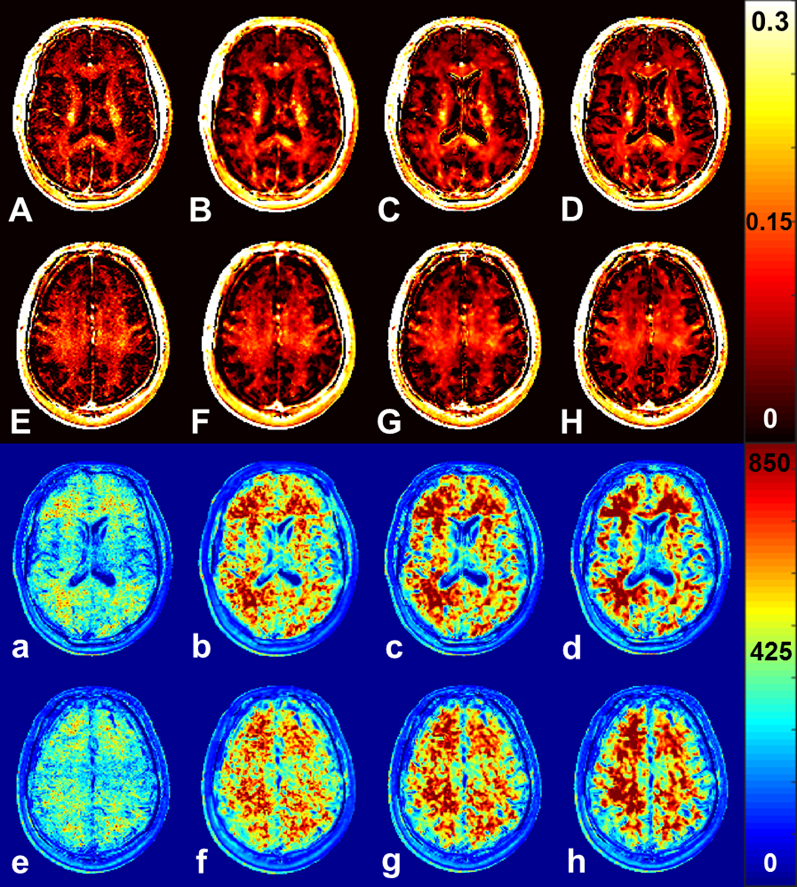
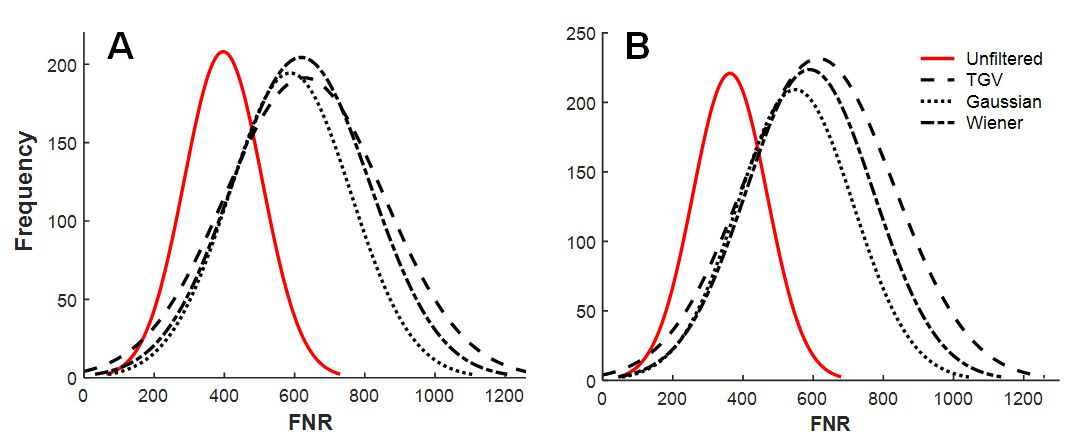
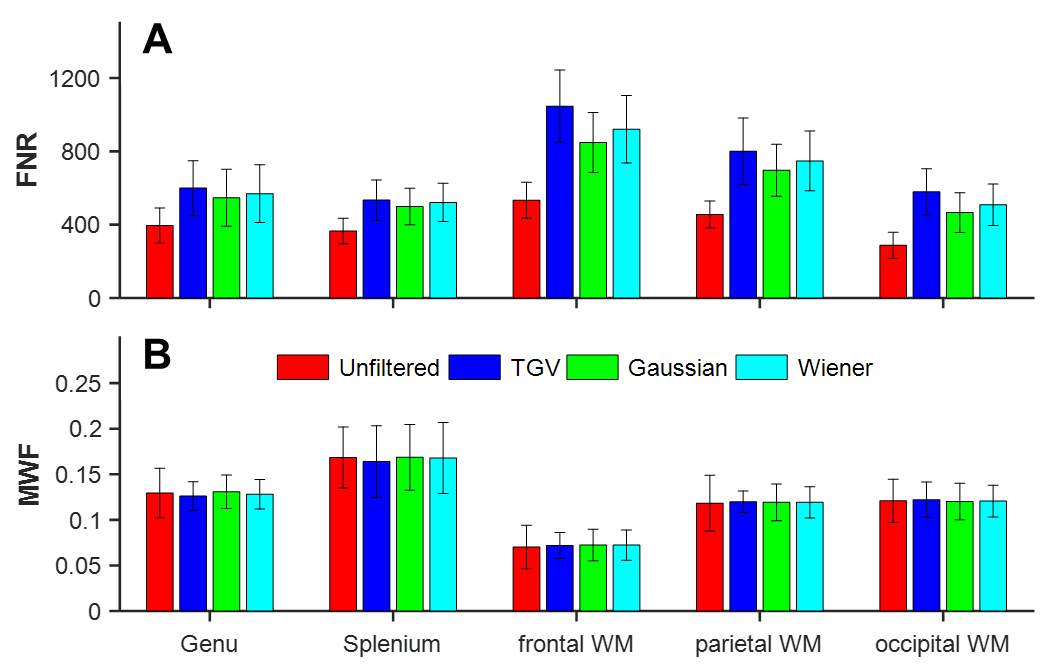
Figure 1 gives an example of MWF and FNR maps derived from two representative slices using TGV, Gaussian and Wiener filters. As can be seen, image noise is higher in the unfiltered image which results in low FNR values (a, e) and therefore MWF maps (A, E) with reduced accuracy. Moreover, FNR values from whole brain WM tissue (Fig. 2A, B) and individual ROIs are significantly higher after filtering with all three mentioned methods (Fig. 3A - p<0.05) than those obtained in unfiltered images. TGV and Wiener filtering achieved the best-fitted distribution of highest FNR (Fig. 2) and performing better regarding edge preservation and definition of small brain structures (Fig. 1C-D, G-H). Further, mean FNR values of all WM regions were highest with TGV, while mean MWF values were, overall, constant between unfiltered and filtered images (Fig. 3).Discussion
A large number of different filtering and regularization approaches are available to improve MWF maps.5,6 This study demonstrates that pre-filtering the acquired multi-echo data with TGV or Wiener filter creates robust myelin water maps with simultaneously sharper edges and better definition of small image structures, such as sulci, compared to Gaussian filter.Conclusion
Goodness of fit from multi-echo 3D GRASE data was shown to be substantially enhanced using TGV, Gaussian and Wiener filtering methods. Moreover, the high edge preservation of the TGV filter is beneficial in applications such as MWI of MS lesions, where exact and sharp lesion boarders are important.Acknowledgements
This work was supported by funds of the Österreichische Nationalbank (Austrian Central Bank, Anniversary Fund, project number: 16153).References
1. MacKay AL, Laule C. Magnetic Resonance of Myelin Water: An in vivo Marker for Myelin. Brain Plast. 2016;2(1):71-91.
2. Prasloski T, Rauscher A, MacKay AL, et al. Rapid whole cerebrum myelin water imaging using a 3D GRASE sequence. NeuroImage. 2012;63(1):533-539.
3. Laule C, Vavasour IM, Moore GRW, et al. Water content and myelin water fraction in multiple sclerosis. A T2 relaxation study. J Neurol. 2004;251(3):284-293.
4. Zhang J, Kolind SH, Laule C, et al. Comparison of myelin water fraction from multiecho T2 decay curve and steady-state methods. Magn Reson Med. 2015;73(1):223-232.
5. Bouhrara M, Reiter DA, Maring MC, et al. Use of the NESMA Filter to Improve Myelin Water Fraction Mapping with Brain MRI. J Neuroimaging. 2018.
6. Jones CK, Whittall KP, MacKay AL. Robust myelin water quantification: averaging vs. spatial filtering. Magn Reson Med. 2003;50(1):206-209.
7. Bredies K, Kunisch K, Pock T. Total Generalized Variation. SIAM J. Imaging Sci. 2010;3(3):492-526.
8. Crete F, Dolmiere T, Ladret P, et al. The blur effect: perception and estimation with a new no-reference perceptual blur metric. Human Vision and Electronic Imaging XII: SPIE. 2007;6492-16.
9. Faizy TD, Kumar D, Broocks G, et al. Age-Related Measurements of the Myelin Water Fraction derived from 3D multi-echo GRASE reflect Myelin Content of the Cerebral White Matter. Sci Rep. 2018;8(1):14991.
Figures