4688
Hadamard Encoding Compared with Fourier Encoding in Three-dimensional (3D) Functional MRI1Department of Electrical Engineering, Stanford University, Stanford, CA, United States, 2Department of Radiology, Stanford University, Stanford, CA, United States
Synopsis
Three-dimensional (3D) acquisition is beneficial for functional MRI (fMRI) compared to two-dimensional (2D) acquisition since it can provide higher spatial resolution, resulting from potentially higher temporal signal-to-noise ratio (tSNR) and thinner slices. However, 3D has higher physiological noise due to higher signal at the center of k-space, which results in lower tSNR. The number of slices can be decreased to reduce physiological noise. However, a small number of slices in Fourier encoding results in Gibbs ringing. In this study, we show that 3D Hadamard acquisition avoids Gibbs artifacts while increasing SNR compared with conventional 2D and 3D methods.
Introduction
For functional MRI (fMRI), higher spatial resolution is required for better localization of activation signals. Three-dimensional (3D) acquisition potentially provides higher signal-to-noise ratio (SNR)1,2 and can acquire thinner slices, which is important for higher spatial resolution and reduced signal dropout. However, 3D acquisition has more physiological noise since physiological noise is proportional to signal intensity. Therefore, to get the benefit of greater SNR in 3D, a small number of slices is required. With normal 3D Fourier encoding, a small number of slices results in large side lobes in the point spread function due to Gibbs ringing. We introduced Hadamard encoding3 in a previous phantom study with small number of slices (2 and 4) to demonstrate the concept. In this study, we acquired sensory-motor, visual and auditory task fMRI using 3D Hadamard encoding and compared to 2D and 3D Fourier encoding in terms of reconstructed images, temporal SNR (tSNR) and activation maps.Methods
Data acquisition: With IRB approval, we scanned a human brain using a 2D, 3D Fourier encoded and 3D Hadamard encoded spiral GRE sequences. All the data were obtained using a 3T GE whole-body MRI scanner equipped with a single-channel RF receive coil and single-shot GRE sequence with TE/TR=29/2000ms, 3.4mm × 3.4mm × 4mm voxels, FOV=22cm × 22cm, 32 slices, 128 timeframes and scan time=4min. Flip angles of 80, 20 and 70 and 45 degrees are used for 2D, 3D with Fourier, 3D with Hadamard 2 and 3D with Hadamard 4, respectively. Data analysis: Let Hn be a Hadamard matrix of order n (power of 2) containing ±1 in the n × n matrix (Eqn.1).
$$ H_{2}=\begin{bmatrix}1 & 1 \\1 & -1 \end{bmatrix},\ H_{4}=\begin{bmatrix}1 & 1 & 1 & 1 \\1 & -1 & 1 & -1 \\ 1 & 1 & -1 & -1 \\ 1 & -1 & -1 & 1 \end{bmatrix} \ \ \ \ \cdot\cdot\cdot \ (1) $$
Let S be a column matrix containing the RF pulse waveforms for each slice to be simultaneously encoded, Si. For Hadamard 2 (for 2 slices), for example, sinc pulses for each slice S1 and S2 are combined as described by H2 (addition/subtraction) (Eqn. 2). Reconstruction of the acquired data to separately obtain slices Si uses the inverse Hadamard matrix (Eqn. 3). The Hadamard matrix is its own inverse apart from a constant.
$$ H_{2}\cdot S=\begin{bmatrix}1 & 1 \\1 & -1 \end{bmatrix} \begin{bmatrix} S_{1} \\S_{2}\end{bmatrix}=\begin{bmatrix} S_{1}+S_{2} \\S_{1}-S_{2}\end{bmatrix}=A \ (Let\ this\ matrix\ be\ A) \cdot\cdot\cdot \ (2) $$
$$ S = (H_{2})^{-1}\cdot A = \frac{1}{2}H_{2}\cdot A =\frac{1}{2}\begin{bmatrix}1 & 1 \\1 & -1 \end{bmatrix}\begin{bmatrix}S_{1}+S_{2} \\S_{1}-S_{2} \end{bmatrix}=\begin{bmatrix}S_{1} \\S_{2} \end{bmatrix} \ \ \ \ \cdot\cdot\cdot (3) $$
We compared the reconstructed images and tSNR maps with 2D, 3D Fourier encoding, Hadamard 2 and 4. We also compared the activation maps from a combined sensory-motor, visual and auditory task fMRI. Activation maps are created by correlating the reconstructed timeseries with sine and cosine timeseries model functions. In the activation maps, t-scores are calculated and thresholded by p<0.01.
Results
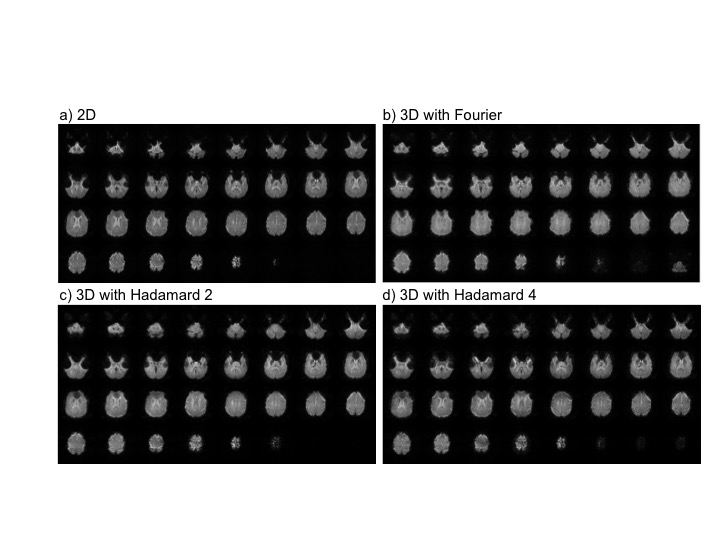
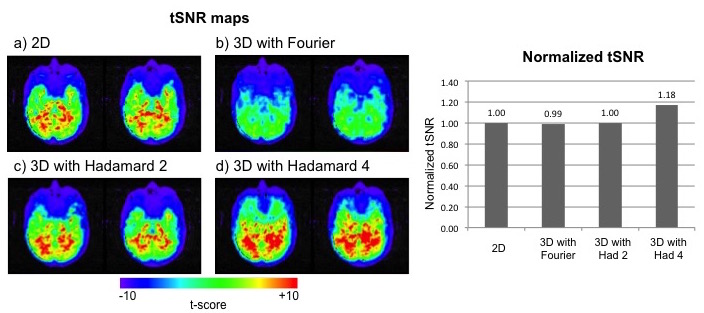
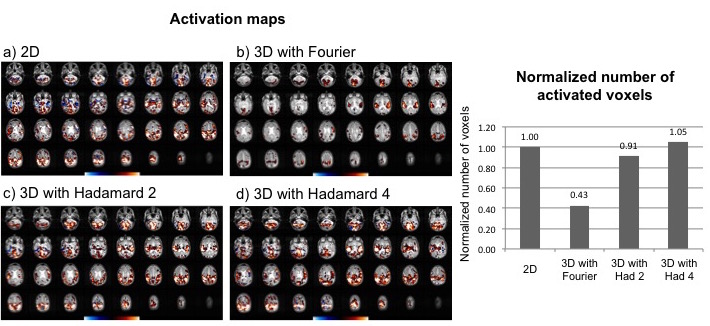
The reconstructed images using 2D, 3D with Fourier and 3D with Hadamard 2 and 4 are shown in Fig.1. Both 3D with Hadamard 2 and 4 reconstructed images successfully although there are phase artifacts due to off-resonance between slices. Fig. 2 shows tSNR using each method, with values 0.3% higher and 18% higher than that from 2D for Hadamard 2 and 4, respectively. Compared to 3D Fourier, Hadamard 2 and 4 demonstrates 1% higher and 19% higher tSNR, respectively. Activation maps are shown in Fig. 3. Compared to 2D, the number of activated voxels across whole brain regions is 9% lower and 5% higher with Hadamard 2 and 4, respectively. Furthermore, compared to 3D Fourier, the number of activated voxels is 213% higher and 247% higher with Hadamard 2 and 4, respectively.Discussion
In this study, we demonstrated that 3D Fourier encoding is inferior to 2D acquisition in fMRI applications because physiological noise dominates thermal noise with the typical resolution and number of slices employed, and Hadamard encoding allows a small number of slices (2 or 4) to be acquired without Gibbs artifacts, while obtaining a tSNR and activation advantage in all brain areas. Hadamard encoding may therefore have an advantage over other forms of Simultaneous MultiSlice methods4 for fMRI in providing a tSNR increase rather than a loss (which is partially offset by a reduction in TR and possible increase in degrees of freedom).Acknowledgements
Funding for this work was provided by: NIH P41 EB015891.References
1. “Physiological noise in oxygenation-sensitive magnetic resonance imaging”. Kruger G, Glover GH. Magnetic Resonance in Medicine, 46(4): 631-637, 2001
2. “Neuroimaging at 1.5 T and 3.0 T: comparison of oxygenation-sensitive magnetic resonance imaging”. Kruger G, Kastrup A, Glover GH. Magnetic Resonance in Medicine, 45(4): 595-604, 2001
3. “Hadamard matrices and their applications”. Hedayat A., Wallis WD, Annals of Statistics. 6(6): 1184–1238, 1978
4. “Simultaneous multislice acquisition of MR images”. Weaver JB, Magn Res Med 1988; 8:275–284
Figures