4678
Encoding trajectory optimization based on the pixel variance using graphics processing units1Dept. of Radiology, Medical Physics, Medical Center University of Freiburg, Faculty of Medicine, University of Freiburg, Freiburg im Breisgau, Germany
Synopsis
Undersampled trajectories were optimized for parallel imaging with explicit consideration of the RF coil sensitivities in order to complement the RF coil elements. A second-order approximation of pixel variance was used as a metric to evaluate encoding trajectories and also serves as the cost function in the optimization problem, solved using Simulated Annealing. The metric was implemented on a Graphical Processing Unit (GPU) to accelerate computations. The developed method was evaluated on two test cases with Cartesian and radial sampling for isotropic and anisotropic fields-of-view. Resulting optimized trajectories led to improved image quality, more uniform SNR and reduced g-factors.
Introduction
In MRI, reducing acquisition time while maintaining image quality is of great importance for clinical practice. The application of parallel imaging combined with specialized sampling schemes (encoding trajectories) has been a common approach to decrease acquisition times. Ideally, an undersampled trajectory is designed such that its encoding capabilities complement the encoding capabilities of the used RF receive array in order to minimize undersampling artefacts. Finding such a trajectory by means of an optimization algorithm requires a metric which assesses the trajectory’s performance. The performance metric proposed in [1] provides a measure for the variance of the reconstructed pixels. Unfortunately, in practice, direct computation of this variance is not feasible; therefore a Kalman filter based approach has been used in [1]. This still involves the computation of a time-consuming inverse and additionally requires the choice of a prior covariance. In this work we follow an alternative approach to calculate the second-order approximation of the pixel variance [2] for which we propose an efficient implementation on GPUs. We use this approximation in a Simulated Annealing (SA) based optimization to find optimal encoding trajectories.Methods
We aim at minimizing the pixel variance $$$v(k)$$$ which is obtained from the trace of the pixel covariance matrix $$$Q^{-1}(k)$$$: $$v(k)=Tr(Q^{-1}(k)),$$ where the pixel covariance matrix $$$Q^{-1}(k)$$$ is equal to $$ Q^{-1}(k)=(E^{T}(k)E(k))^{-1}.$$ Here $$$E(k)$$$ is the encoding matrix for trajectory $$$k$$$ which includes a model for dephasing to actively control the image resolution [1]. Matrix $$$Q$$$ can be decomposed into its diagonal part $$$\Lambda$$$ and its off-diagonal part $$$Z$$$ such that $$$Z=Q-\Lambda$$$. As shown in [2], the second-order approximation of the pixel variance can be calculated as: $$ v_n:=[Q^{-1}]_{nn}=\lambda_n(1+\lambda_n\sum_{m=1}^Nz^{2}_{n,m}\lambda_m),$$ where $$$N$$$ is the number of rows of $$$Q$$$, $$$z_{n,m}$$$ presents the elements of $$$Z$$$ and $$$\lambda_{n}$$$ denotes the diagonal elements of $$$\Lambda^{-1}$$$. Considering a row-wise calculation, this can be computed efficiently in parallel on GPUs. Due to the large parameter space and the multi-modal nature of the optimization problem, a stochastic optimization method called Simulated Annealing (SA) is used as a solver. The code for this method was implemented in Python. To compare the execution times of GPU and CPU, the cost function was implemented in CUDA C and MATLAB. Image quality was assessed using a Compressed Sensing phantom [3]. Gaussian noise was added to the k-space samples after a forward simulation. Image reconstruction was performed with CG (50 iterations) and the encoding matrix was used as forward operator using ARTBOX [4]. SNR and g-factor maps were obtained by reconstructing 100 times with different added Gaussian noise.Results and discussion
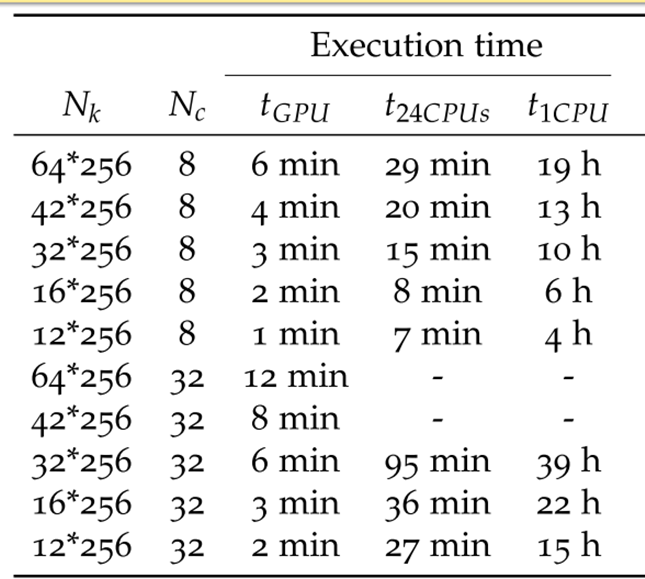
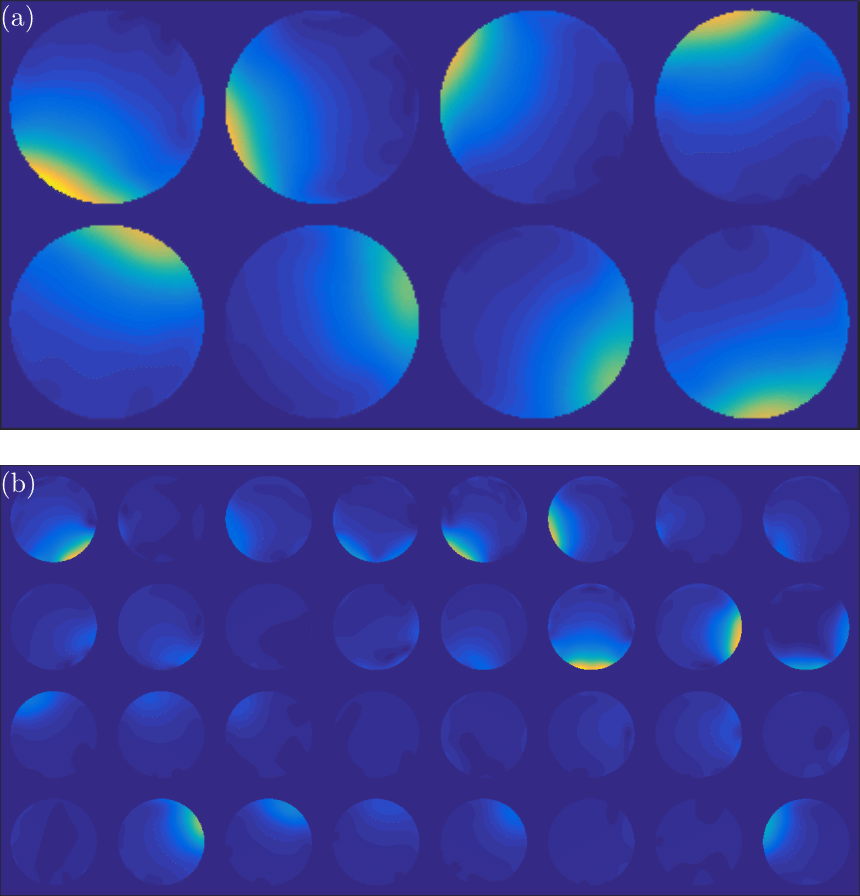
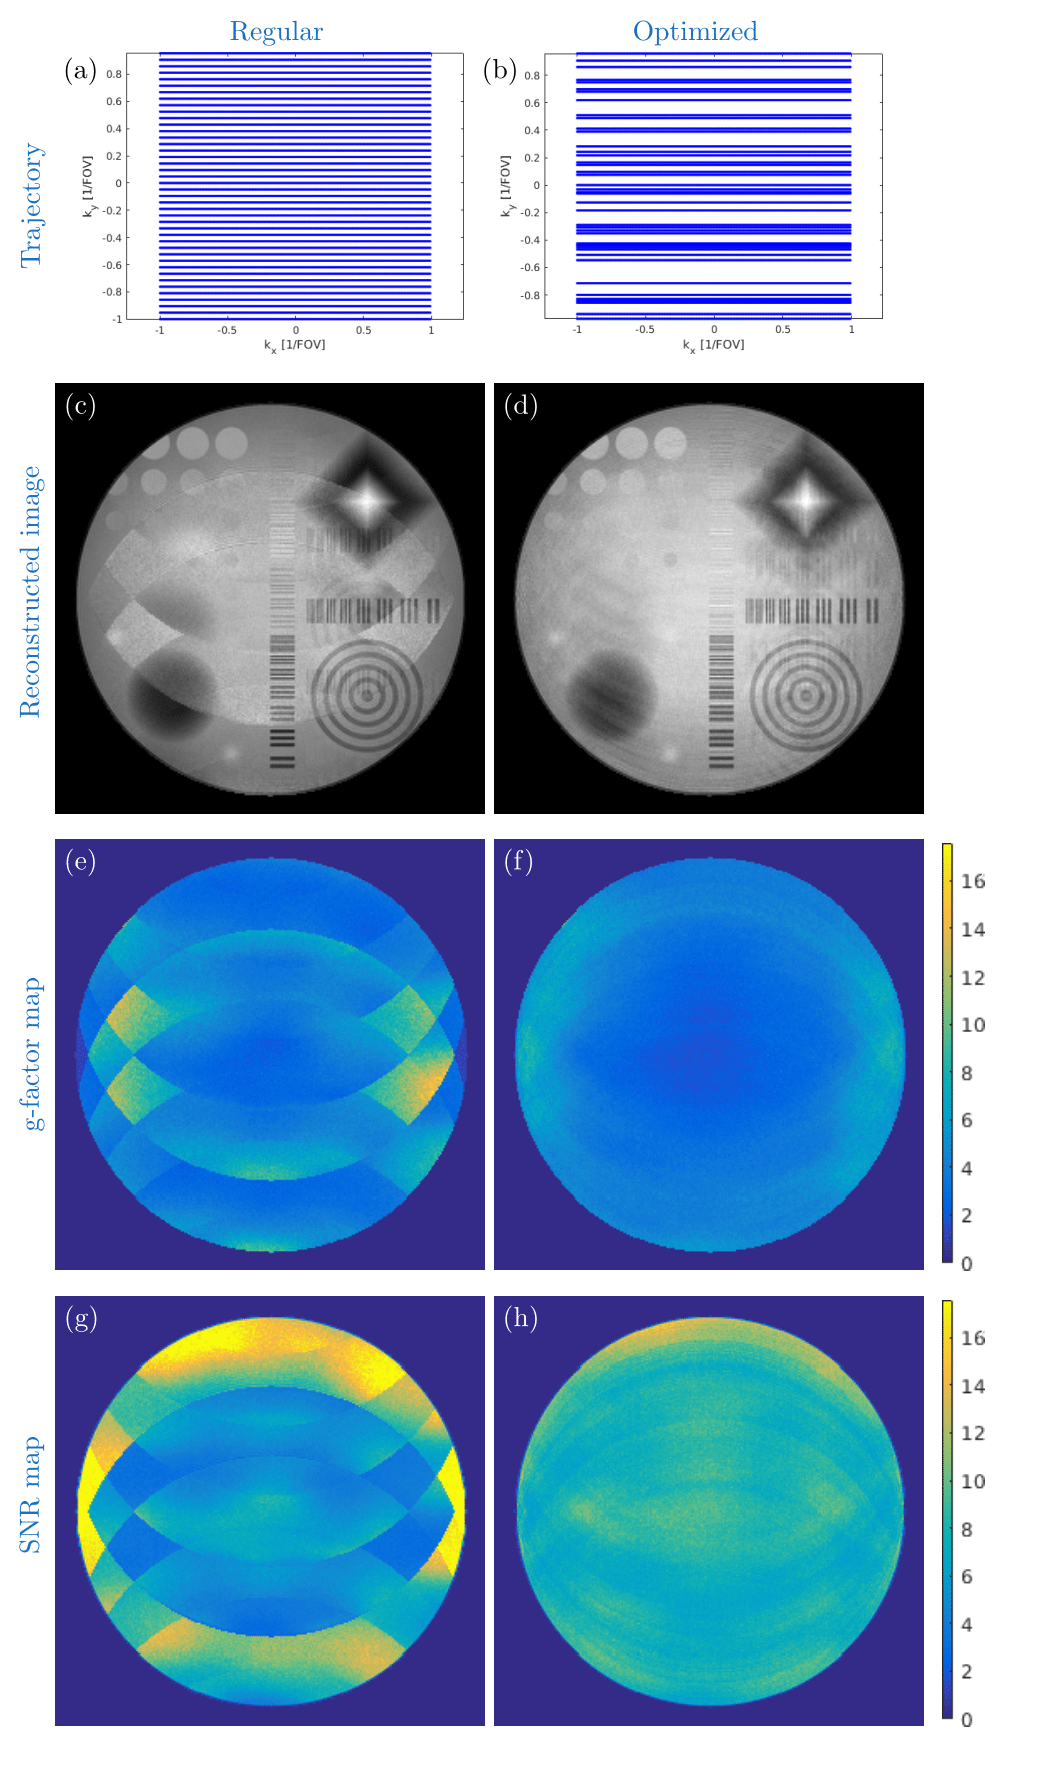
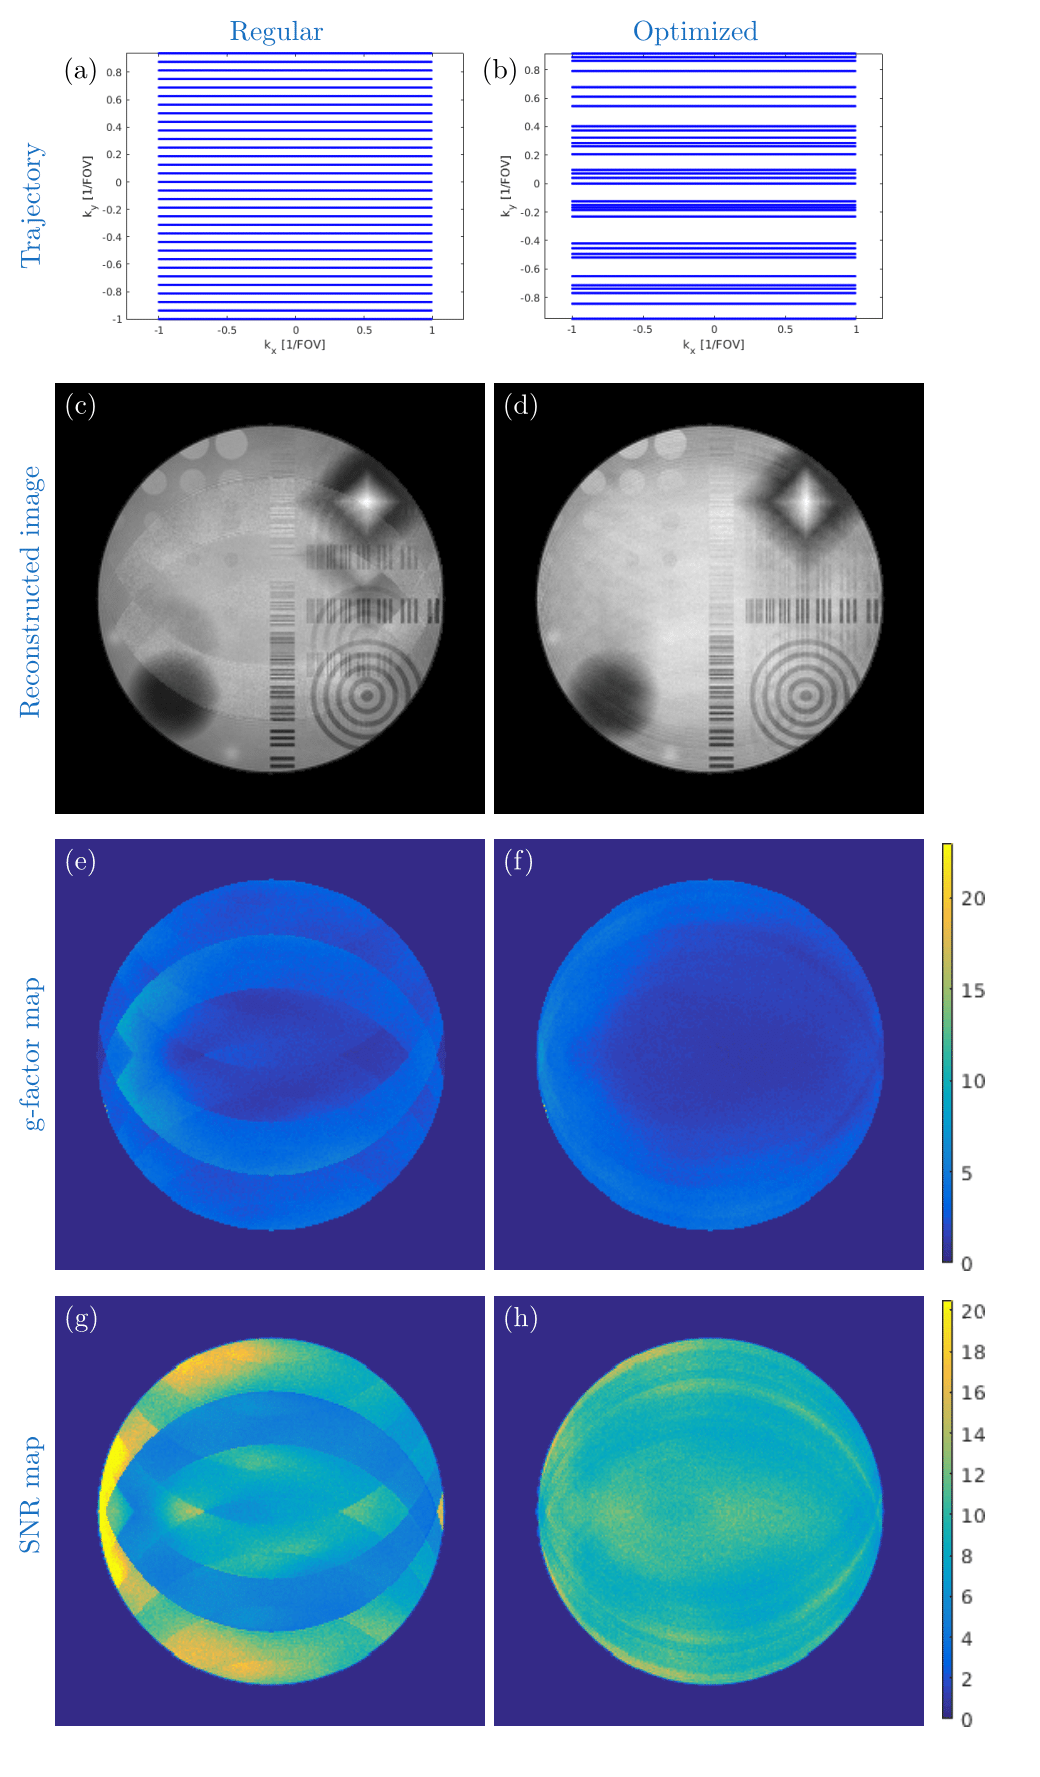
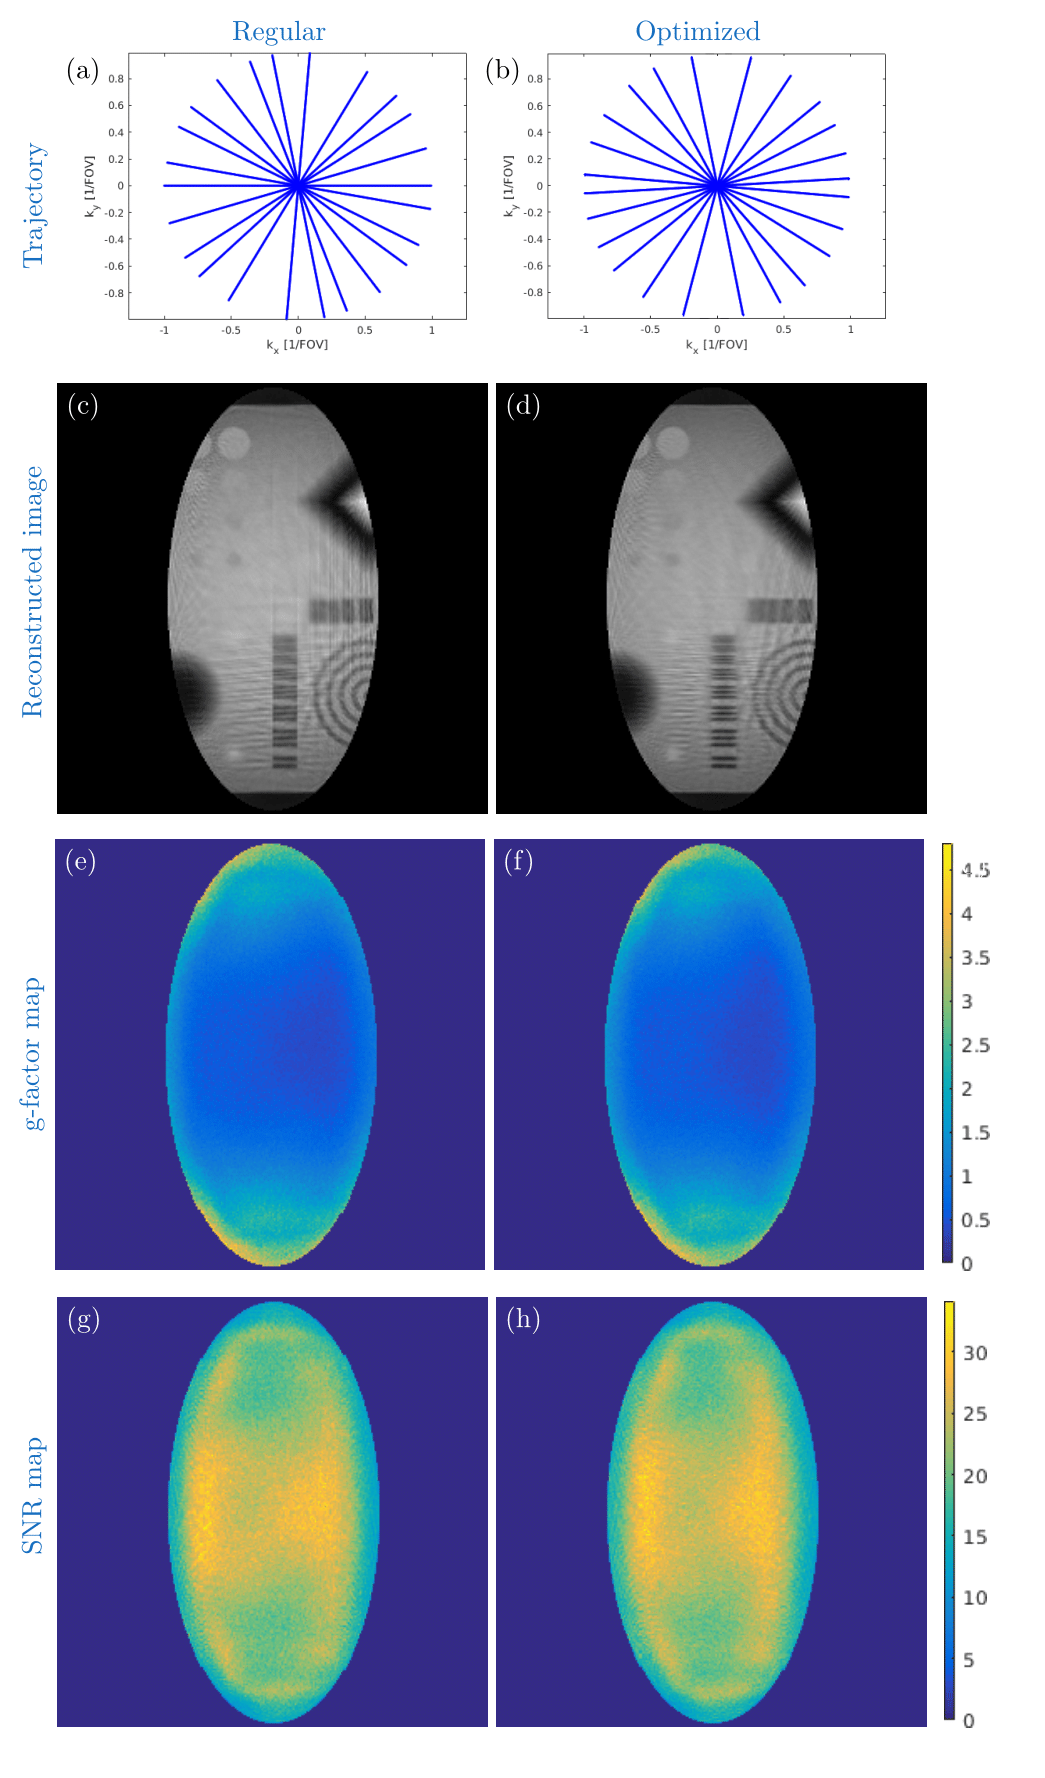
Table.1 shows that due to the GPU-acceleration, the required time to obtain an optimum trajectory could be reduced from months to a few days. Figure 1 depicts the two measured RF coil sensitivities which were used to evaluate the method. Figures 2 and 3 compare the regular undersampling of a Cartesian sampling pattern with the optimized trajectory for an 8-element and a 32-element RF coil (Fig.1), respectively. As can be seen from Fig. 2c and 3c, regular undersampling leads to strong coherent undersampling artefacts, which are substantially reduced with the optimized trajectories (Fig. 2d and 3d). The resulting incoherence is perfectly suited for sparsity enforcing reconstructions; however, such reconstructions have not been applied in order to be independent of the object under investigation. A comparison of SNR and g-factor maps (Figs. 2e-h and 3e-h) illustrates that the optimized trajectories lead to an overall better and more uniform noise behavior. Additionally, further prior information can be included into the optimization. For instance, to examine the dependency of the optimization algorithm on the characteristics of the field of view (FOV), the process was repeated with an anisotropic FOV and a radial sampling pattern (Fig. 4). In this case, the trajectory found by the optimization (Fig.4b) has more readouts aligned to the direction of the ellipse’s major axis than to the semi-major axis, which is expected and can be explained by the ratio of the ellipse’s axes [5]. In general, any prior knowledge representable in the encoding matrix can be included to aid the optimization. Note that the concept is not limited to Cartesian and radial sampling, only.Conclusions and outlook
The presented work provides a fast and reliable method for MRI trajectory optimization including RF coil sensitivities, FOV and potentially other prior knowledge. Results show that the optimized trajectories lead to suppressed undersampling artifacts, and more uniform and overall improved SNR and g-factor maps compared to the unoptimized trajectories. In future work, the combination of optimized trajectories with compressed sensing reconstructions will be evaluated. Furthermore, these optimized trajectories will be assessed in in-vivo imaging on real hardware.Acknowledgements
This work is supported by the European Research Council Proof-of-Concept Grant ‘mrSANE’ grant agreement 755466.References
[1] Layton, K. J., Kroboth, S., Jia, F., Littin, S., Yu, H. and Zaitsev, M. (2016), Trajectory optimization based on the signal-to-noise ratio for spatial encoding with nonlinear encoding fields. Magn Reson Med, 76: 104–117. doi: 10.1002/mrm.25859
[2] Layton, K. J., Morelande, M., Farrell, P.M, Moran, B., Johnston, L.A. (2012), Performance analysis for magnetic resonance imaging with nonlinear encoding fields. IEEE Transactions on Medical Imaging 31 (2), 391-404
[3] David Smith. Compressed sensing MRI phantom. 2018. url: https://github.com/davidssmith/csphantom (visited on 07/29/2018) (cit. on p. 28).
[4] Stefan Kroboth. Accelerated Reconstruction Toolbox for MRI. 2018. url:https://github.com/stefan-k/ARTBOX (visited on 08/21/2018) (cit.on p. 51).
[5] Peder EZ Larson, Paul T Gurney, and Dwight G Nishimura. “Anisotropicfield-of-views in radial imaging.” In: IEEE transactions on medical imaging27.1 (2008), pp. 47–57 (cit. on pp. 46, 51).
Figures