4677
Semi-Classical Signal Analysis Method with Soft-Thresholding for MRS denoising1Computer, Electrical and Mathematical Science and Engineering (CEMSE) division, King Abdullah University of Sciences and Technology (KAUST), Thuwal, Saudi Arabia, 2Department of Radiology and Nuclear Medicine, University of Ghent, Gent, Belgium, 3Department of Radiology, Department of Radiology and Nuclear Medicine, University of Ghent, Gent, Belgium, 4Robarts Research Institute, University of Western Ontario, London, ON, ON, Canada
Synopsis
A Semi-Classical Signal Analysis (SCSA) method with soft thresholding is proposed for MRSI denoising. The SCSA takes advantage of the pulse-shaped MRS spectrum to decompose both real and imaginary parts, into localized basis given by squared eigenfunctions of the Schrödinger operator. An optimization-based soft-threshold is provided to find optimal semi-classical parameters, for both the real and imaginary parts of the MRS signal. The optimal SCSA parameters discard the eigenfunctions representing noise from the noisy
Introduction
Most of the biomedical signals have a pulse-shaped form [1], which reflects biological or chemical activities happening within the human body. Magnetic Resonance Spectroscopy (MRS) signals are good examples of pulse-shaped signals that are widely used for medical diagnosis and monitoring during surgical operations. However, these signals are subject to noise contamination, due to many interferences, such as electronic equipment noise coming from the power line, patient motion, and others. Several MRS denoising methods have been proposed [2,3]. For instance, a recent work employed the Semi-Classical Signal Analysis (SCSA) to reduce the noise in MRS spectra. However, this algorithm deals only with the real part of the MRS spectrum. Moreover, the imaginary part of the MRS signal includes some undershoots (Negative peaks) which makes the basic SCSA unsuitable for denoising complex MRS. In this work, an extension of the SCSA algorithm is proposed to denoise both real and imaginary parts of the MRS signals, which uses a soft threshold to optimally reduce the noise while preserving the metabolites.Material and Methods
1. The Dataset
Several single voxel spectroscopy in vivo data from frontal lobe region are collected from a healthy volunteer, using the following parameters: TE/TR=30/2000ms, 1024 points, 2500Hz bandwidth. The voxel size is set to 20 × 20 × 20 mm3 and the numbers of averages (Nex) are varied from 2 to 16. The SCSA method is applied to reduce the noise contribution prior to quantification of Choline (Cho), Creatine (Cr), Lactate (Lac), N-Acetyl-Aspartate (NAA) metabolite peaks and the calculations of NAA/Cr and Cho/Cr, and Lac/Cr ratios.
2. The SCSA Method
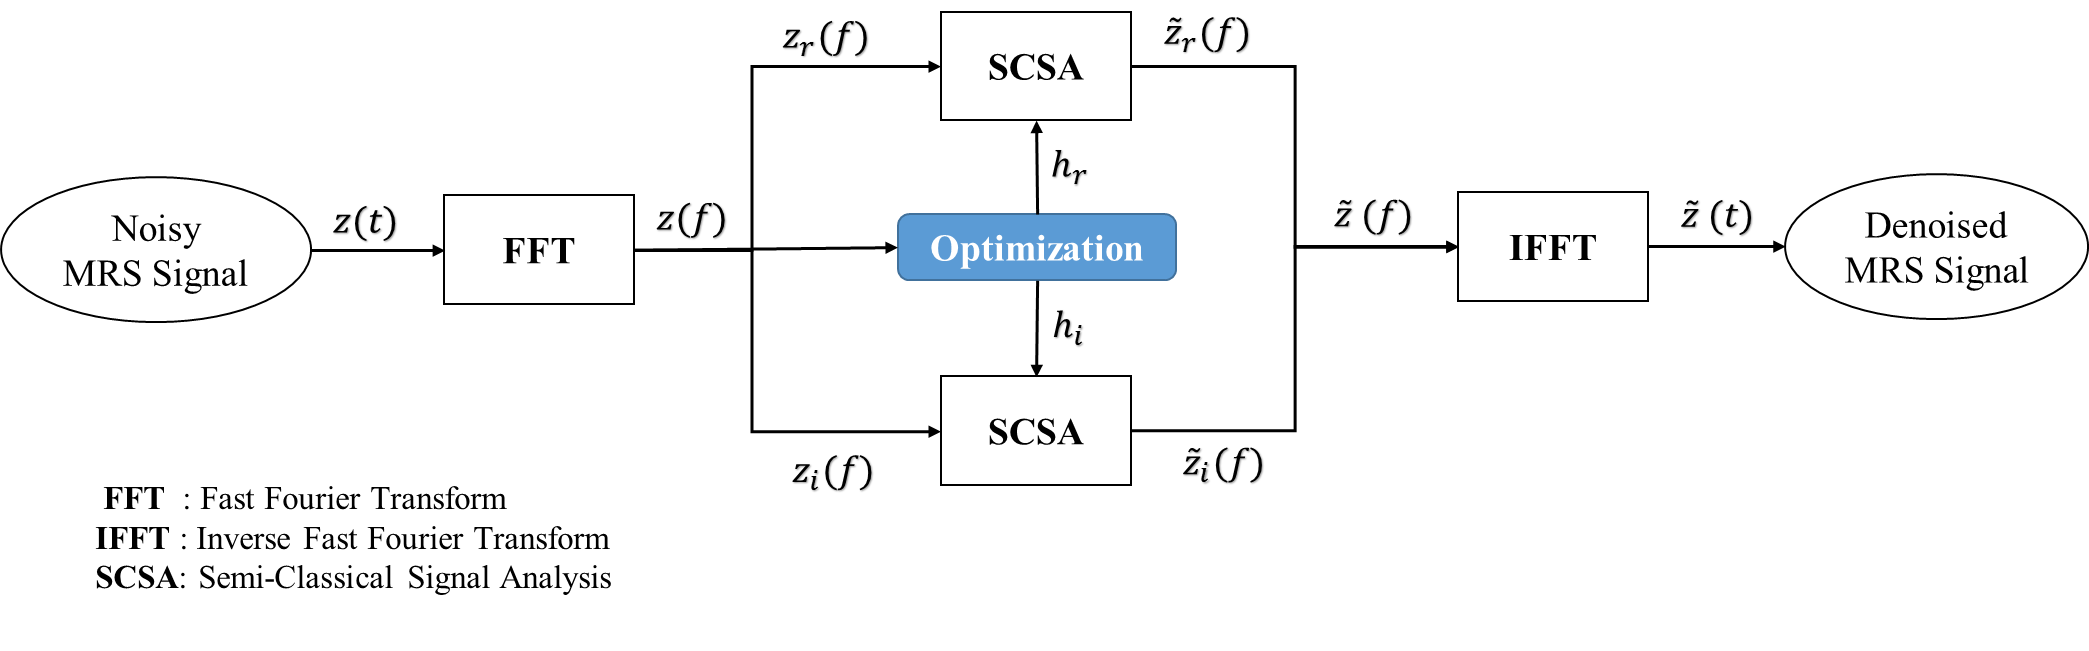
The noisy MRS $$$z(f)$$$ spectrum is first split into the real part $$$z_r(f)$$$ and imaginary part $$$z_i(f)$$$ . Each of these two signals is considered as potential of a Schrödinger operator of the eigenvalue problem defined as follows: \begin{equation} -h_l^2 ~\dfrac{d^{2} \psi(f)}{df^{2}} - z_l(f)\psi(f)~=~ \mu \psi(f) \end{equation}
where $$$h_l>0$$$ i, $$$ l=\{r, i\} $$$ defines the real part $$$z_r(f)$$$ and the imaginary part $$$z_i(f)$$$ of the MRS signal respectivelly.
The denoised MRS signal $$$z_{h}(f)$$$ is given by:
\begin{equation} z_{h}(f) =z_{r,h}(f) + i ~z_{i,h}(f) \end{equation}
such that :
\begin{equation} z_{r,h}(f) = 4h_r \displaystyle \sum_{k=1}^{N_{r,h}} \sqrt{\left(-\mu_{r,kh} \right)}~ {\psi}^{2}_{r,kh}(f) ~ ~~~\mbox{ and } ~~~~ z_{i,h}(f) = 4h_i \displaystyle \sum_{k=1}^{N_{i,h}} \sqrt{\left(-\mu_{i,kh} \right)}~ {\psi}^{2}_{i,kh}(f) \end{equation}
where $$${\mu}$$$ and $$${\psi(f)}$$$ refer to the negative eigenvalues and associated $$$L^2$$$-normalized eigenfunctions of the Schrödinger operator respectively.
3.The soft thresholding
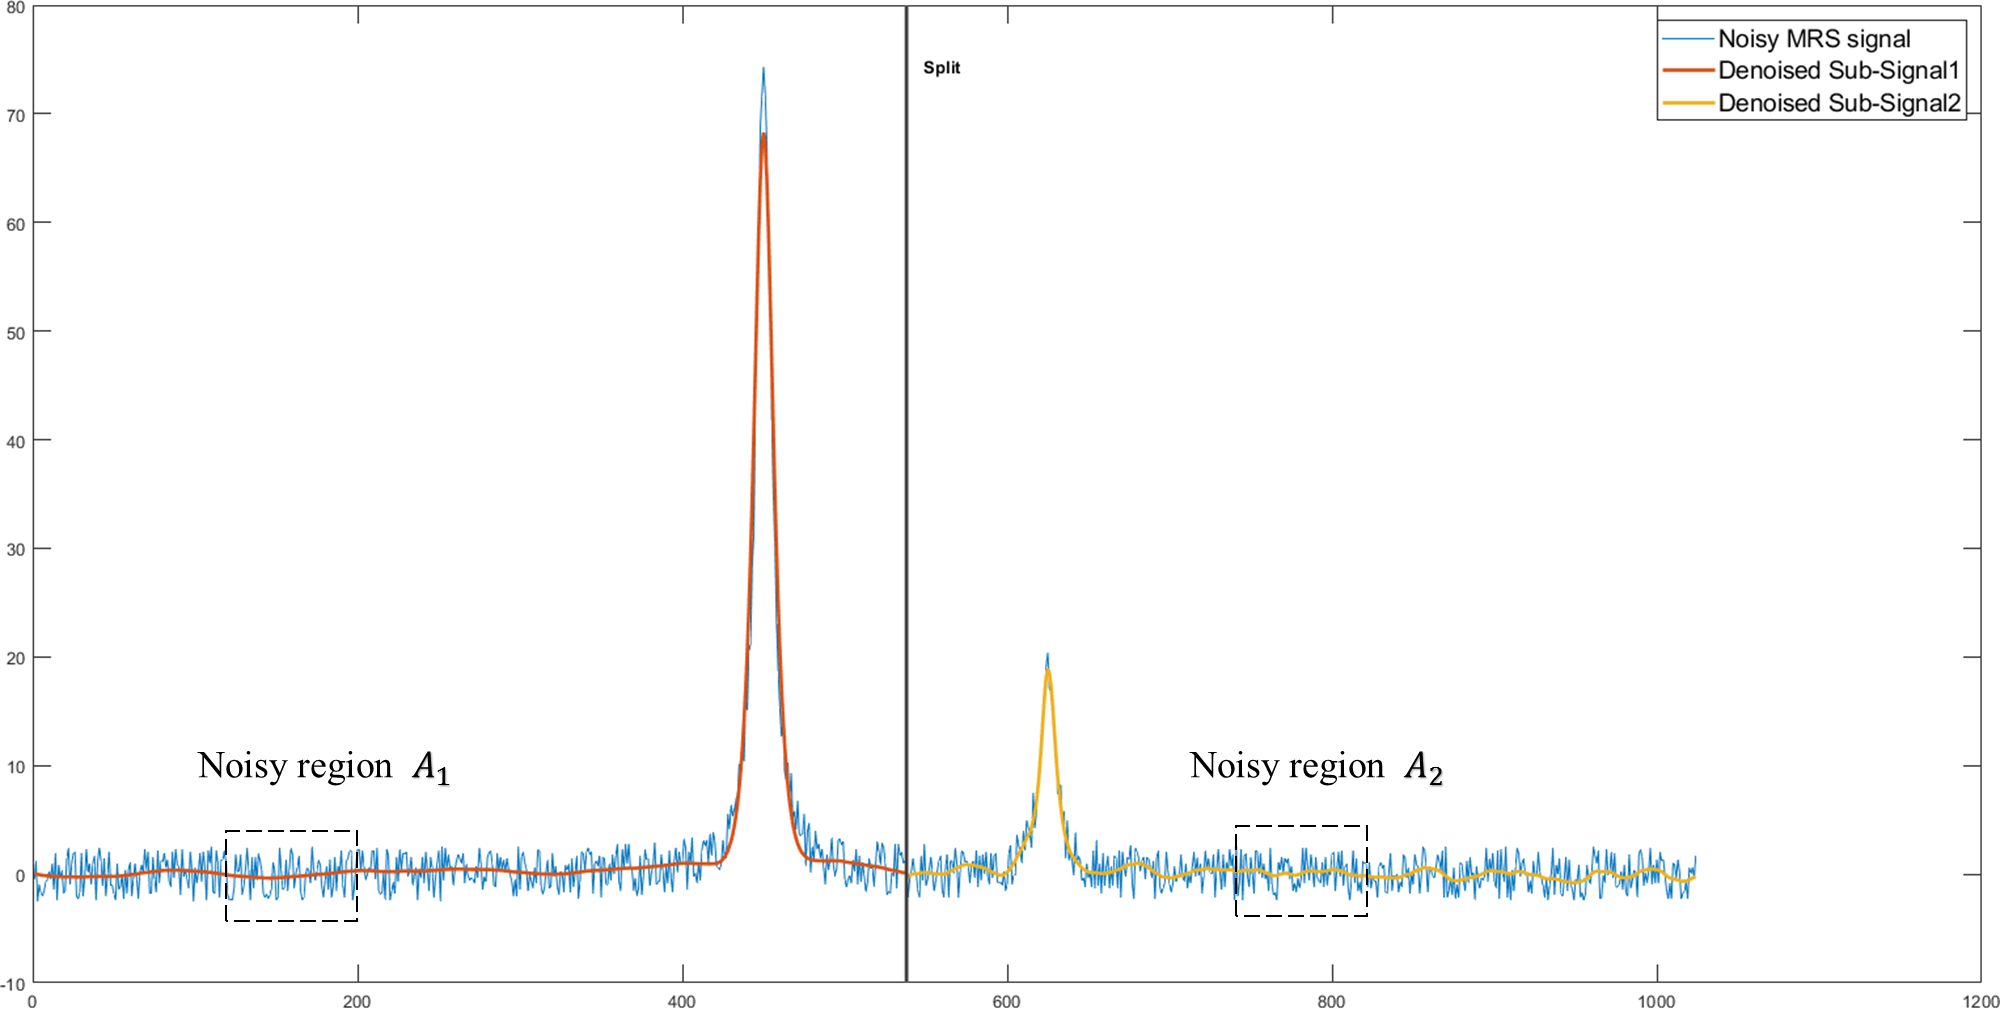
The objective of this work is to find optimal values for the parameters $$$h_i$$$ and $$$h_r$$$ for efficient denoising. Therefore, an optimization-based thresholding is used with an adaptive selection of the optimization parameters depending on the shape of the signal and the number of peaks in the signal. This optimization is based on three steps:
- Detect the location of the positive and negative peaks,
- Split the signal into a set of smaller signals such that each has one or two peaks (see Figure 2),
- Denoise each sub-signal alone by minimizing the cost function $$$J(h)$$$.
For instance, the cost function to find the optimal semi-classical paramter $$$h_i$$$ and $$$h_r$$$ for a specific split of the real or imaginary part is defined as follows :
\begin{equation}\label{eig_selection} J(h)=\begin{cases}\dfrac{STD\left(~\dfrac{d^{2} z_{l,h}(f_A)}{df^{2}}~\right)}{STD\left( ~\dfrac{d^{2} z_{l}(f_A)}{df^{2}}~\right) }~~~~~,~~~~&\mbox{if}~\rho<C\\ \infty &\mbox{ elsewhere}\end{cases} \end{equation}
where $$$ l=\{r, i\} $$$ . $$$f_A \in A $$$, where A is an interval that describe the noisy zone. The STD refers to the STandard Deviation. $$$C$$$ is themaximum threshold allowed for peak attenuation defined as:
\begin{equation} \rho=\dfrac{|max(z_{l,h}) -max(z_{l}) |}{|max(z_{l}(f)| } \end{equation}
Results and Discussion
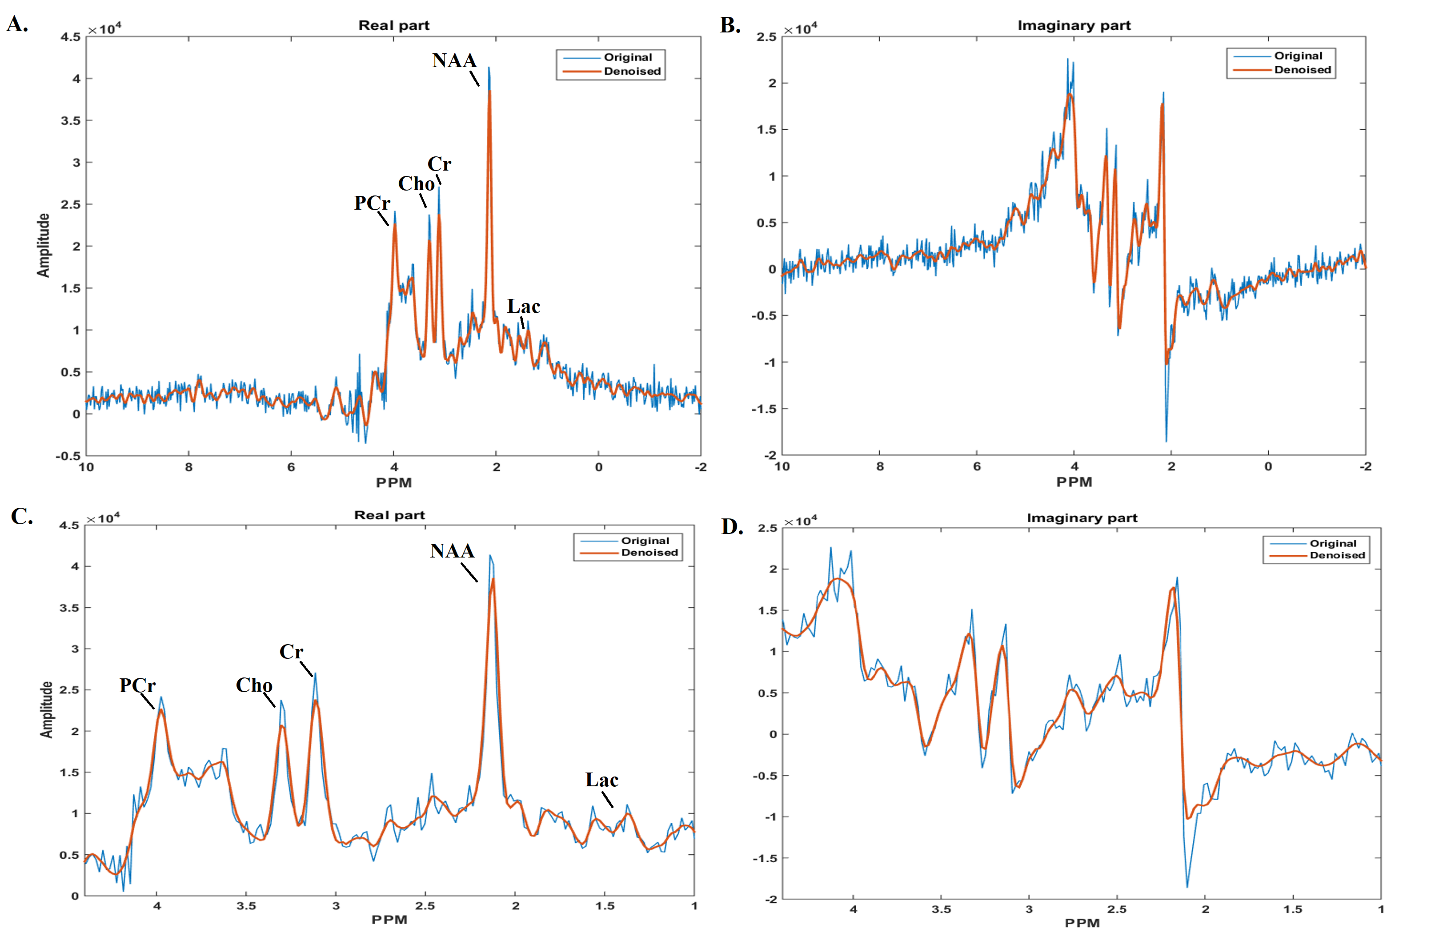
The proposed SCSA with soft-thresholding has been tested on localized MRS in vivo data. As shown in the result with Nex=4 (Figure3), the proposed SCSA efficiently reduces noise while preserving the metabolite peaks. Figure 3A shows the comparison of real parts of the original (blue) and the de-noised (red) spectra along with zoomed metabolite region shown in Figure 3C. Figure 3B displays the comparison of imaginary parts of the original (blue) and de-noised (red) spectra and zoomed metabolite region shown in Figure 3D.
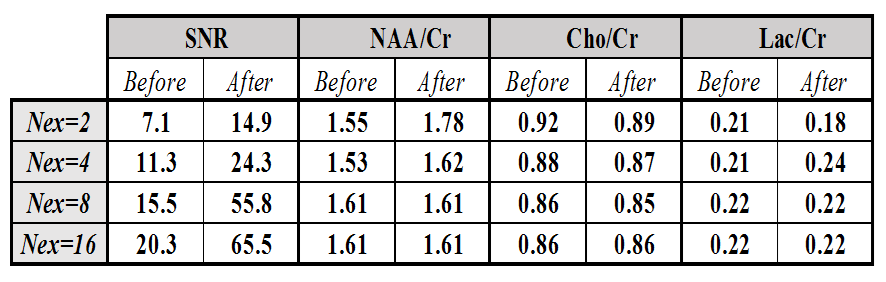
The quantification results in terms of SNR, computed as the ratio of NAA peak area to the standard deviation of noise, and the metabolite ratios before and after de-noising are shown in given in Table1. The AMARES [4] peak fitting method is used for the analysis of the NAA, Cr, Cho, and Lac peaks. The results show considerable improvement in the SNR and accurate metabolite ratios after denoising compared to the literature [5].
Conclusion
The new SCSA method with adaptive thresholding achieves efficient MRS signal denoising while preserving the metabolite peaks, demonstrated by the efficient noise reduction and metabolites preservation. The obtained results are very encouraging and show the potential of the SCSA with thresholding for general pulse-shaped signal denoising.Acknowledgements
Research reported in this publication was supported by King Abdullah University of Science and Technology (KAUST).References
1. Pijnappel W, Van den Boogaart A, De Beer R, Van Ormondt D. SVD-based quantification of magnetic resonance signals. Journal of Magnetic Resonance(1969). 1992;97(1):122–134.
2. Laudadio T, Mastronardi N, Vanhamme L, Van Hecke P, Van Huffel S. ImprovedLanczos algorithms for blackbox MRS data quantitation. Journal of magneticresonance (San Diego, Calif : 1997). 2002;157:292–7.
3. Laleg‐Kirati TM, Zhang J, Achten E, Serrai H. Spectral data de‐noising using semi‐classical signal analysis: application to localized MRS. NMR in Biomedicine. 2016 Oct;29(10):1477-85.
4. Vanhamme L, van den Boogaart A, Van Huffel S. Improved method for accurateand efficient quantification of MRS data with use of prior knowledge. Journal of Magnetic Resonance. 1997;129(1):35–43
5. Safriel Y, Pol-Rodriguez M, Novotny EJ, Rothman DL, Fulbright RK. Reference values for long echo time MR spectroscopy in healthy adults. American journal of neuroradiology. 2005 Jun 1;26(6):1439-45.
Figures