4676
Super-resolution based on the Signal Extrapolation in Phase scrambling Fourier Transform Imaging using Deep Convolutional Neural Network1Utsunomiya University, Utsunomiya, Japan
Synopsis
The signal obtained in phase scrambling Fourier transform imaging can be extrapolated beyond sampling length after data acquisition like Half-phase encoding method. To realize the method for phase varied images, precise phase distribution map is required. In this paper, a new post-processing super resolution in PSFT imaging is proposed in which deep convolution neural network (CNN) is used and phase map is not required. Simulation and experimental results showed that spatial resolution was fairly improved with signal extrapolation and the improvement of spatial resolution is proportional to the strength of phase scrambling coefficient.
Introduction
The signal in phase scrambling Fourier transform imaging (PSFT) [1] can be described as Fourier transform of amplitude-modulated spin density distribution. Therefore, PSFT signal can be extrapolated in k-space by using the real-value constraint of object function [2,3] and as a results spatial resolution can be fairly improved with post processing image processing. However, this method requires precise spatial phase distribution map to correct phase on the image and also requires iterative reconstruction. In this work, more practical and faster processing in which super-resolution is executed quickly using deep convolutional neural network.Method
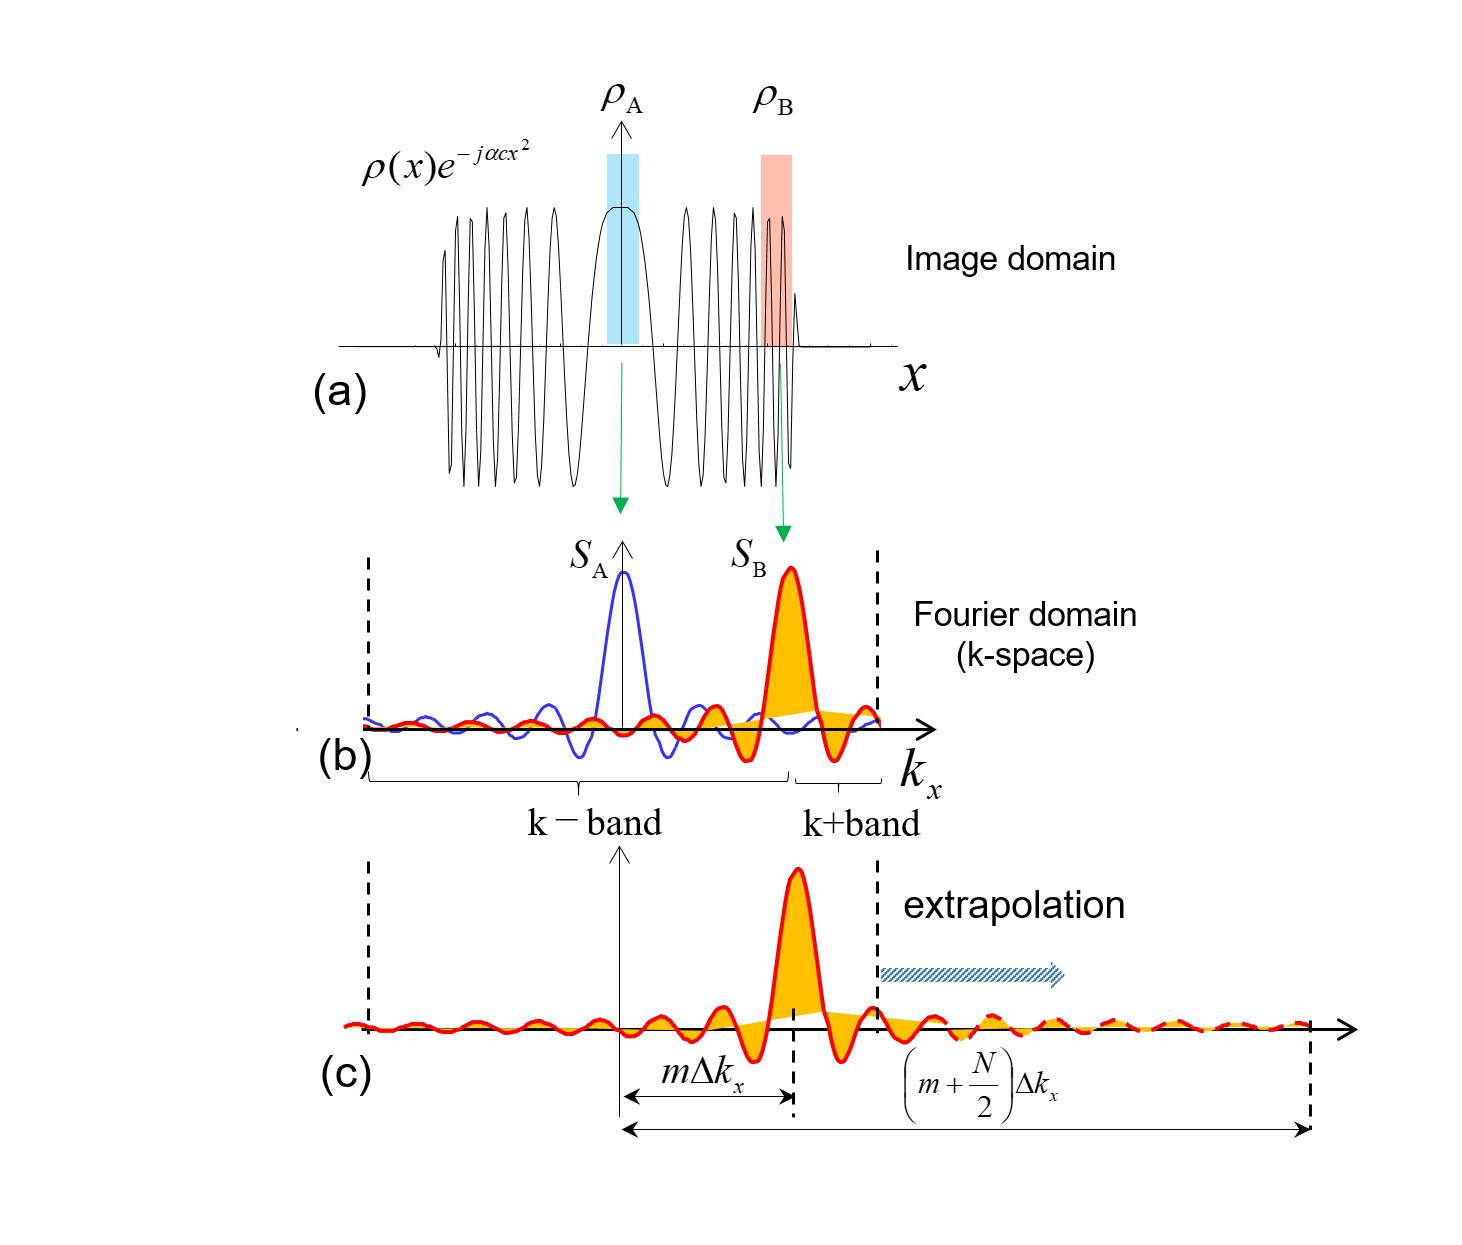
Phase-scrambling Fourier transform imaging (PSFT) is described as Eq.(1),
$$v(k_x,k_y)= \int \hspace{-2.0mm} \int^{\infty}_{-\infty} \left\{ \rho(x,y) e^{-j c (x^2+y^2)} \right\} e^{-j(k_x x+k_y y)}dxdy ...(1),$$ $$ = \int \hspace{-2.0mm} \int^{\infty}_{-\infty} \left\{ \rho(x,y) e^{-j \{a_1(x) x+a_2(y) y\} } \right\} e^{-j(k_x x+k_y y)}dxdy ...(2),$$ $$ a_1(x) = c x, a_2(x)=c y ...(3), $$
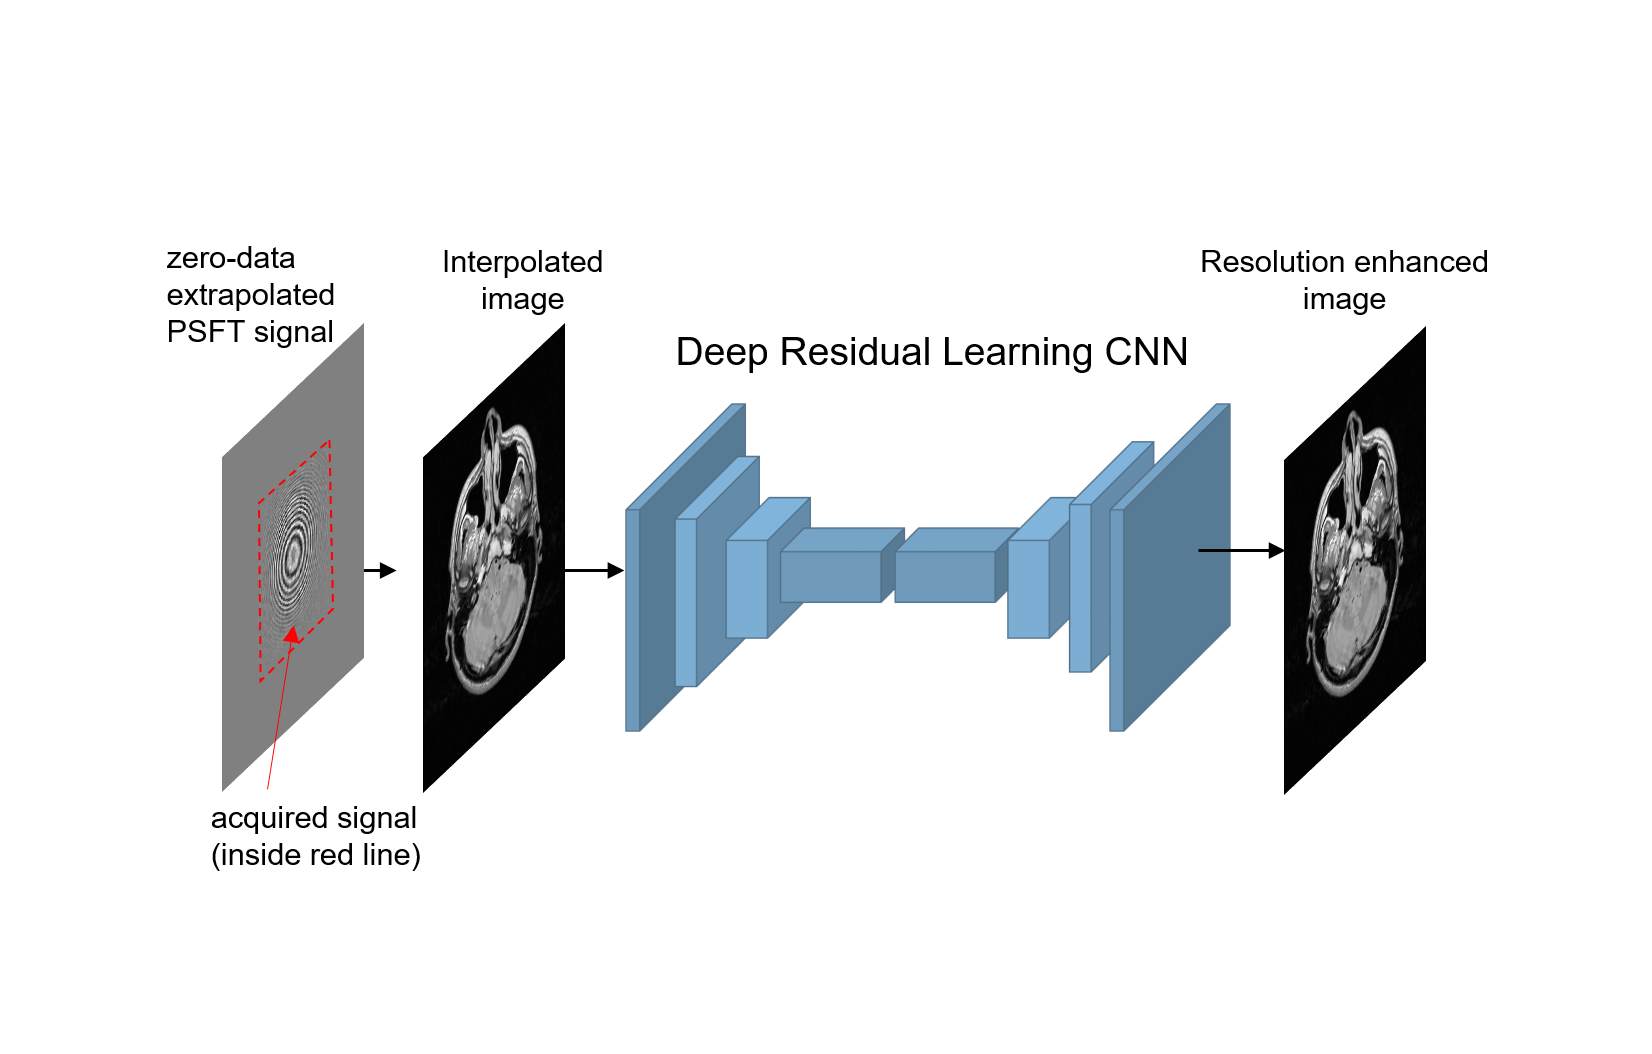
where $$$\rho(x,y)$$$ represents the spin density distribution in the subject, $$$c$$$ is the coefficient of quadratic phase shifting [1]. Eq.(1) can be rewritten as Eq.(2), in which amplitude of $$$\rho(x,y)$$$ is modulated by $$$ \exp{-j \{a_1(x) x+a_2(y) y\} }$$$. Consider small segmented image $$$\rho_B$$$ as shown in Fig.1, then spatiotemporal frequency $$$a_1(x), a_2(y)$$$ can be approximated as a constant in a small segment. Amplitude modulation to $$$\rho_B$$$ makes its Fourier spectrum $$$S_B$$$ shift in accordance with the modulation frequency. Since spectrum $$$S_B$$$ has asymmetric frequency band for k+ and k- directions, and one of which has wider frequency band from the peak of $$$S_B$$$ compared to standard spectrum of $$$S_A$$$, obtained image corresponding to $$$\rho_B$$$ has higher spatial resolution than image $$$\rho_A$$$. In this work, we propose a new faster imaging method in which super-resolution is executed without using phase distribution map. Figure 2 show the scheme of this work. Interpolated images are calculated using zero-data extrapolated PSFT signals, and obtained images are used as input images to convolutional neural network (CNN). We adopted Deep residual learning CNN [4] which is known as high excellent denoising performances.
Results & Discussions
Simulation
experiments were performed by calculating PSFT signal according to the Eq. (1) using
the MR volunteer image. PSFT signals with 128x128 matrix size were calculated and then extrapolated
to be 256x256 by filling the zero data. The structure of CNN network is as
follows; depth: 17, receptive field size: 35, 17 layer, filter size: 3x3x64.
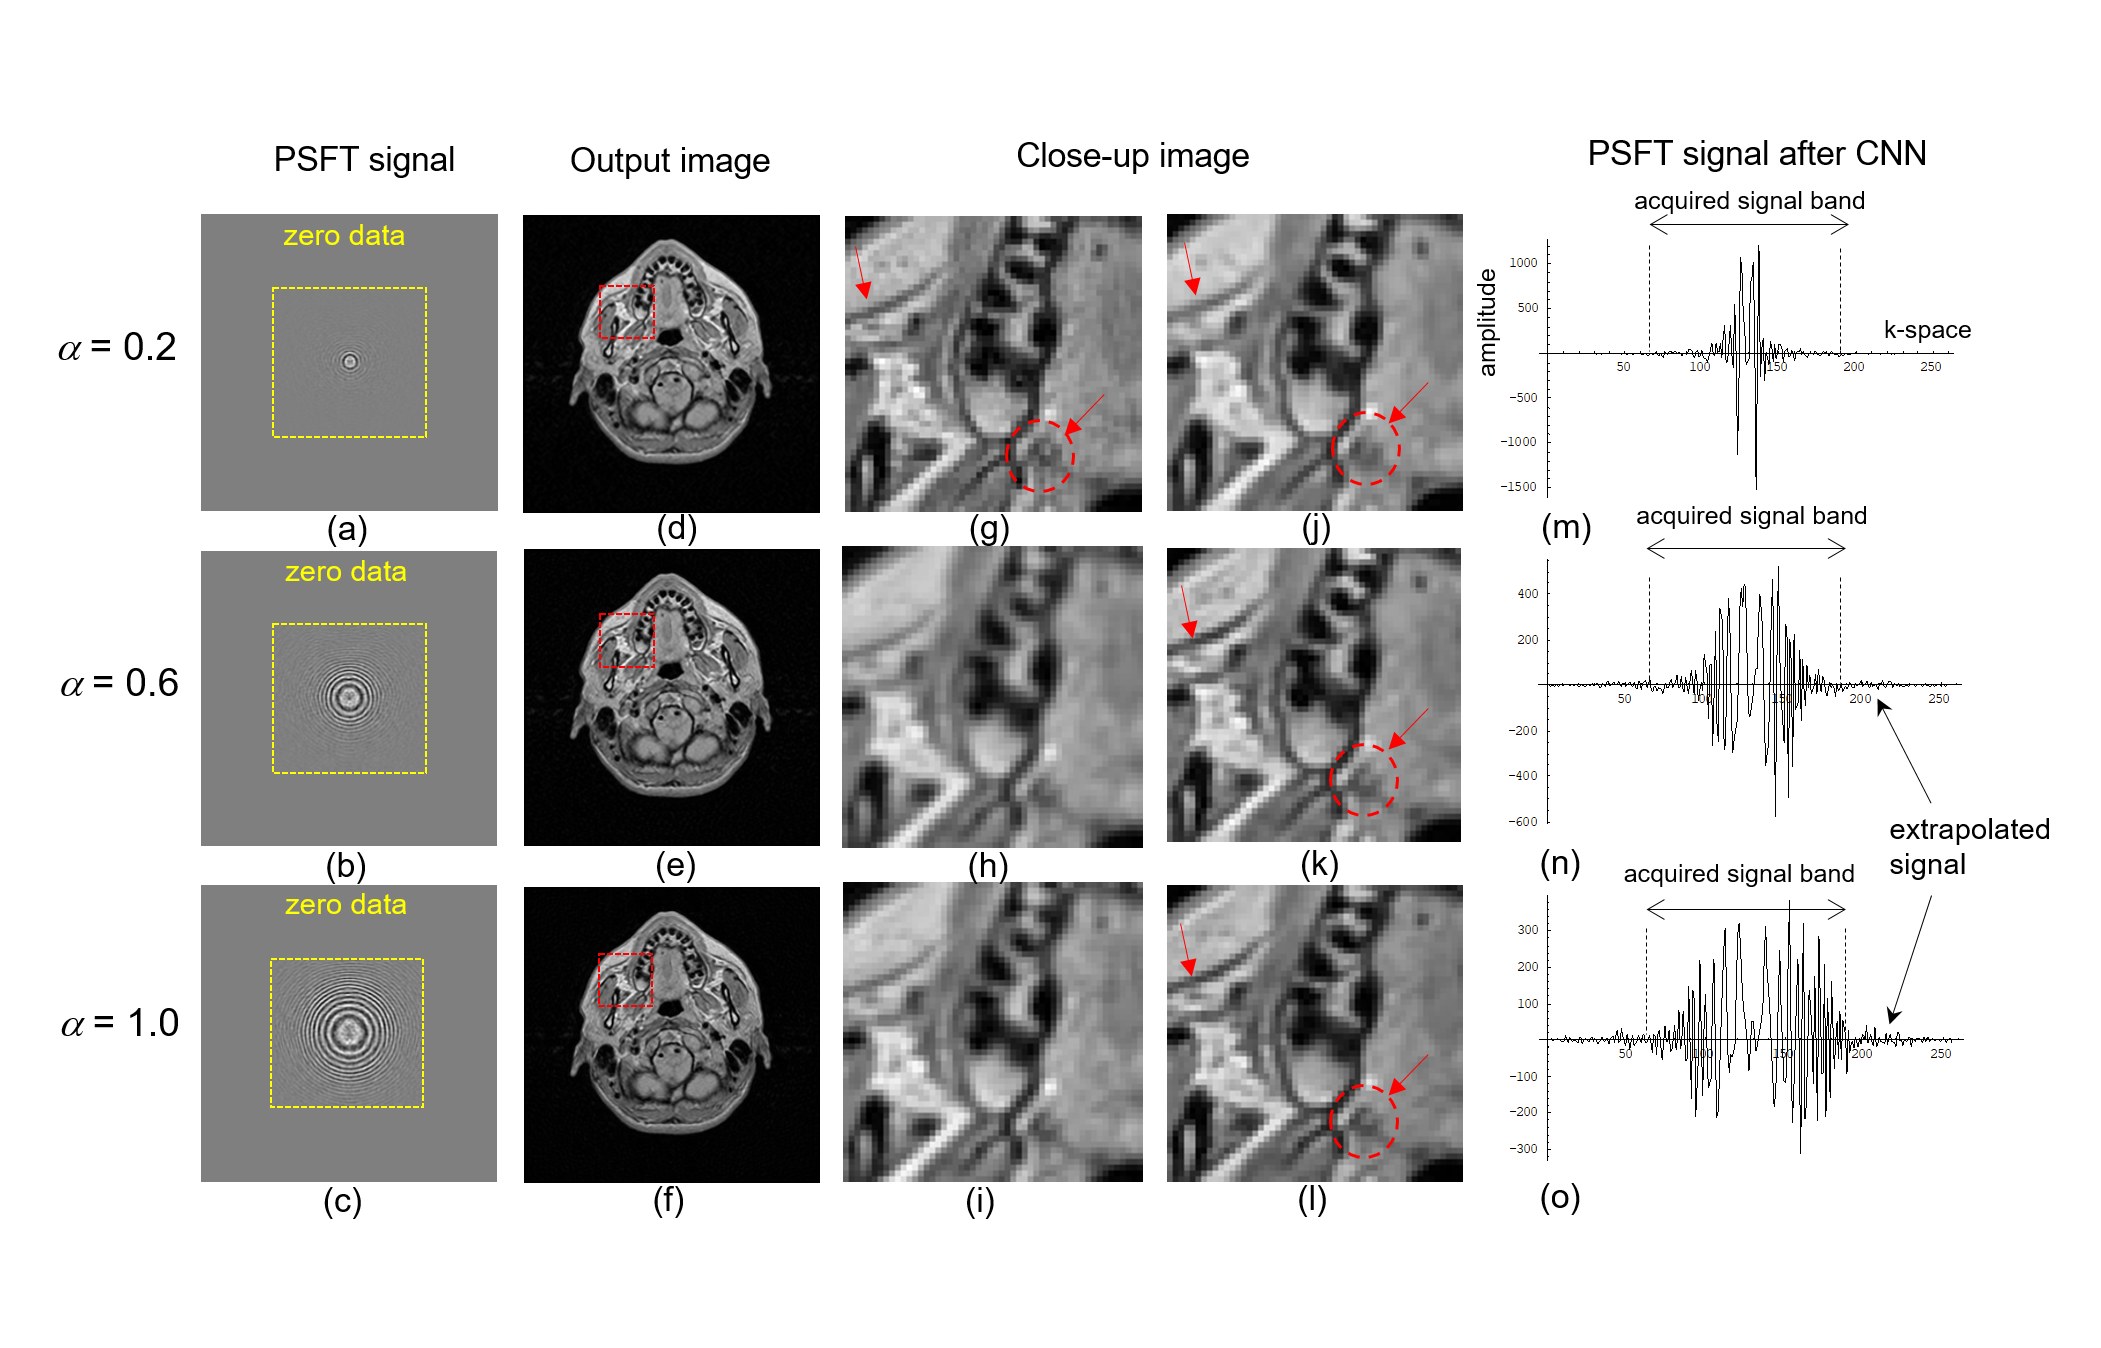
Figure 3 shows the results for $$$\alpha$$$=0.2, 0.6 and 1.0. Figures (j), (k),
(l) are close-up images of (d),(e),(f) respectively.
Figure
3(g) is the gold standard fully scanned image, (h) is the initial image by
applying inverse Fourier transform (IFT) to signal (c), and (i) is the
sharpened image of (h) by applying the unsharp masking. Comparing (i) and (l),
much more sharpened and much more structured image is obtained in (l), so, CNN
plays not only is enhance sharpness but also extrapolate the signal bandwidth. Comparing
image (j), (k) and (l) with pointed region by red arrow, structure of image is
much more enhanced as $$$\alpha$$$ increases. Figures (m), (n), (o) shows 1-dimentional
PSFT signal corresponding to image (j), (k), (l). It was shown that signal
exists beyond the sampling
width of acquired signal and the signal length of extrapolated signal become wider
as $$$\alpha$$$ increases.
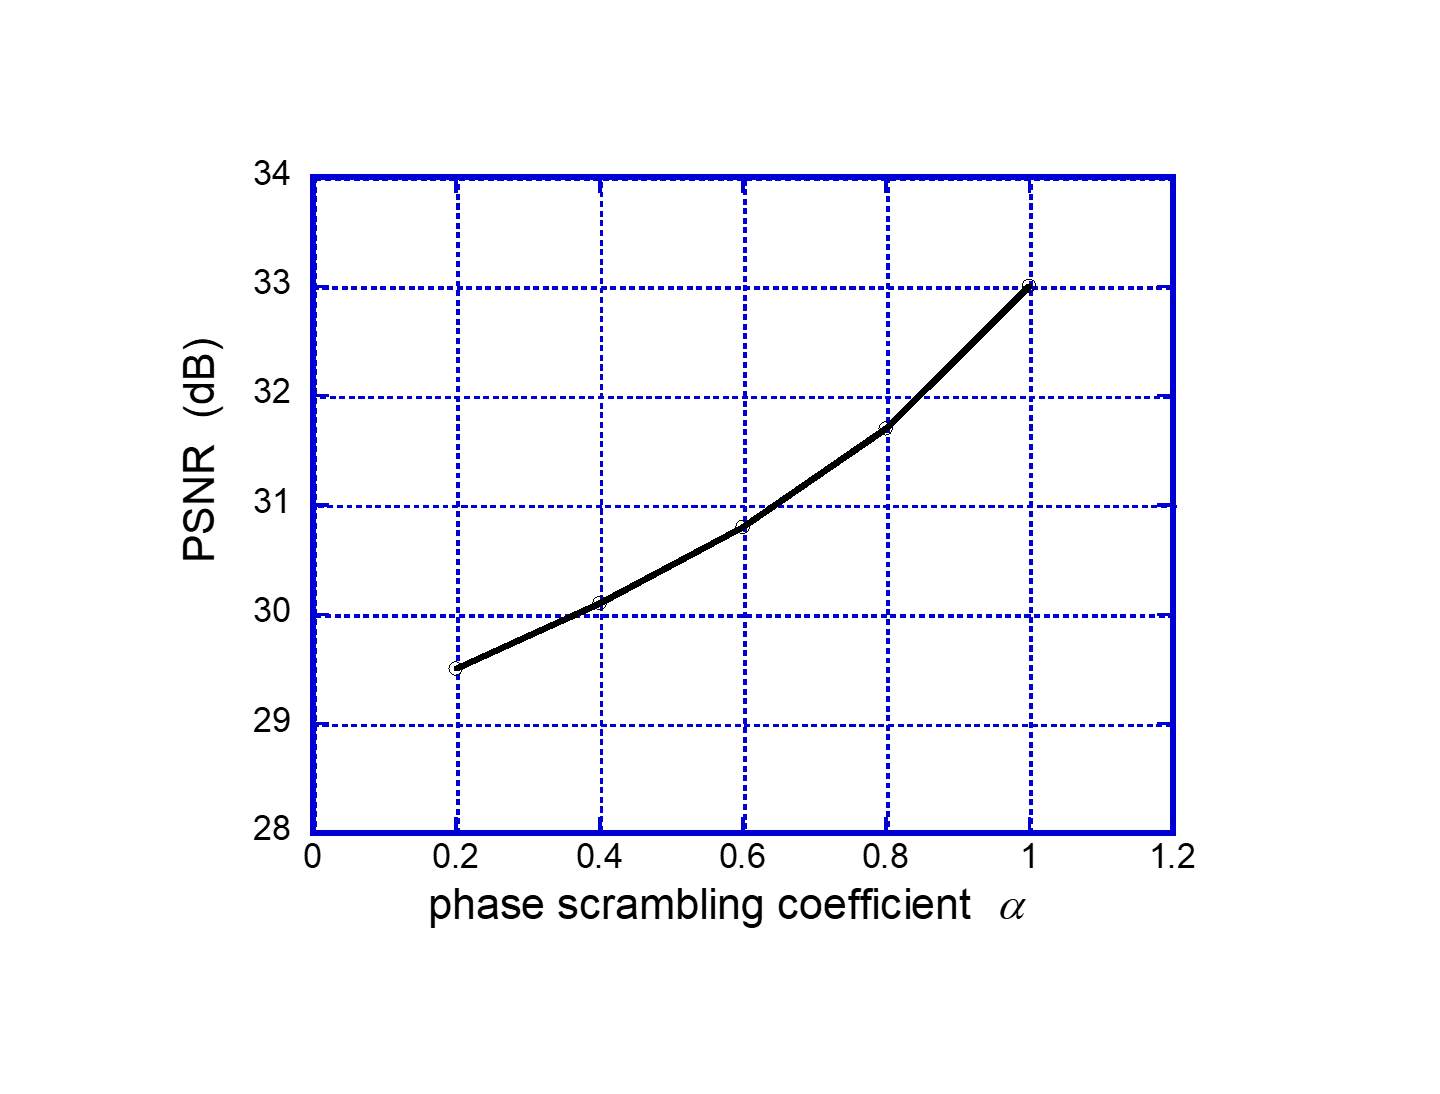
Figure
4 shows the relation of PSNR improvements with reference to phase scrambling
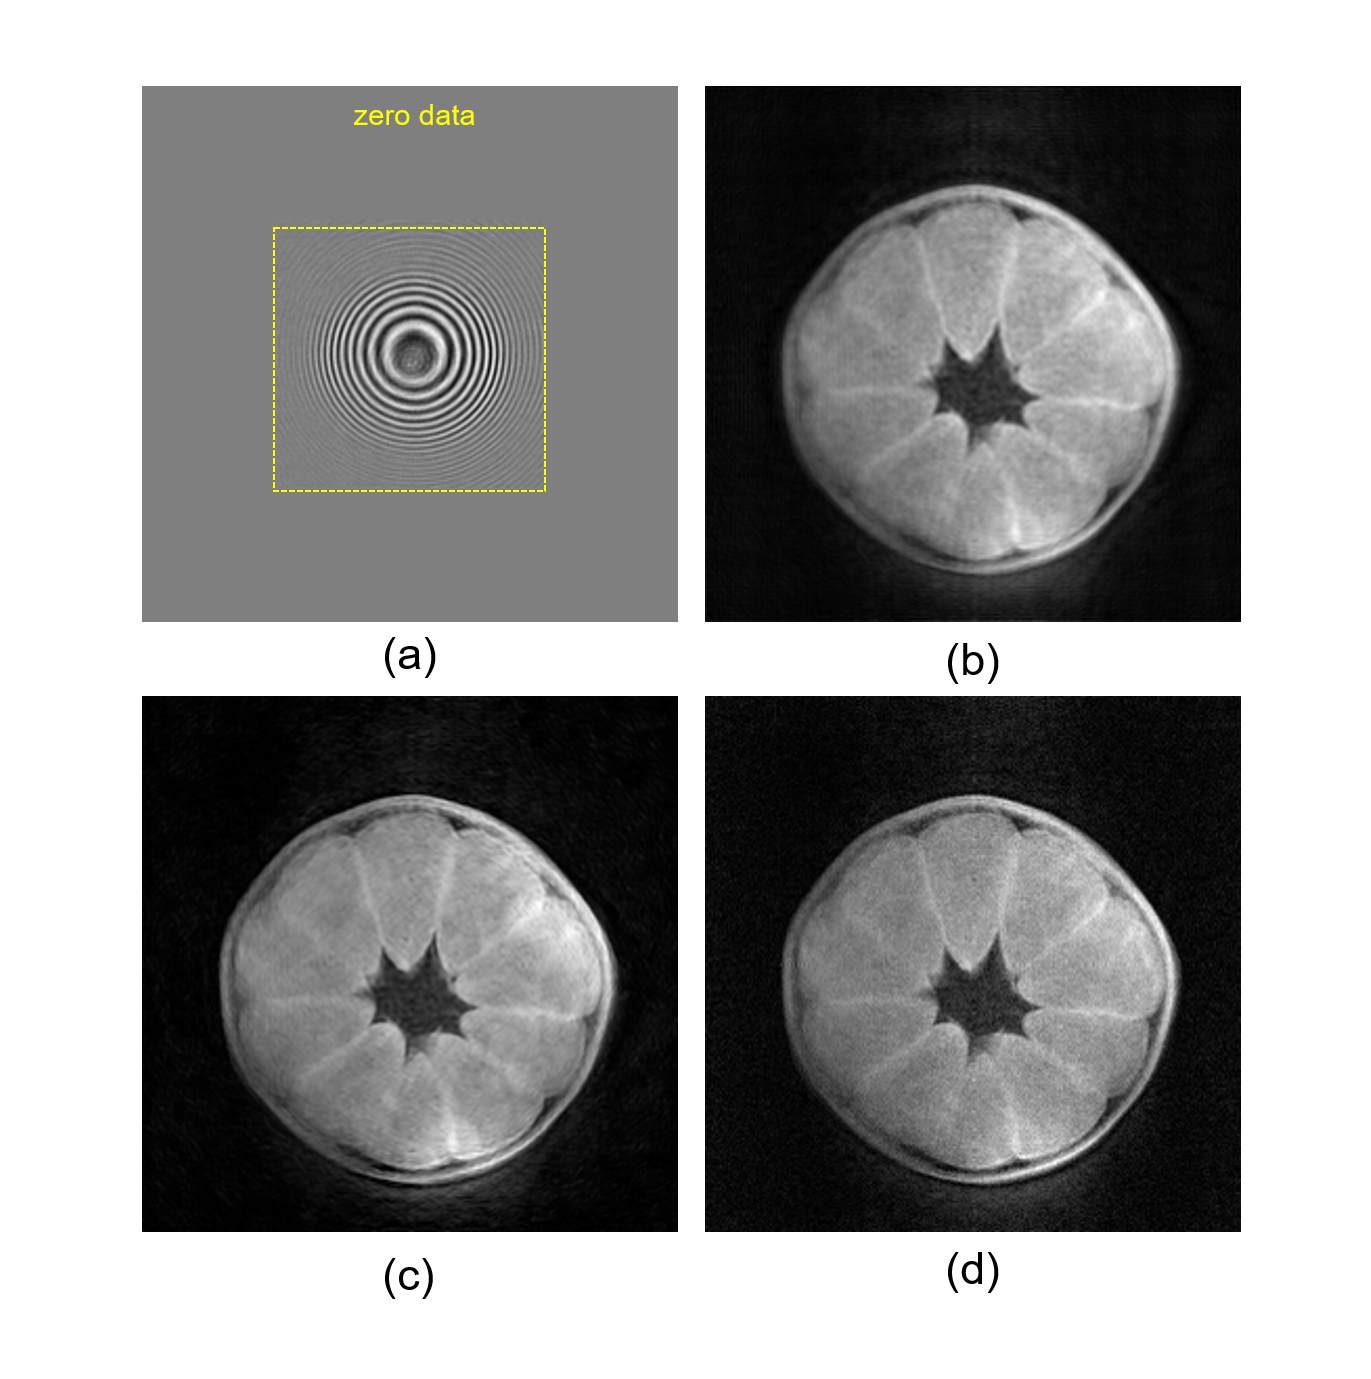
coefficient $$$\alpha$$$. Figure 5 shows the results of application to
experimentally obtained PSFT signal using 0.2T prototype MRI, Quadratic phase
scrambling was given by quadratic field gradient. Imaging conditions and matrix
size are same as Fig.3(c). Figure 5(b), (c), (d) are simple IFT image, obtained
image in propose method, fully scanned image, respectively. Higher resolution compared
to image (b) was obtained in image (c). The drawback of proposed method is that
improvement of spatial resolution is not uniform on the image; maximum improvement is expected in peripheral region
and minimum at center of image domain. The advantages are as follows; 1) under
sampling is not adopted as is used in compressed sensing, therefore sampling
and reconstruction are rather straightforward, except CNN learning, 2) phase map
is not necessary which increase the practical usefulness of proposed method.
Compressed sensing shortens the imaging time by under-sampling signal, whereas proposed method
shorten the time by acquiring asymmetric band-limited signal and extrapolating
the signal to be symmetric band-limited signal.
Conclusion
A new MR super-resolution method using modified Fourier transform imaging and CNN is proposed. Proposed method uses CNN for extrapolating bandwidth of k-space signal. Promising results was demonstrated in simulation and experiments.Acknowledgements
This study was supported in part by JSPS KAKENHI(16K06379). We would like to thank Canon Medical Systems.References
- Maudsley AA., Dynamic Range Improvement in NMR Imaging Using Phase Scrambling. J Magn Reson 1988; 76, 287-305.
- Ito S, Liu. N, Yamada Y, Improving Super-resolution by adopting Phase-scrambling Fourier Imaging. ISMRM2007, 1907, Berlin, Germany
- Ito S, Liu. N, Yamada, Improvement of Spatial Resolution in Magnetic Resonance Imaging Using Quadratic Phase Modulation. IEEE International Conference on Image Processing 2009; 2497-2500, Cairo, Egypt
- Zhang K,Zuo W,Chen Y et al: Beyond a Gaussian Denoiser: Residual Learning of Deep CNN for Image Denoising. IEEE Tran Image Proc 2017; 26, 3142-3155
Figures