4674
Robust R1rho asymmetry performed with optimal B1 selection1Department of Imaging and Interventional Radiology, The Chinese University of Hong Kong, Hong Kong, Hong Kong
Synopsis
The measurement of R1rho (1/T1rho) spectrum and its asymmetry have several advantages over Chemical Exchange Saturation Transfer (CEST) and Chemical Exchange Spin-lock (CESL). It is recently becoming one of the important approaches for probing the chemical exchange process. In this work, we demonstrated the advantage of R1rho asymmetry over
Introduction
Chemical exchange spin-lock (CESL) has been used to study the endogenous chemical exchange process. It is shown that compared to chemical exchange saturation transfer (CEST), CESL is more sensitive to metabolites at intermediate-fast exchange regime1,2. Conventional CESL was performed using hard excitation pulses which are prone to B1 RF and B0 field inhomogeneities. Robustness of CESL can be improved by using previously reported adiabatic pulse3, we called it adiCESL. However, its robustness is still limited. The adiCESL can only detect metabolites which have chemical shift 2 times larger than B0 inhomogeneity. Recently, R1rho asymmetry is investigated and used to probe metabolites4,5. In this work, we will use simulations and phantom experiments to demonstrate the unique advantage of R1rho asymmetry over adiCESL, and an optimal B1 prediction that gives the highest R1rho asymmetry signal.Methods
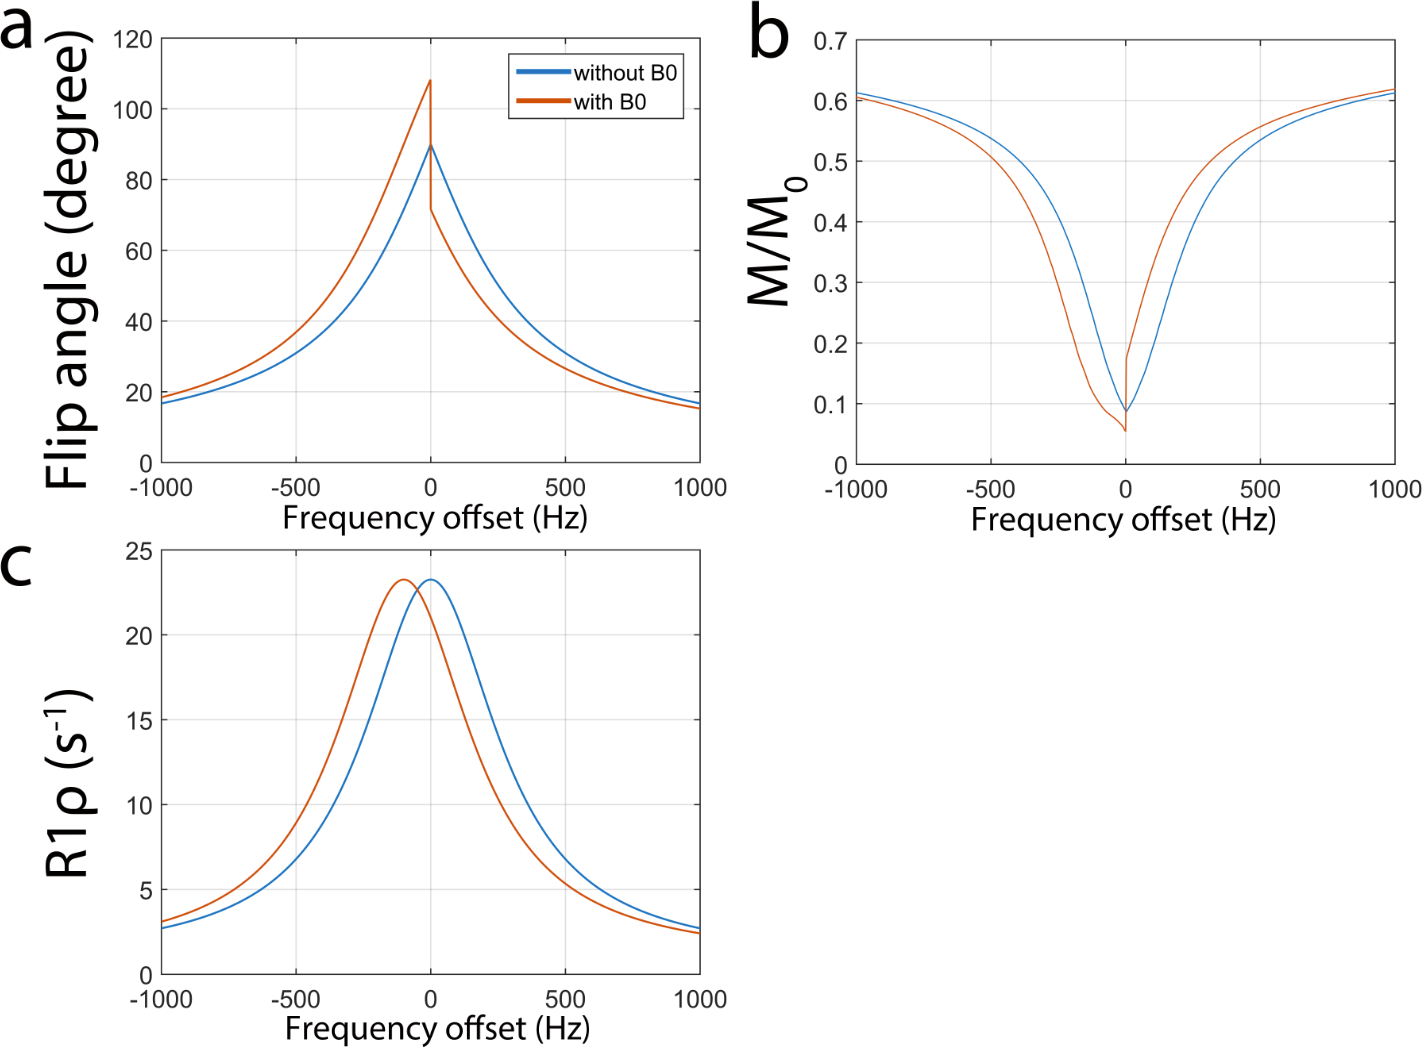
When performing adiCESL, it can be shown that spins will be effectively locked by the effective spin-lock field at an angle $$$\theta$$$ defined previously3, if the adiabatic condition is satisfied. Note adiCESL still fails if B0 field inhomogeneity is significant. Figure 1 shows the Bloch simulation of adiCESL. Due to the asymmetry of the flip angle caused by B0 inhomogeneity, the z-spectrum calculated from adiCESL shows discontinuity. The signal within the frequency offset (FO) range of total $$$2\times B0$$$ is affected. This leads to two problems: 1) adiCESL is unable to detect metabolites with chemical shift smaller than $$$2\times B0$$$ inhomogeneity; 2) fitting of z-spectrum becomes difficult due to its discontinuity. In contrast, B0 inhomogeneity only results in a shift equal to an off-resonance frequency in R1rho-spectrum. Therefore, the R1rho-spectrum and asymmetry do not suffer from these problems (Figure 1c).
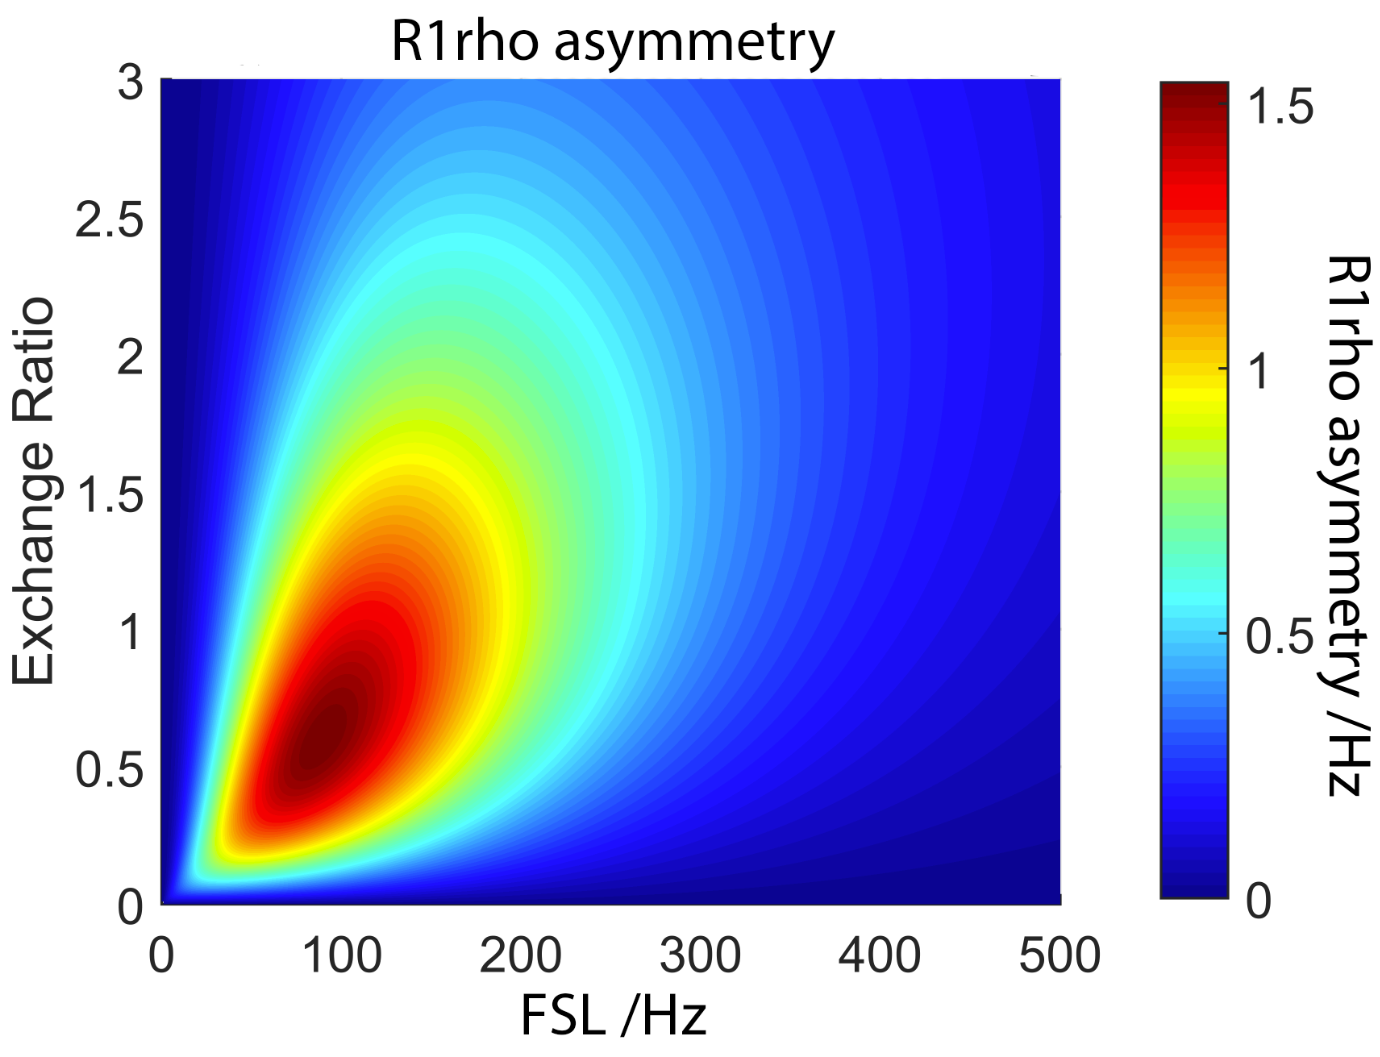
R1rho is a function of frequency of spin-lock (FSL) and chemical exchange ratio (defined as $$$\frac{k}{2\pi \delta }$$$, where k is the chemical exchange rate and $$$\delta$$$ is the chemical shift). The relationship of R1rho with FSL and chemical exchange ratio can be predicted based on a previously reported R1rho model2:$$R_{1\rho}(FO)=R_{1}\cdot cos^{2}(\theta)+(R_{2}+R_{ex})\cdot sin^{2}(\theta), [1]$$$$R_{ex}\approx \frac{4\pi^{2}\cdot P_{s}\cdot k\cdot \delta ^{2}}{4\pi^{2}(\delta -FO)^{2}+4\pi^{2}FSL^{2}+k^{2}}, [2]$$where $$$P_{s}$$$ denotes the population ratio of labile proton to water proton. Using above equations, R1rho asymmetry can be calculated by:$$R_{1\rho asym}=R_{1\rho}(FO)-R_{1\rho}(-FO), [3]$$Figure 2 shows the R1rho asymmetry map as a function of FSL and chemical exchange ratio. Note that R1rho asymmetry has a wide range of sensitivity to chemical exchange ratio. It is particularly sensitive to metabolites with chemical exchange ratio within intermediate to fast exchange regime. Previously reported R1rho-spectrum is obtained using toggling inversion method.5 A 180-degree toggling inversion pulse is applied preceding off-resonance hard pulse spin-lock. We improved its robustness by replacing the hard excitation pulses with adiabatic pulses, ensuring the spins to be effectively locked during the spin-lock.
We performed phantom experiments to demonstrate the advantage of R1rho asymmetry over adiCESL. Two sets of phantom experiments were performed. First phantom sets are agarose phantoms of various concentrations. Second phantom sets are two tubes of 4% agarose and myo-inositol concentration 150mM and 300mM. Phantom data sets were acquired from a Philips Achieva TX 3.0T system using eight-channel head coils. 2D Fast Spin Echo was used for imaging data acquisition. Scans were performed at resonance frequency offsets from -300Hz to 300Hz with 25Hz increment. FSL used for the first phantom experiment was 150Hz. For the second phantom experiment, FSL 150Hz, 200Hz and 300Hz were used. Time of spin-lock (TSL) was 60ms. An order of 15 polynomial fitting was used to fit the R1rho-spectrum. R1rho asymmetry was calculated at 0.9ppm to 1.1ppm.
Results and Discussion
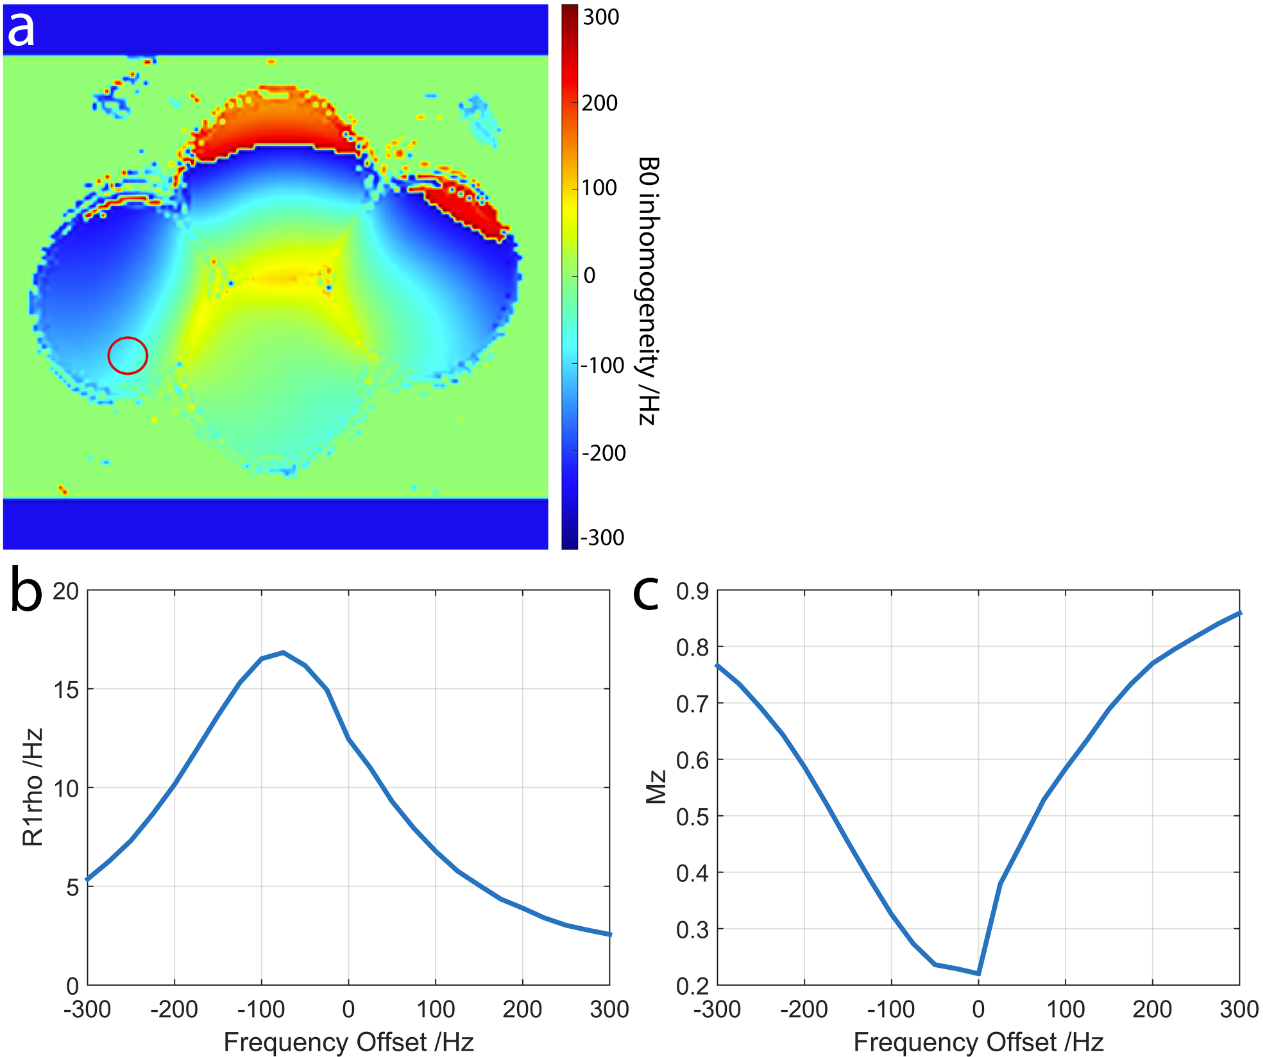
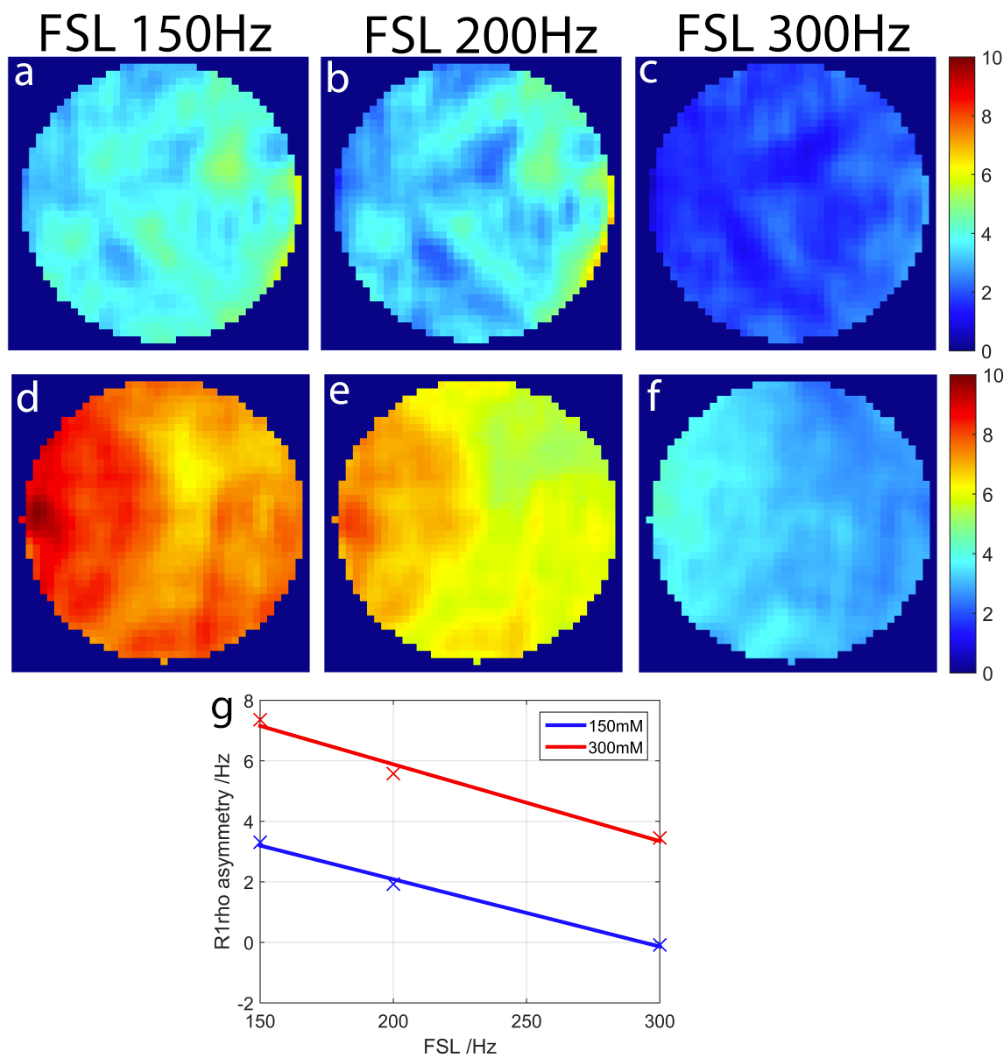
Figure 3 shows the results of the first phantom experiment. An ROI was selected on a region with reasonably large B0, indicated by red circle. Note that the R1rho-spectrum and z-spectrum show consistent patterns as our theory predicts (Figure 1). Figure 4 shows the results of the second phantom experiment. Myo-inositol has exchange ratio around 1.6. The derived optimal B1 is around 150Hz based on our analysis. It is challenging to meet the adiabatic condition at low FSL, therefore we calculated R1rho-spectrum at FSL above 150Hz. Both concentrations of myo-inositol show linear decreasing trend with increasing FSL, as predicted by our analysis.Conclusion
Our results demonstrated a unique advantage of R1rho asymmetry compared to adiCESL, and we provide an optimal B1 prediction for R1rho asymmetry.Acknowledgements
This study is supported by a grant from the Research Grants Council of the Hong Kong SAR (Project SEG CUHK02). We would like to acknowledge general support from Philips Healthcare.References
- Jin T, Autio J, Obata T, et al. Spin-locking versus chemical exchange saturation transfer MRI for investigating chemical exchange process between water and labile metabolite protons. Magnetic Resonance in Medicine. 2010;65(5):1448-1460. doi:10.1002/mrm.22721.
- Jin T and Kim S-G. Advantages of chemical exchange-sensitive spin-lock (CESL) over chemical exchange saturation transfer (CEST) for hydroxyl- and amine-water proton exchange studies. NMR in Biomedicine. 2014;27(11):1313-1324. doi:10.1002/nbm.3191.
- Jiang B and Chen W. On-Resonance and off-Resonance Continuous Wave Constant Amplitude Spin-Lock and T1ρ Quantification in the Presence of B1 and B0 Inhomogeneities. NMR in Biomedicine, 2018, 31(7), doi:10.1002/nbm.3928.
- Ling W, Nicholls, F. J, Jin T, et al. Selective Detection of Chemical Exchange Specific R1rho by iTIP gagCEST. ISMRM 2014.
- Jin T, and Kim S-G. Quantitative Chemical Exchange Sensitive MRI Using Irradiation with Toggling Inversion Preparation. Magnetic Resonance in Medicine, 2012, 68(4), pp. 1056–1064., doi:10.1002/mrm.24449.
Figures