4672
Optimize Wave-CAIPI MPRAGE protocol for the study of Short-term Apparent Change (SAC) of Grey Matter in Motor Training1Department of Medical Radiation and Nuclear Medicine, Karolinsak University Hospital, Huddinge, Sweden
Synopsis
To assess the extent and dynamics of short-term apparent change (SAC) of GM in motor training we investigated how the VBM results are affected by the different levels of acceleration of the MP-RAGE sequence using the wave-CAIPI technique which provides highly accelerated MPRAGE imaging and retain high image quality. The optimized wave-CAIPI MPRAGE imaging protocol overcomes the g-factor noise amplification penalty and allows for over an order of magnitude acceleration of MPRAGE imaging in VBM studies. The standard and wave-CAIPI MPRAGE sequences have different sensitivity in detecting SAC of GM likely due to their differences in noise and contrast characteristics.
Introduction
With magnetization prepared rapid gradient echo (MPRAGE) sequence the local changes in gray matter (GM) density can be assessed with voxel-based brain morphometry (VBM) 1-2. VBM and MPRAGE imaging have been extensively used to study brain plasticity induced by learning and motor training. More recent studies have reported rapid cortical structural changes after a few days’ intensive training3 or even after a couple of hours intake of psychotic drug4. However, we know still very little about this short-term apparent change (SAC) of GM associated with a single practice session and about the progressive alterations associated with repetitive trainings. To assess the extent and dynamics of SAC of GM in motor training we investigated how the VBM results are affected by the different levels of acceleration of the MP-RAGE sequence using the wave-CAIPI technique which provides highly accelerated MRAGE acquisition5.Material and Methods
A total of 12 right-handed, healthy male adults (aged 20-55 years old)
were recruited into the study. All MRI data acquisition
was conducted on a whole-body 3T clinical MRI scanner (Prisma-fit, Siemens)
equipped with a compact 64-channel head coil. The optimized protocol for
standard 3D T1-weighted MPRAGE imaging can acquire one timeframe in 4:24min and
included following parameters: TE/TR/TI=2.52/1900/900 ms, flip angle=9°, 1 mm isotropic voxel size, IPAD
factor=2, and bandwidth=170 Hz/voxel. The most efficient wave-CAIPI MPRAGE
protocol can acquire one timeframe with sufficient quality for VBM in 47s and
included the following parameters: TE/TR/TI=3.4/1730/900 ms, flip angle=7°, 1 mm isotropic voxel size, total
acceleration factor=9 and bandwidth=200 Hz/voxel.
To study the SAC of GM in motor training we used
block-designed, coordinated bilateral finger tapping. The subjects were
instructed to perform the tapping as fast as possible without producing
apparent head motions. With the standard MPRAGE sequence we acquired a time
series of 10 MPRAGE images in about 44min. The corresponding training paradigm
consisted of 5 resting epochs interleaved with 5 epochs of motor practicing
described above. Each epoch lasted 4:24min matching the time to acquire 1 timeframe.
With the optimized wave-CAIPI MPRAGE protocol we acquired a time series of 20
images in about 15:40 min. The corresponding paradigm consisting of 2 resting
epochs interleaved with 2 epochs of motor practicing. Each epoch lasted 3:55
min matching the time to acquire 5 timeframes with the optimized Wave-CAIPI
MPRAGE protocol.
We used the SPM12 and the
Computational Anatomical Toolbox (CAT12.3) to analyze the MPRAGE imaging data
for the longitudinal segmentation and obtained segmented and spatially normalized
GM density image data. We performed motion correction and Gaussian smoothing
with the ANI prior to conducting
paired t-test to assess the SAC of GM induced by the motor paradigms.
Statistical significance was assessed with an initial
cluster-forming voxel-wise threshold of p<0.001
and model-free randomized permutation simulation was used to estimate the
corrected family-wise error rate (FWER) for the clusters.Results
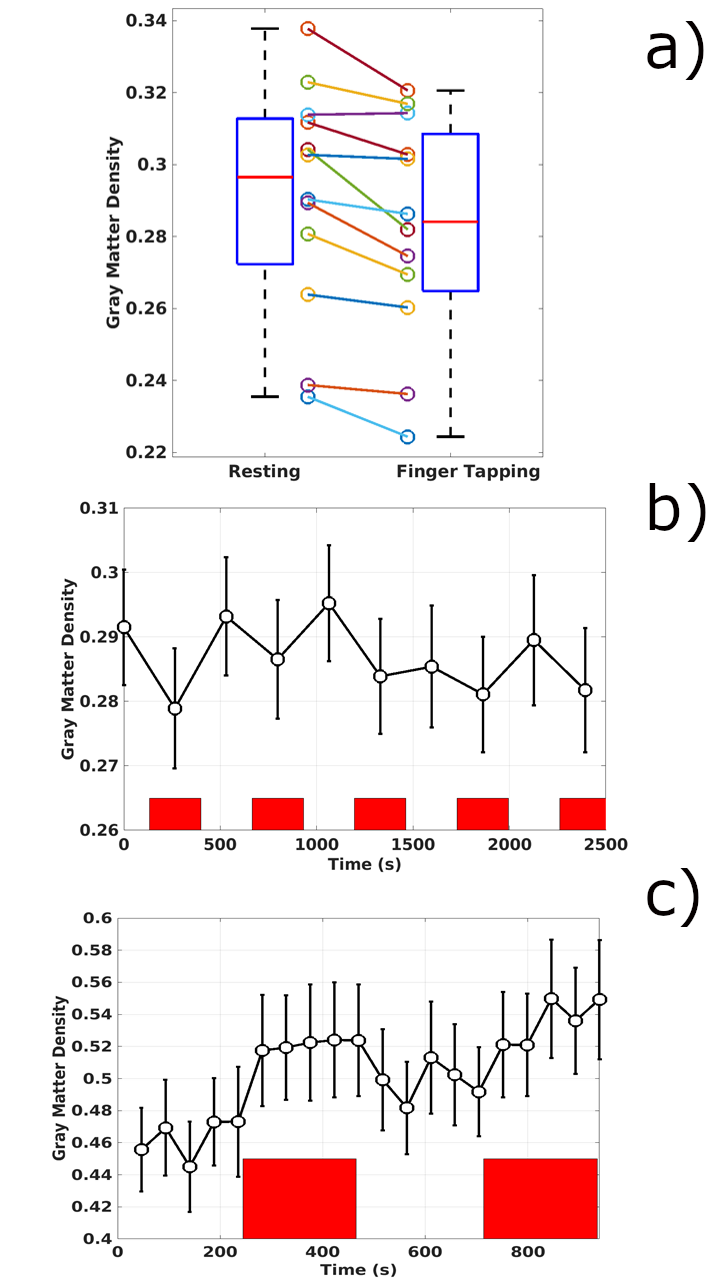
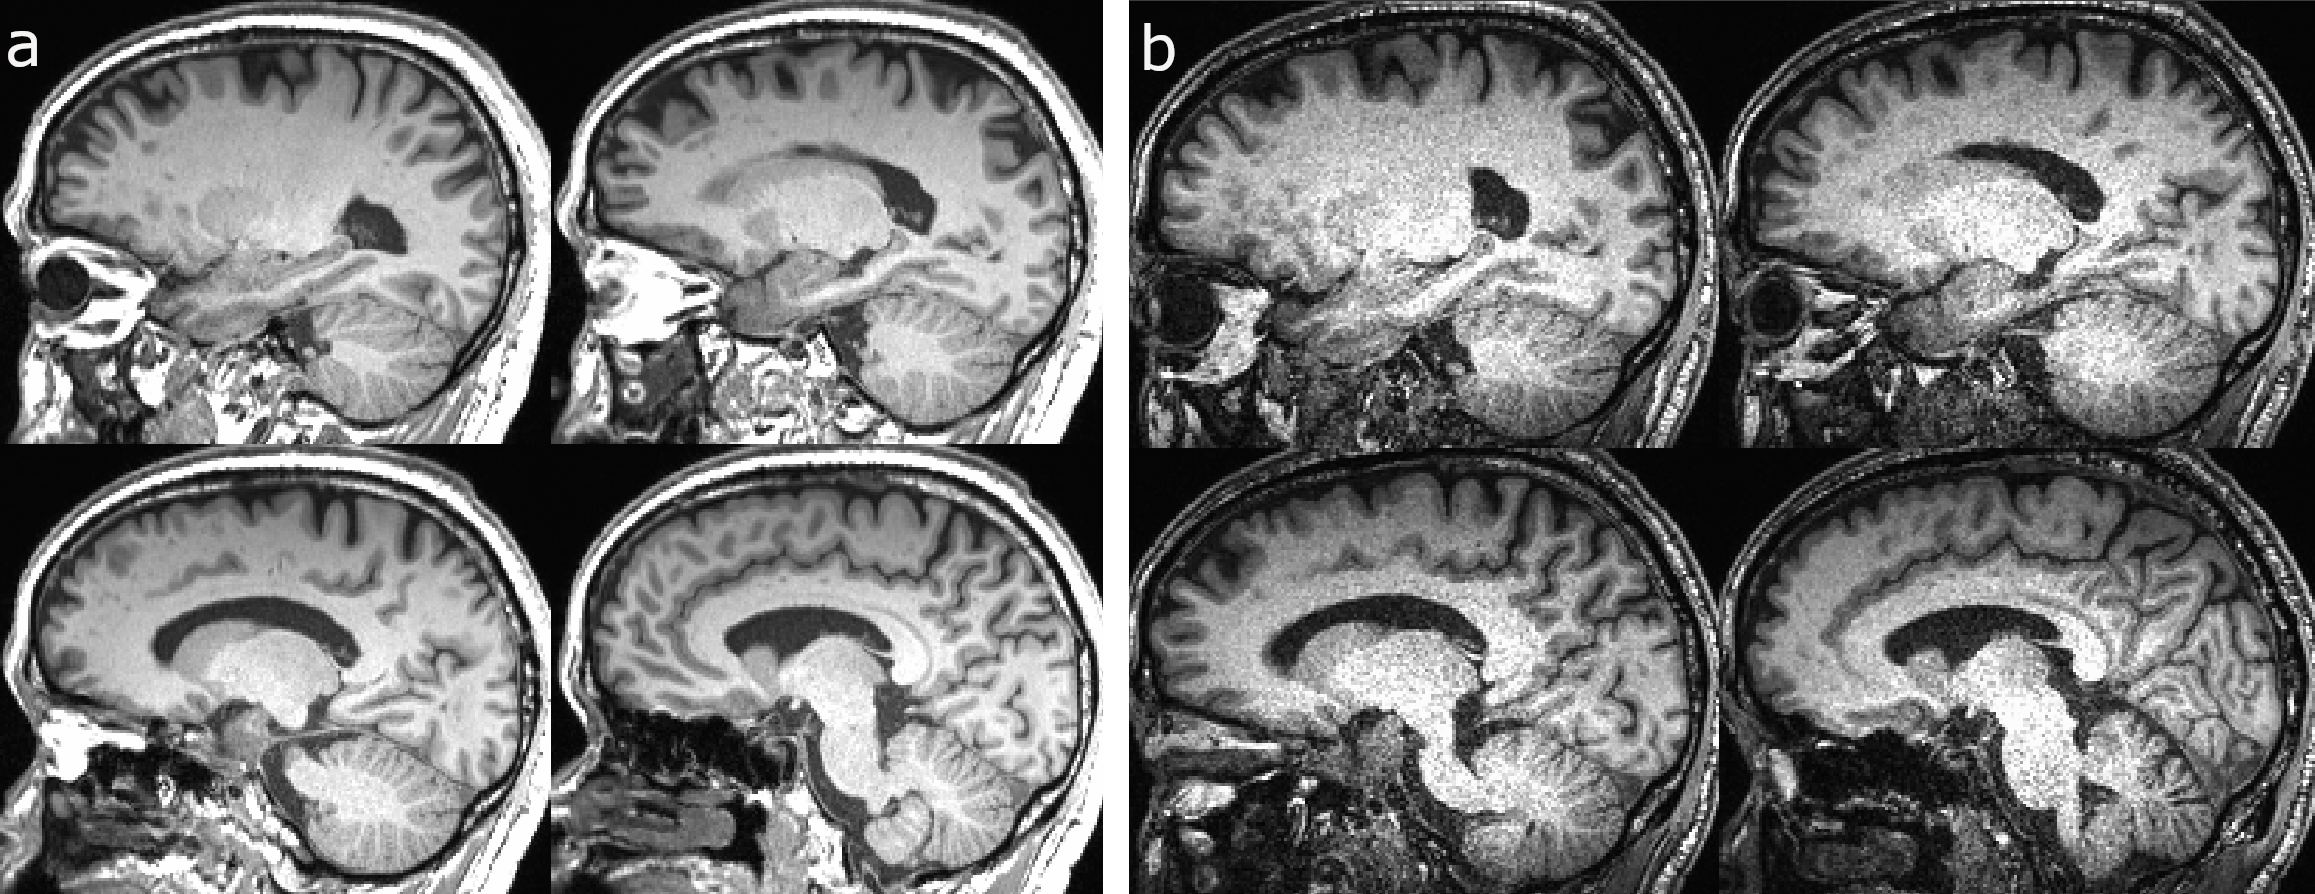
The main findings for the study are (1) As shown in Fig. 1, the optimized wave-CAIPI MPRAGE protocol can speed up the VBM acquisition by over 10 times; (2) As detected with the standard MPRAGE protocol (Fig2), the prolonged coordinated bilateral finger tapping induced GM signal reduction (-2.8±0.9%) in the cortical parenchyma of hand area in the right postcentral gyrus. (3) With a similar training paradigm and more efficient acquisition protocol based on wave-CAIPI MPRAGE multiple GM regions with positive SAC were detected (see Figs. 3 and 4c). These regions are mostly located at cortical surfaces and the induced average GM signal change was about 10±2%.Discussion
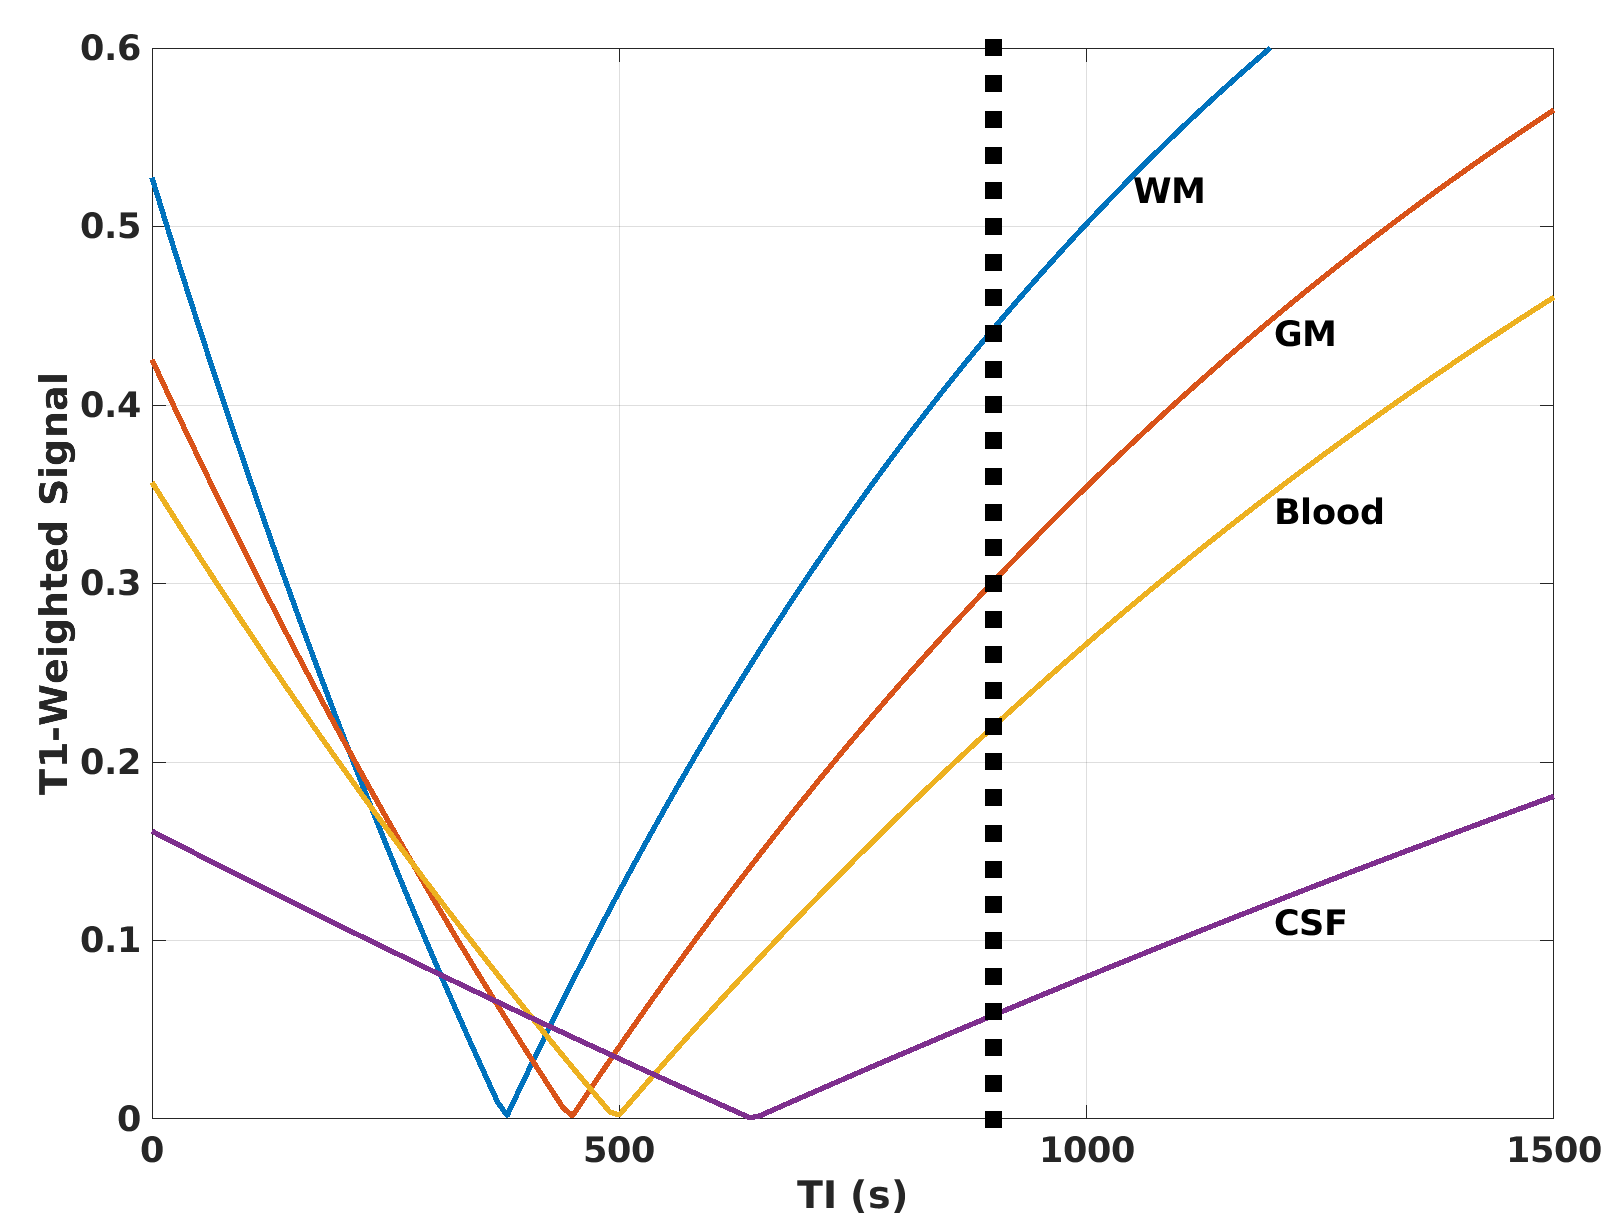
The optimized wave-CAIPI MPRAGE imaging protocol overcomes the g-factor noise amplification penalty and allows for over an order of magnitude acceleration of MPRAGE imaging in VBM studies. The standard and wave-CAIPI MPRAGE sequences have different sensitivity in detecting the SAC of GM likely due to their differences in noise and contrast characteristics. If the observed SAC of GM represents dynamics in brain morphology, we can only speculate what specifics in morphology changes within minutes. Animal research offers some insights on rapid brain morphology change and dendritic spine plasticity is one likely target as recently reviewed6. Local blood volume change is another plausible explanation as described in VASO studies7, 8. As shown in Fig. 5, if the blood volume increase in a voxel is compensated by cortical tissue, signal decrease is expected, whereas increase is expected if the blood volume is compensated by CSF as for voxels at the cortical surface.Acknowledgements
No acknowledgement found.References
1. S. Lorio et al., Neurobiological origin of spurious brain morphological changes: A quantitative MRI study. Hum Brain Mapp 37, 1801-1815 (2016). 2. T. L. Benzinger et al., Regional variability of imaging biomarkers in autosomal dominant Alzheimer's disease. Proc Natl Acad Sci U S A 110, E4502-4509 (2013). 3. V. Kwok et al., Learning new color names produces rapid increase in gray matter in the intact adult human cortex. Proc Natl Acad Sci U S A 108, 6686-6688 (2011). 4. H. Tost et al., Acute D2 receptor blockade induces rapid, reversible remodeling in human cortical-striatal circuits. Nat Neurosci 13, 920-922 (2010). 5. D. Polak et al., Wave-CAIPI for highly accelerated MP-RAGE imaging. Magn Reson Med 79, 401-406 (2018). 6. V. A. Alvarez, B. L. Sabatini, Anatomical and physiological plasticity of dendritic spines. Annu Rev Neurosci 30, 79-97 (2007). 7. H. Lu, X. Golay, J. J. Pekar, P. C. Van Zijl, Functional magnetic resonance imaging based on changes in vascular space occupancy. Magn Reson Med 50, 263-274 (2003). 8. H. Lu, P. C. van Zijl, A review of the development of Vascular-Space-Occupancy (VASO) fMRI. Neuroimage 62, 736-742 (2012). 9. Y. Lee, M. F. Callaghan, J. Acosta-Cabronero, A. Lutti, Z. Nagy, Establishing intra- and inter-vendor reproducibility of T1 relaxation time measurements with 3T MRI. Magn Reson Med, (2018).Figures
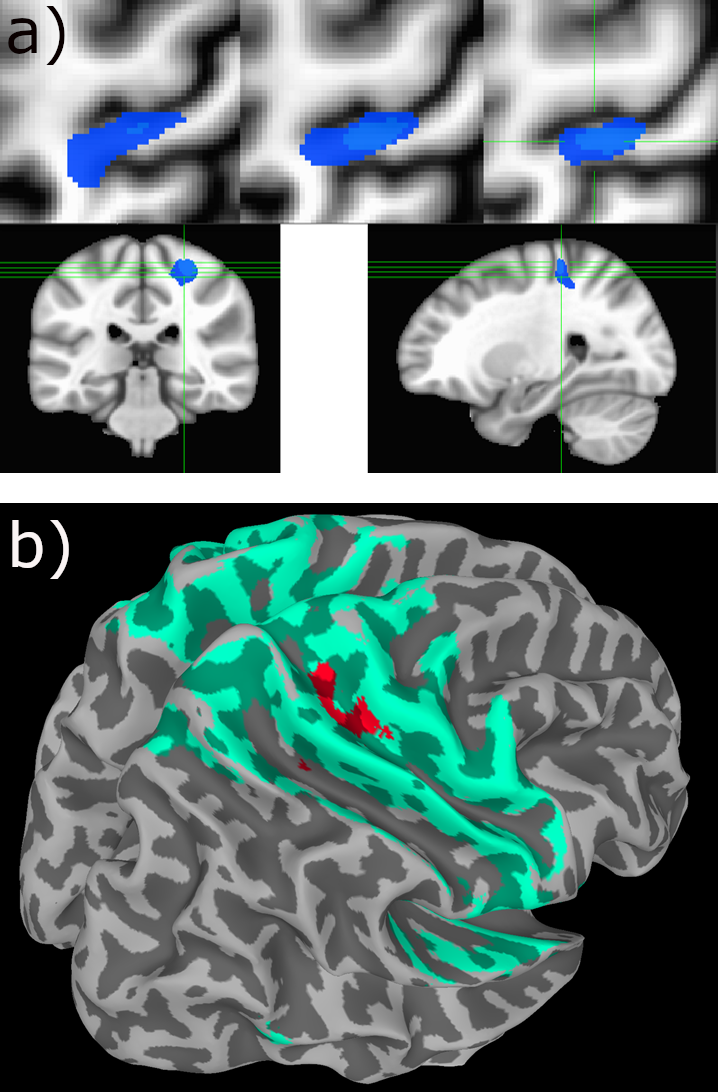
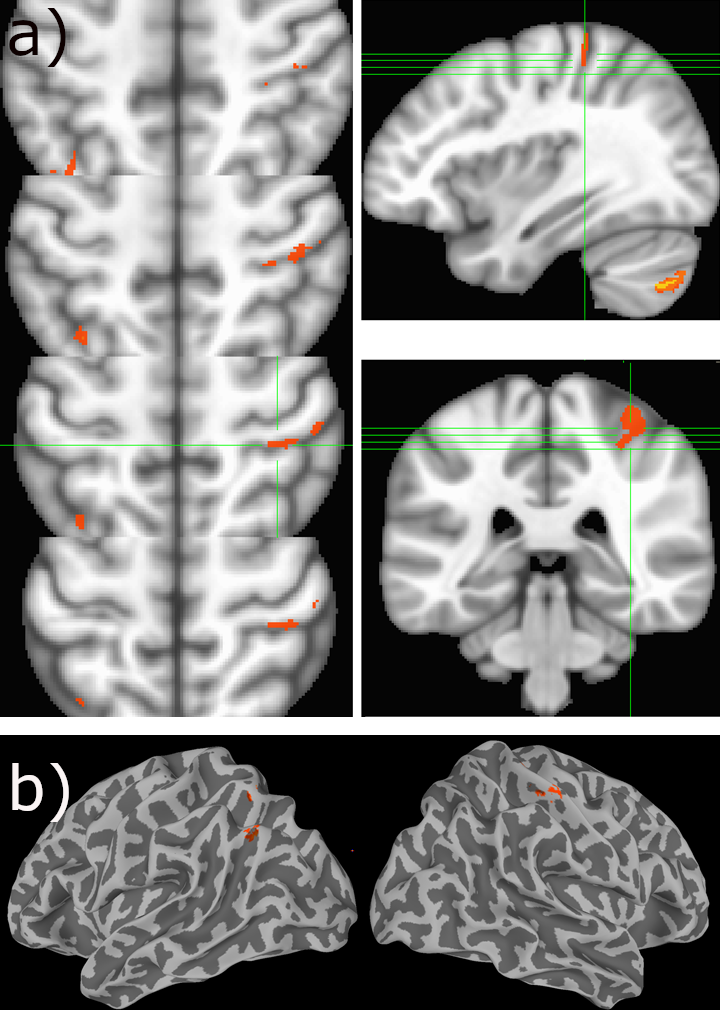
Brain regions with significant SAC determined by a 15:40 min scanning using the optimized wave-CAIPI MPRAGE protocol was overlaid on the MNI template (a). The paired t-test detected 3 clusters (FWHM=3mm) with increased GM content during finger tapping periods. The cluster locations were also depicted in the inflated surface model (b). The details of the clusters are the followings:
Voxels x y z p (FWER) Label
234 -37.1 +71.7 -45.1 0.01 Inferior semi-Lunar Lobule
182 +38.9 +65.2 +46.9 0.02 L-superior parietal Lobule
160 -38.7 +33.6 +58.2 0.03 Ri-postcentral gyrus