4670
CSF-suppressed T2 weighted imaging at 7T1University of Pittsburgh, Pittsburgh, PA, United States, 2UPMC, Pittsburgh, PA, United States
Synopsis
T2-weighted lesional imaging is most commonly performed using inversion recovery turbo spin echoes. At 7T, however, this acquisition is limited for specific absorption rate and resolution. We implement a strategy that uses a driven equilibrium spin-echo preparation within an inversion recovery with multiple 3D gradient-echo imaging blocks to generate CSF-suppressed T2 weighted sensitivity. Images are combined using the self-normalization approach. Data acquired with an 8x2 transceiver array are shown to demonstrate sensitivity in brain tumors and epilepsy.
Introduction
At 7T, FLAIR imaging is challenging due to increased power deposition and problems with transmit homogeneity. Parallel transmit arrays have mitigated inhomogeneity problems but given the squared dependence of voltage with frequency at 7T, images still require high SAR. The variable flip angle turbo spin echo sequence provides a reasonable solution to control power deposition, however can be difficult for consistent contrast and motion insensitivity. We have developed the MPFLAGRE magnetization prepared fluid attenuated gradient echo approach to 7T FLAIR contrast. This is based on a longitudinally prepared T2 weighting within an inversion recovery with multiple 3D gradient-echo (SPGR) images. Taking a self-normalized image approach (as exemplified by the MP2RAGE acquisition, ref. 1) with a combination of the T1 and T2 weighted SPGR images generates FLAIR and T2 weighted contrast with high SAR efficiency.Methods
T2 sensitivity is introduced into the 3D T1 weighted MP2RAGE sequence via a longitudinal (non-selective) T2 encoding module performed after the initial inversion. As a result, the T2 weighting is encoded longitudinally and decays with T1 sensitivity, which is recorded by up to four SPGR readout S1-4 blocks (Fig. 1A). The greatest T2 dependence is seen immediately after the spin echo preparation and thus to enhance the T2 sensitivity, the first two SPGR blocks S1 and S2 are summed. Combination using the self-correcting normalization approach (1), referenced to blocks S3 or S4 with the inclusion of sign inversion on S1+2 generate the desired tissue orientation (2). While the self-correcting normalization eliminates B1- variation, variation in B1+ is not wholly corrected. Simulations of B1+ sensitivity shows that optimal consistency of signal is obtained with ±15% of calibrated B1+, with the calculated signal intensity increasing at greater inhomogeneity (Fig. 2).
A Siemens whole body 7T Magnetom 8 channel pTx system with 8x2 transceiver array was used. B1 shimming was performed in all subjects (~3.5 min), generating a mean B1+ of 17.6uT, coefficient of variation 10.4±1.8% over the entire brain (n=8 controls; maximum voltage each RF channel <170V). All studies were performed with IRB approval. To demonstrate sensitivity to pathology, we have acquired images from tumor and epilepsy patients. Comparison is available from 3T from a subset of these patients.
Results
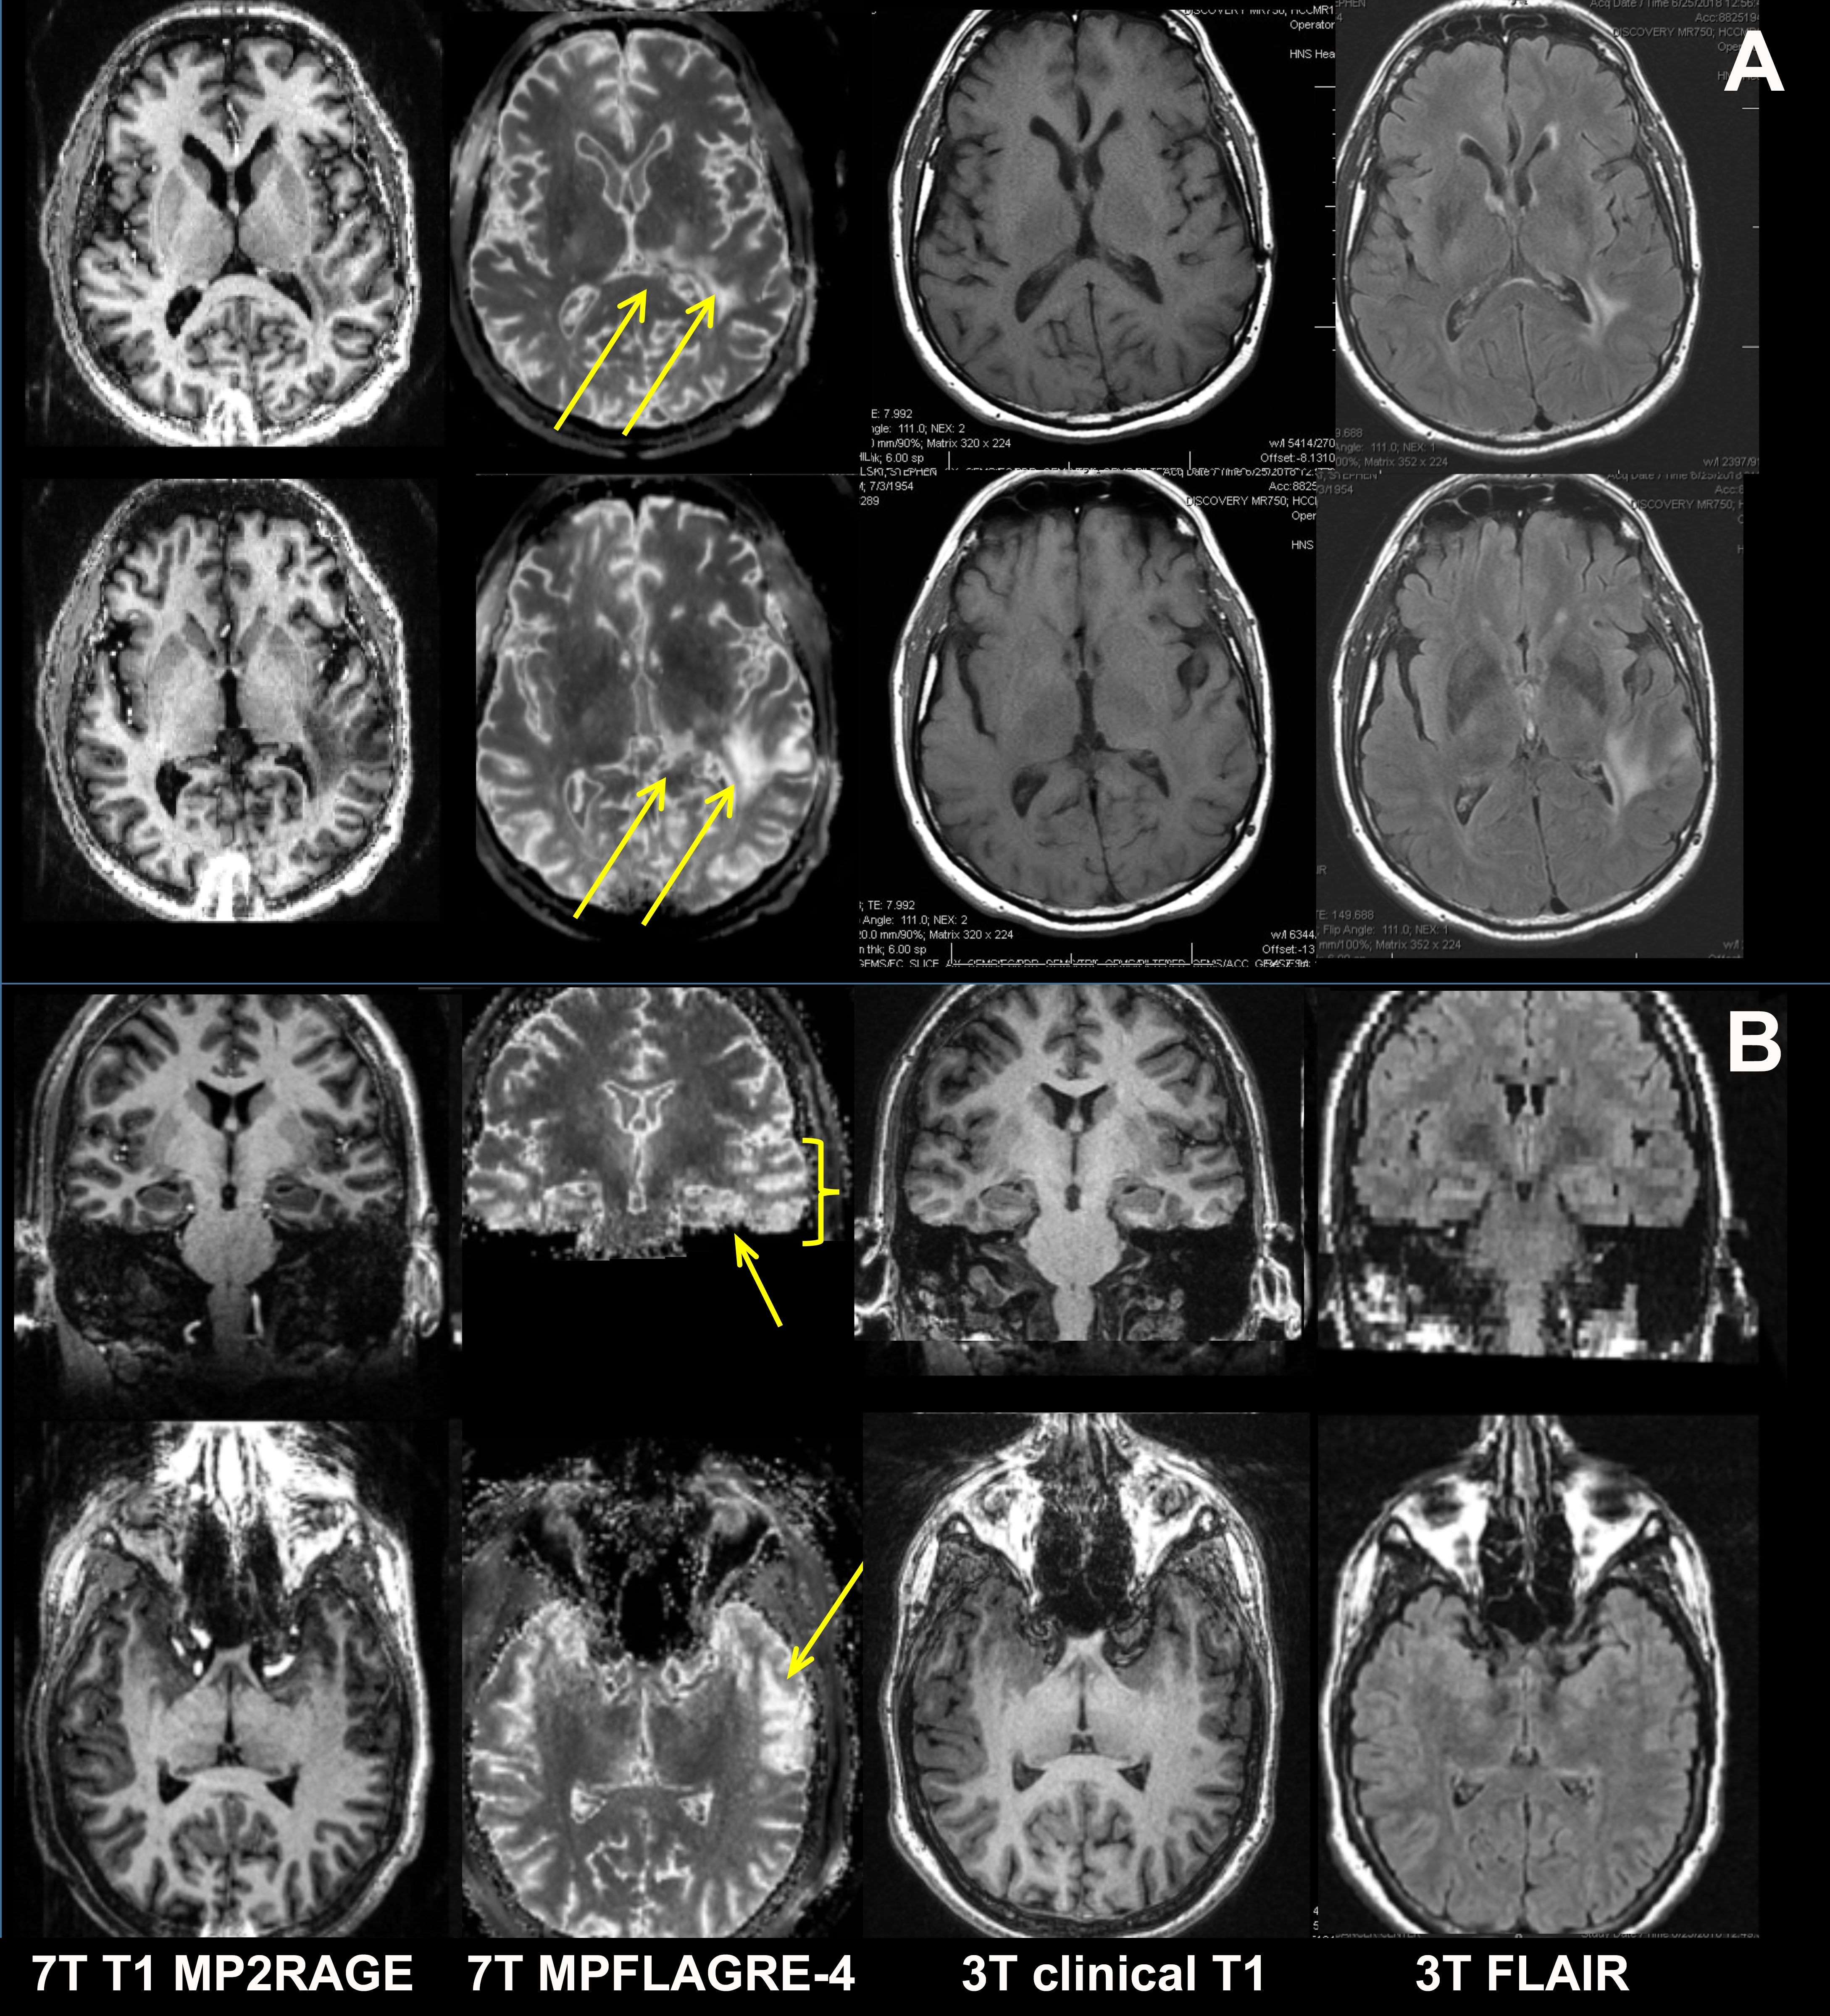
Fig. 1 shows Bloch simulations of the MPFLAGRE sequence with 4 SPGR blocks (Fig. 1B), over T1 and T2 space. Combining the 4 blocks via the self-normalization to create R(1+2)/3 or R(1+2)/4 shows the generation of simultaneous FLAIR and T2 weighted sensitivity respectively (Fig. 1C, D). The normalization generates a limited signal range of [-0.5, 0.5] (similar to the MP2RAGE) with variation based on T1 and T2, where intensity factors due to proton density, T2* and receiver bias are eliminated. Images from a control (Fig. 1D) show that there is enhanced signal intensity at the cortical rim and ependyma, consistent with the report of (3) who concluded that increased T2 from the cortical molecular layer I contributes to enhanced FLAIR signal intensity. In n=5 healthy controls the MPFLAGRE-4 sequence generates a 6min average SAR of 74±2% of FDA guidelines.
Using the timings of ti1/ti2/TR/TE = 0.14/1.65/5/0.100s, resolution of 0.7x0.7x1.2mm (<0.6mm3) both FLAIR and T2 weighted images are simultaneously acquired in 9.5min. Fig. 3 shows the MPFLAGRE, MP2RAGE images from a tumor (anaplastic astrocytoma) and an epilepsy patient, both patients in comparison to clinical 3T FLAIR images. For the tumor patient (Fig. 3A), the 3T and 7T images were acquired within 1 week of each other, with subsequent 3T images demonstrating progression of the tumor into the left thalamus and temporal lobe. The epilepsy patient (Fig. 3B) was a non-lesional case who was subsequently identified as left hippocampal temporal lobe seizure onset.
Discussion
The MPFLAGRE sequence is flexible acquisition that applies a T2 preparation module with a self-correcting normalization strategy to generate FLAIR and T2 contrast at 7T. With appropriate timing and combination of multiple imaging blocks during the inversion recovery, it is possible to control the T1 dependence and suppress CSF. With the B1+ variation from the 8x2 transceiver array being ~10%, the consistency of images is excellent, with the sequence functioning well within SAR guidelines. The MPFLAGRE sequence appears to have potentially useful sensitivity to pathology for tumors and epilepsy patients.Acknowledgements
This work supported by NIH R01EB011639, R01NS090417 and R01NS081772.References
1. Marques J, Kober T, Krueger G, van der Zwaag W, Van de Moortele P, Gruetter R. Neuroimage 2010 49:1271-81.
2. Pan JW, Moon CH, Hetherington HP. Mag Res Med Oct 2018 in press.
3. van Veluw SJ, Fracasso A, Visser F, Spliet WG, Luijten PR, Biessels GJ, Zwanenburg JJ. Neuroimage. 2015; 104:100-9.
Figures