4669
High-Resolution Simultaneous Mapping of Brain Function and Metabolism1Electrical and Computer Engineering, University of Illinois at Urbana-Champaign, Urbana, IL, United States, 2Beckman Institute for Advanced Science and Technology, University of Illinois at Urbana-Champaign, Urbana, IL, United States, 3Biomedical Engineering, Shanghai Jiao Tong University, Shanghai, China
Synopsis
We present a new method for simultaneous mapping of brain function and metabolism. This method provides an unprecedented capability to simultaneously obtain high-resolution metabolic maps (2.4×2.4×3.0 mm3) and brain functional maps (3.0×3.0×2.6 mm3) of the whole brain coverage (230×230×120 mm3) in 8 minutes. The proposed method extends the subspace-based imaging framework of the SPICE technique with a new data acquisition scheme and exploits the complementary information between MRSI and fMRI signals for high-quality image reconstruction. Brain imaging experiments have been carried out, demonstrating the impressive capability of our method. With further improvement, the method can provide an unprecedented tool for mapping brain function and metabolism simultaneously.
Introduction
Functional MRI (fMRI) has been widely used to map brain function invasively, while MR spectroscopic imaging (MRSI) provides a complementary capability to map the metabolism of brain tissues. Currently, fMRI and MRSI experiments are performed in two separate scans using different data acquisition schemes. Specifically, fMRI acquisitions are based on multislice EPI to avoid long readout and its associated image artifacts due to field inhomogeneity and susceptibility-induced signal loss1. MRSI is mostly based on CSI or EPSI trajectory to acquire both spatial and spectral encodings, thereby resulting in lower spatial and temporal resolution2,3. Most MRSI techniques in practical use achieve spatial resolution on the order of a centimeter with scan time on the order of 20 minutes4. Recently, it has been demonstrated that rapid high-resolution MRSI is possible using a new technique known as SPICE (SPectroscopic Imaging by exploting spatiospecral CorrElation)5. In this work, we extend SPICE with a novel data acquisition and processing method that provides an unprecedented capability to achieve simultaneous fMRI and metabolic imaging of the whole brain in high resolution. Our experimental results demonstrate that the proposed method can acquire fMRI images in 3.0×3.0×2.6 mm3 spatial resolution, 3 seconds temporal resolution and MRSI spatiospectral functions at nominal spatial resolution of 2.4×2.4×3.0 mm3 in an 8 minutes scan. This capability can significantly enhance the practical utility of MRSI in neuroimaging applications.Methods
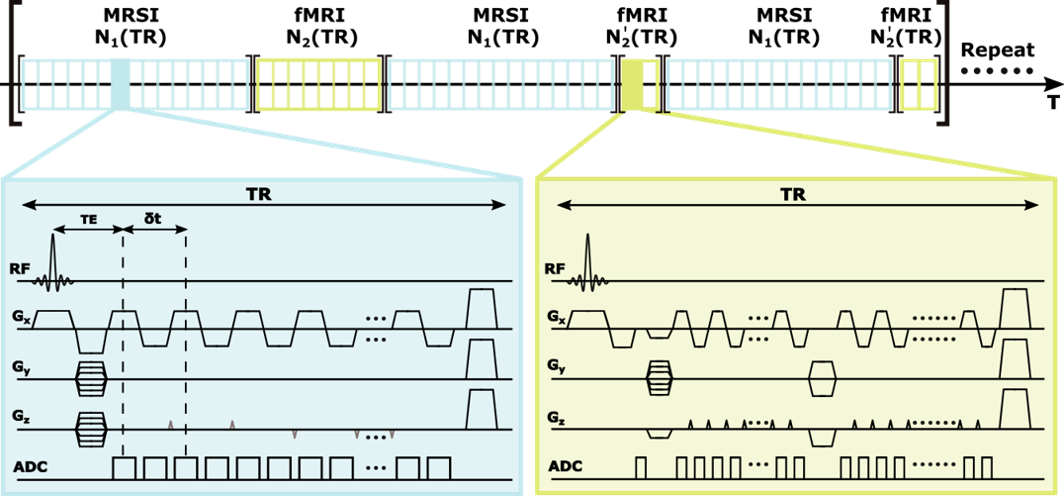
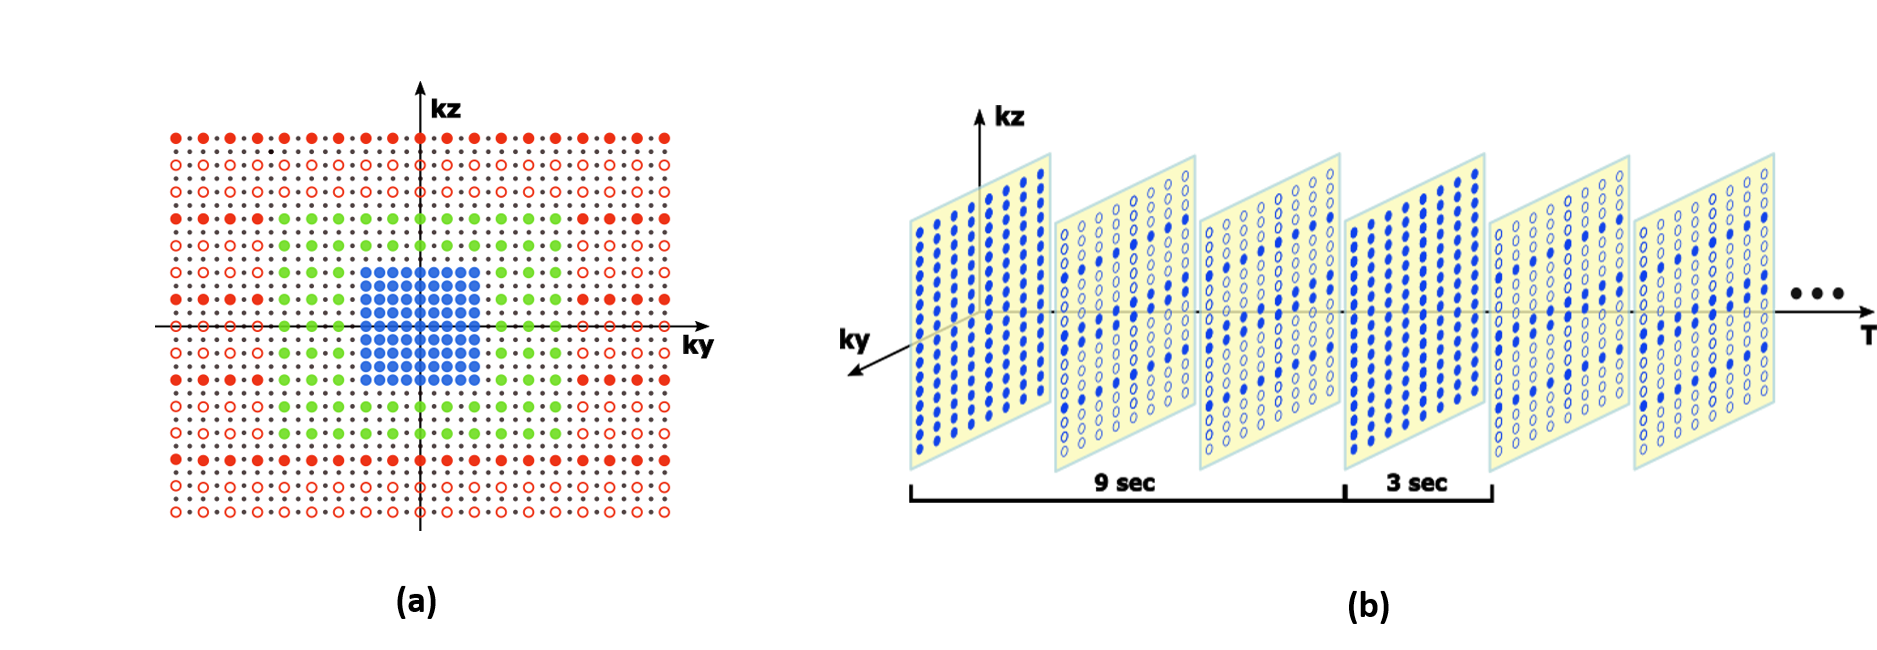
The proposed approach to simultaneous acquisition of fMRI and MRSI signals is shown in Fig.1. This acquisition scheme is distinct from the conventional MRSI and fMRI acquisition methods in several key aspects: (1) acquisition of MRSI and fMRI signals during the same time period in an interleaved fashion; (2) elimination of water and lipid suppression for both MRSI and fMRI data acqusition, which makes simultaneous acquisition of MRSI and fMRI signals possible; (3) use of FID-based acquisition with ultrashort TE (1.6 ms) and short TR (160 ms); (4) large k-space coverage for MRSI using extended EPSI readout with ramp sampling as well as a variable density sampling in the phase encoding direction (Fig. 2a); (5) collection of fMRI signals in EVI-based trajectories with sparse sampling (Fig. 2b), which leads to larger k-space coverage and higher temporal resolution. This acquisition scheme enables simultaneous acquisition of both MRSI and fMRI signals in high spatiospectral/temporal resolution. The dual signals also offer a desired capability for: a) correction of field drifts and head motion artifact in MRSI using the complementary information from fMRI, and b) correction of chemical shift effects, geometric distortion and susceptibility effect using spatiospectral information from the MRSI data. In an 8-minute scan, the proposed method can acquire fMRI images in 3.0×3.0×2.6 mm3 spatial resolution and 3 second temporal resolution and MRSI spatiospectral functions in 2.4×2.4×3.0 mm3 nominal spatial resolution with whole brain coverage (230×230×120 mm3).
Reconstruction of the metabolite spatiospectral functions is done using a union-of-subspaces model6, which expresses the overall signals as:
$$\rho_{MRSI}(\mathbf{r},t)=\sum_{l_w=1}^{L_w}U_{l_w}(\mathbf{r})V_{l_w}(t)+\sum_{l_f=1}^{L_f}U_{l_f}(\mathbf{r})V_{l_f}(t)+\sum_{l_{MM}=1}^{L_{MM}}U_{l_{MM}}(\mathbf{r})V_{l_{MM}}(t)+\sum_{l_m=1}^{L_m}U_{l_m}(\mathbf{r})V_{l_m}(t)$$
This subspace model not only significantly reduces the number of degrees of freedom for representing the desired spatiospectral function but also enables effective incorporation of spatial and spectral priors to improve SNR.
Reconstruction of the fMRI images from sparsely sampled EVI data is accomplished using a single subspace, exploiting the partial separability7 of the fMRI images:
$$\rho_{fMRI}(\mathbf{k},T)=\sum_{l_{fMRI}=1}^{L_{fMRI}}U_{l_{fMRI}}(\mathbf{k})V_{l_{fMRI}}(T)$$
This model indicates that the fMRI signals can be expressed by a finite weighted sum of temporal basis functions with a set of spatially dependent coefficients. After the fMRI images are reconstructed, the functional networks are extracted using existing ICA-based method8.
Results
The proposed method has been
evaluated using experimental data obtained from healthy volunteers on a 3T
scanner (Siemens Prisma). The data were acquired with the following key
parameters: FOV: 230×230×120 mm3, TR/TE: 160/1.6 ms, readout
bandwidth: 100 kHz, echo-space: 1.76 ms, MRSI matrix size: 96×96×72, fMRI
matrix size: 76×80×46, total time: 8 minutes. Some representative experimental
results are shown in Figs. 3 and 4 to demonstrate the capability of the
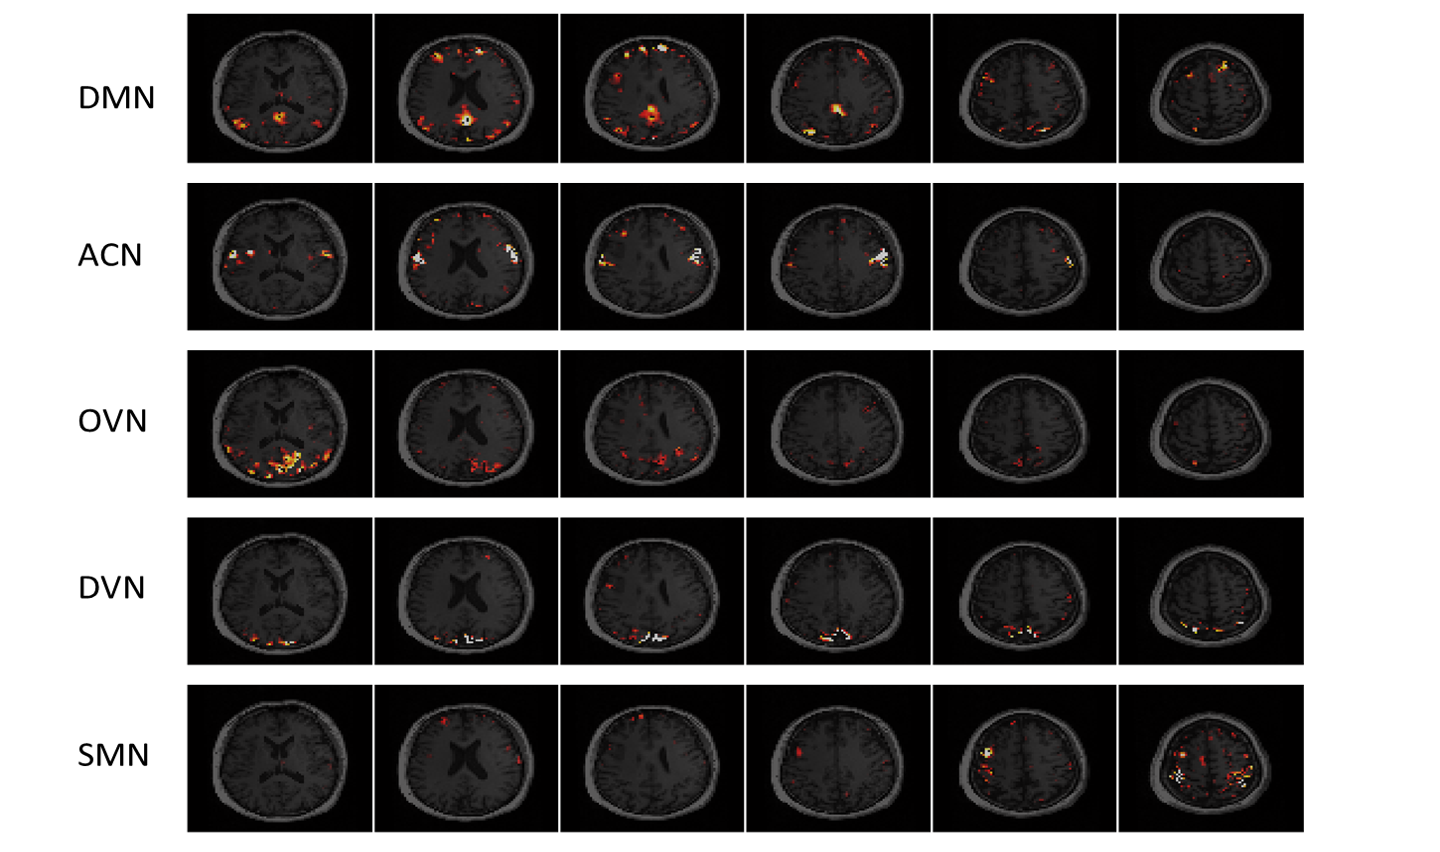
proposed method. Figure 3 shows some of the extracted resting-state networks
including default mode network (DWN), visual cortex network (OVN, DVN), somato-motor
network (SMN) and auditory cortex network (ACN). These functional network
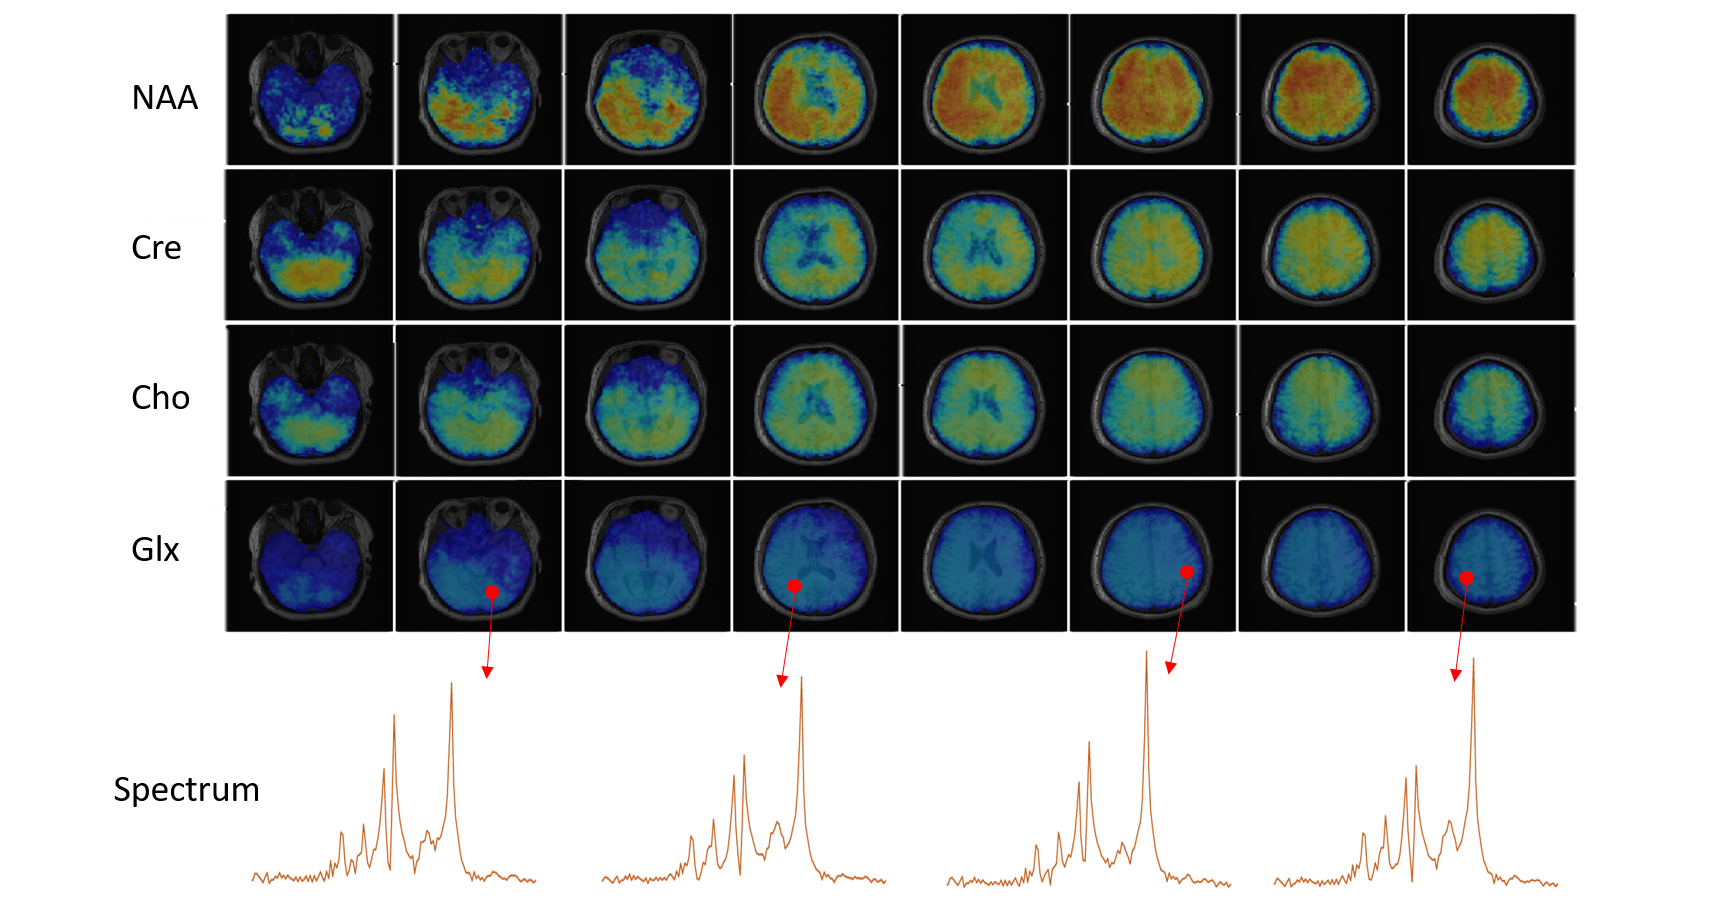
structures are consistent with previous studies9. Figure 4 shows the
reconstructed metabolite maps and spatially resolved spectra. As can be seen,
the proposed method can simultaneously produce high-resolution high-quality metabolite
maps and resting-state networks from an 8 minutes scan.
Conclusion
We have developed a new imaging method for brain mapping applications. This method provides an unprecedented tool for simultaneous mapping of brain function and metabolism in high resolution with the whole brain coverage. This tool may significantly enhance our capability to investigate brain function and metabolism in both scientific and clinical applications.Acknowledgements
This work was supported in part by the National Institutes of Health (NIH-R21-EB021013, NIH-R21-EB023413, NIH-R01-EB023704, and NIH-P41-EB022544)References
1. Biswal B, Zerrin F, Haughton VM, et al. Functional connectivity in the motor cortex of resting human brain using echo‐planar MRI. Magn Reson Med. 1995;34(4):537-541.
2. Brown TR, Kincaid BM, Ugurbil K. NMR chemical shift imaging in three dimensions. Proc Natl Acad Sci. 1982;79(11):3523-3526.
3. Posse S, Tedeschi G, Risinger R, et al. High speed 1H spectroscopic imaging in human brain by echo planar spatial‐spectral encoding. Magn Reson Med. 1995;33(1):34-40.
4. Lam F, Liang ZP. A subspace approach to high‐resolution spectroscopic imaging. Magn Reson Med. 2014;71(4):1349-1357.
5. Lecocq A, Le Fur Y, Maudsley AA, et al. Whole‐brain quantitative mapping of metabolites using short echo three‐dimensional proton MRSI. J Magn Reson Imaging. 2015;42(2):280-289.
6. Ma C, Lam F, Johnson CL, et al. Removal of nuisance signals from limited and sparse 1H MRSI data using a union‐of‐subspaces model. Magn Reson Med. 2016;75(2):488-497.
7. Liang ZP. Spatiotemporal imaging with partially separable functions. Proc IEEE Int Symp Biomed Imaging. 2007:988–991.
8. McKeown MJ, Makeig S, Brown GG, et al. Analysis of fMRI data by blind separation into independent spatial components. Hum brain mapp. 1998;6(3):160-188.
9. Damoiseaux JS, Rombouts SARB, Barkhof F, et al. Consistent resting-state networks across healthy subjects. Proc Natl Acad Sci. 2006;103(37):13848-13853
Figures