4640
A K-means Clustering Algorithm for MRI Virtual Observation Points Compression in Local SAR Supervision1Electrical and Computer Engineering, Purdue University, West Lafayette, IN, United States, 2Weldon School of Biomedical Engineering, Purdue University, West Lafayette, IN, United States
Synopsis
Virtual observation point (VOP) compression has become a standard technique to address SAR and temperature constraints in MRI parallel transmission (pTx) design. SAR matrices need to be pre-averaged for the regions of interest, and finally be conservatively compressed to a much smaller set of SAR matrices (i.e. VOPs) that is still capable of reliably calculating a peak spatial SAR. We demonstrated a new approach that used a k-means algorithm for VOP compression. The new VOP compression method does not yield any under-estimation but allows for a lower over-estimation in the peak local SAR prediction.
Introduction
Specific absorption rate (SAR) supervision in parallel transmission (pTx) applications in MRI system is significant as it enables real-time patient safety monitoring during pTx experiments [1]. In any circumstances, limits for both global and local SAR need to be adhered. Only the global SAR aspect is supervised by the absorbed RF power monitoring, and the local SAR aspect is supervised by the virtual observation point (VOP) monitoring [2]. The VOP concept helps to perform the worst case local SAR evaluation rapidly by using only a limited set of SAR matrices that still provide a conservative estimation of local SAR when the actual multi-channel RF waveform is evaluated.
A low over-estimation bound is desired to minimize unnecessary additional over-estimations on top of applied safety factors. The total number of generated VOPs should not be extremely large so that a fast RF pulse calculation and real-time SAR supervision can be achieved during the pTx design. Therefore, the control over the number of VOPs is important in the VOP compression method.
Here, we propose a k-means based VOP compression algorithm that allows for control over the number of generated VOPs. Traditional VOP methods usually only provide an upper over-estimation bound in the peak local SAR prediction. However, this k-means algorithm generates a narrower and more accurate over-estimation bound in the SAR prediction.
Methods
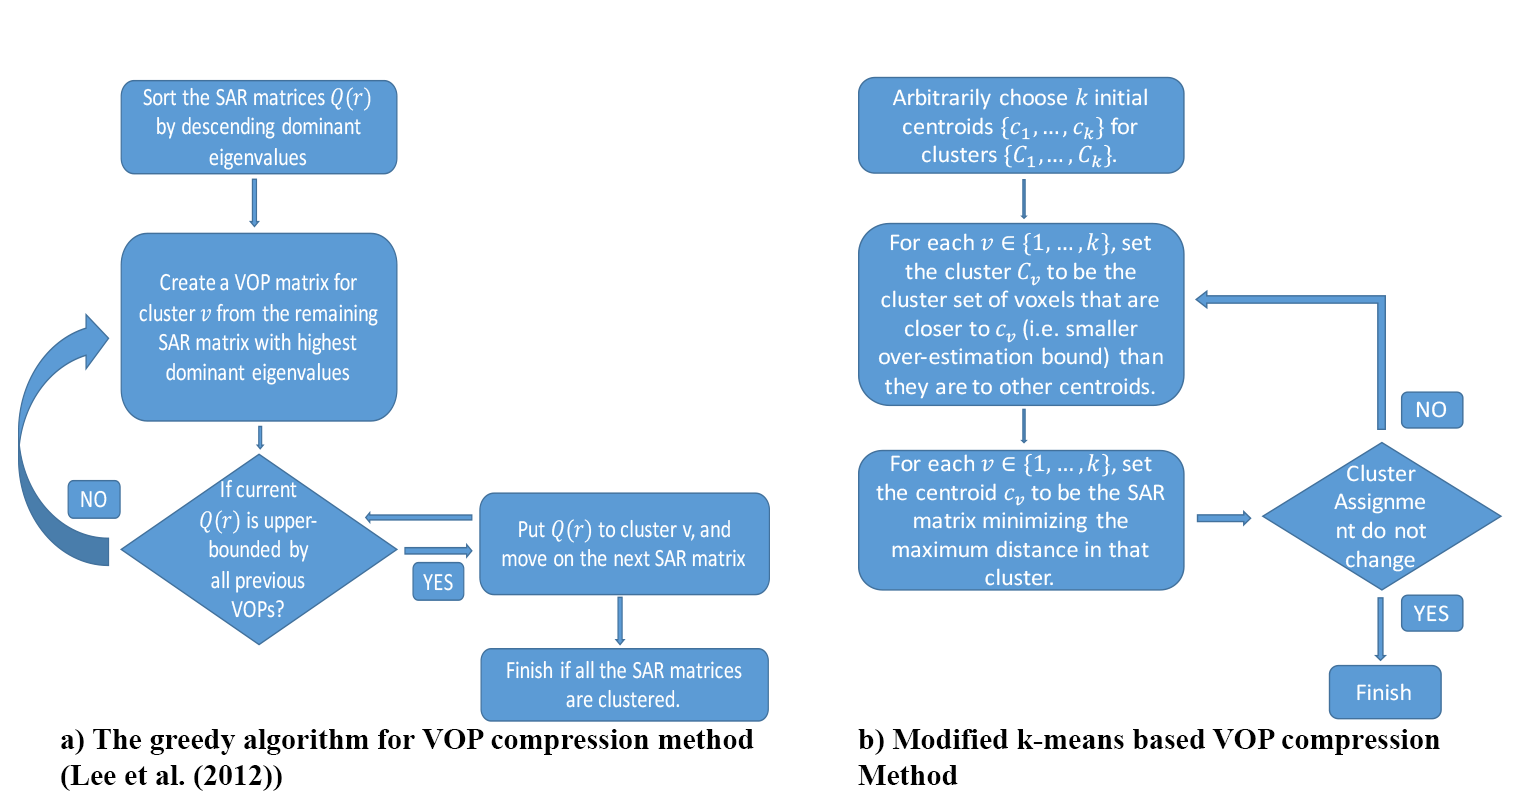
The k-means based VOP compression algorithm and the VOP compression algorithm in Lee et. al. (2012) [3] were implemented in MATLAB (MathWorks, MA, USA), and they are outlined in Fig. 1. 10-g SAR distribution map was derived from B1+ and E fields, which were simulated using a commercial FDTD solver (Remcom XFdtd, PA, USA) to model a 7T head coil composed of eight transmit elements. The FDTD method was used to calculate the magnetic and electric field distribution over a 217x251x174 mm3 domain with an isotropic resolution of 1 mm. The Duke model from the Virtual Population models (IT’IS Foundation, Zurich, Switzerland) loaded the coil. Performance of the two compression methods was evaluated for each of the 174 slices (z = 0-173mm) of the model, with different over-estimation boundaries.Results
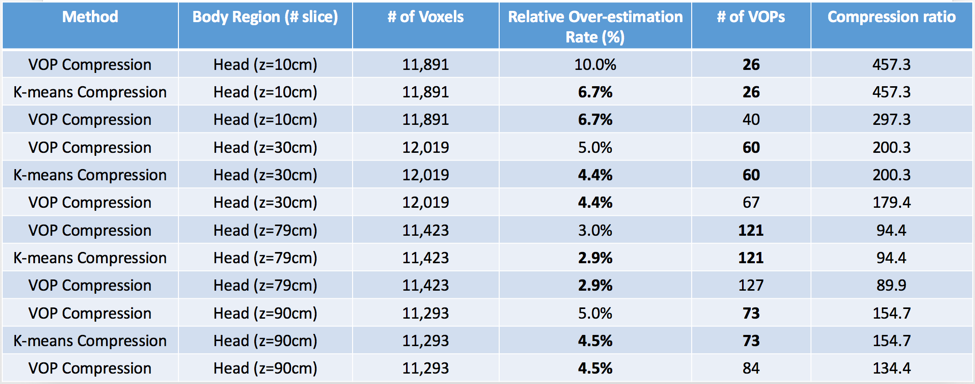
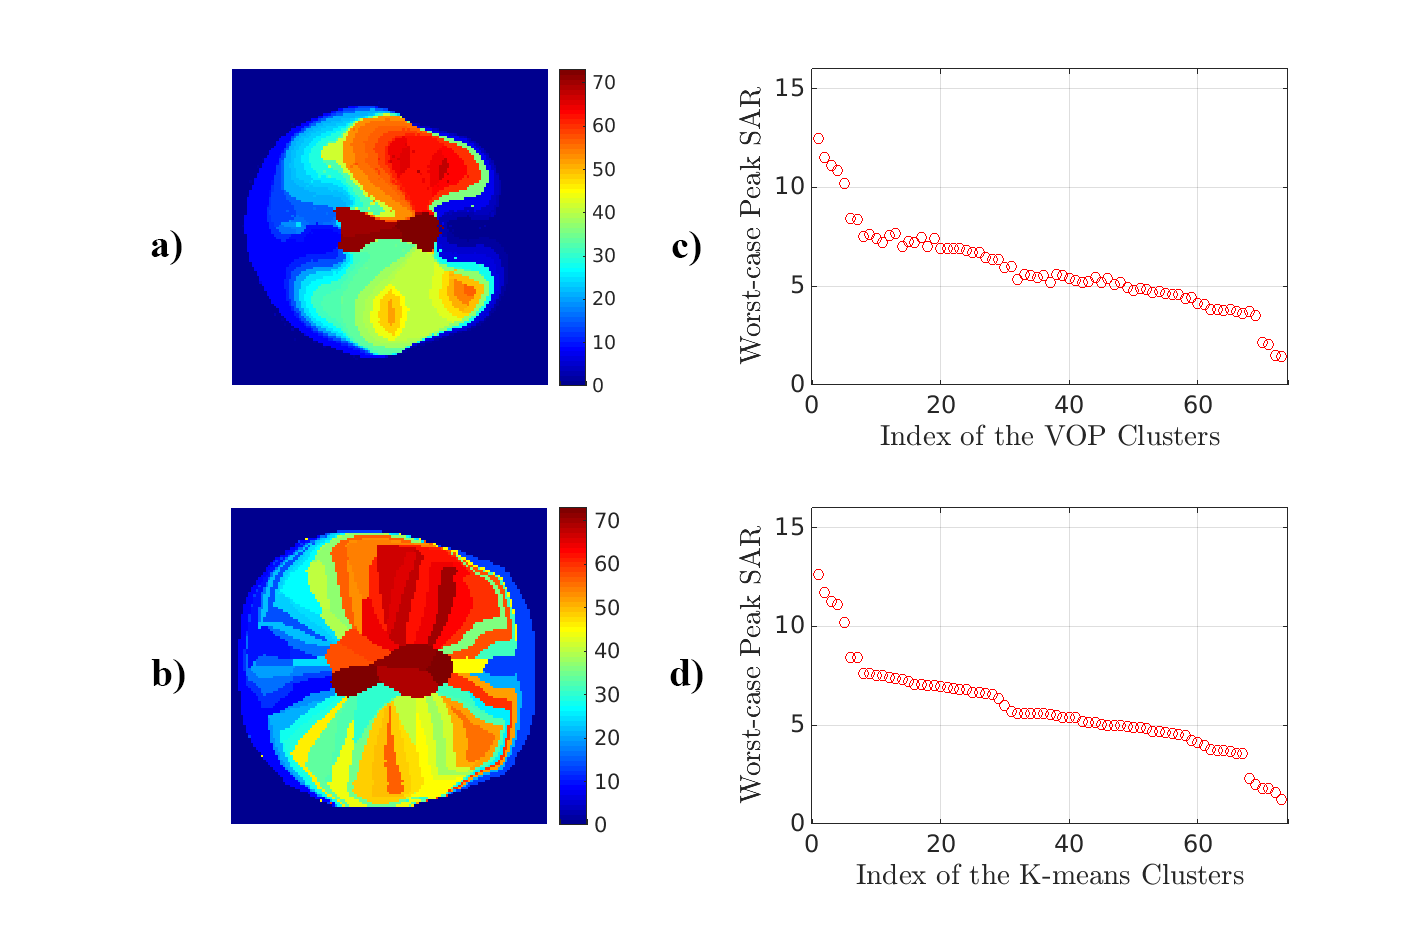
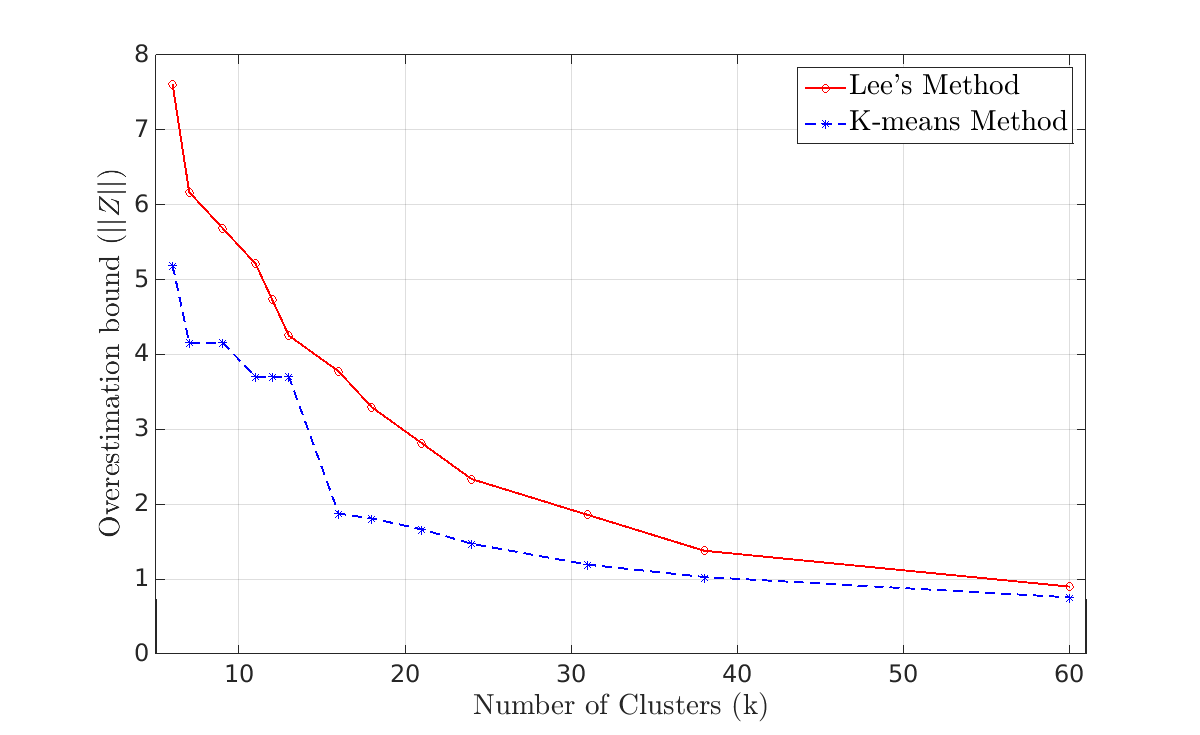
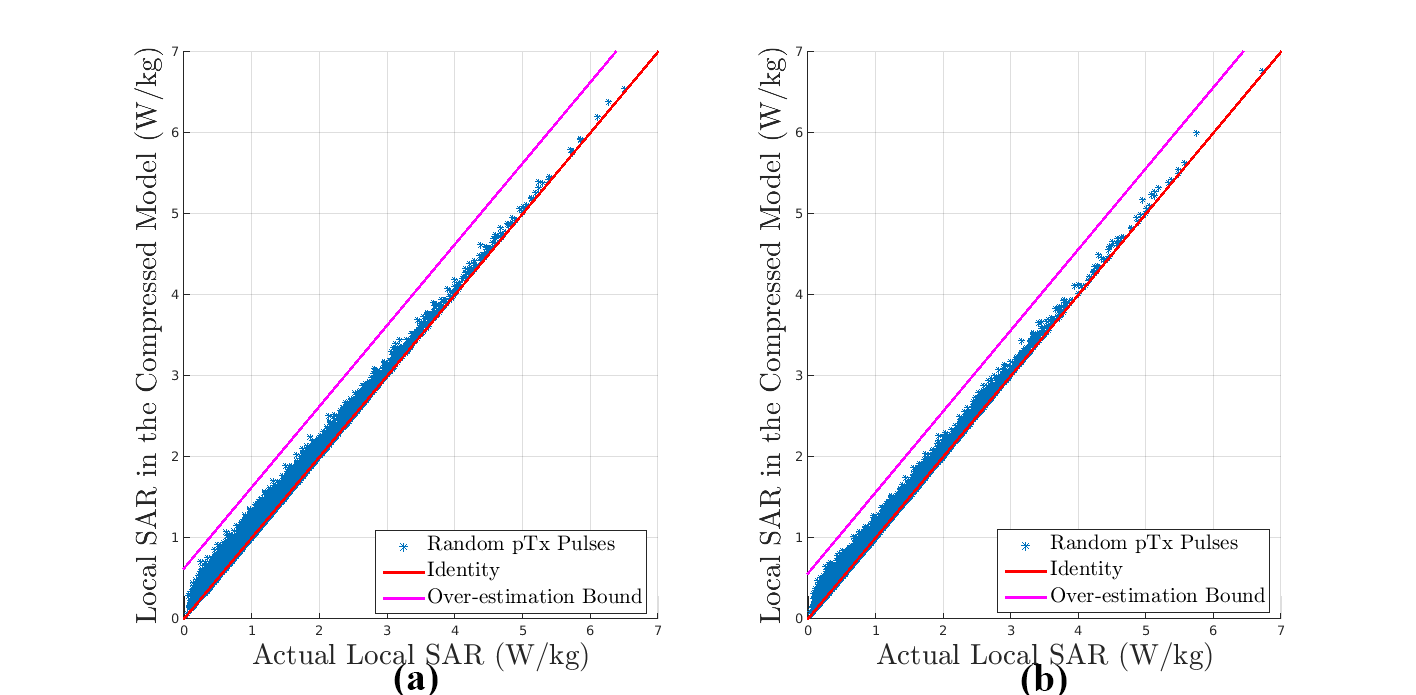
A comparison between Lee’s VOP compression algorithm [3] and the k-means based VOP compression algorithm is surveyed in Figs. 2-4. Compared to Lee’s method, our proposed algorithm generates a narrower and more accurate over-estimation bound. The improvement comes at a moderate increase in the compression ratio. The computation time of the k-means method is generally longer than Lee’s method, however, the compression can usually be finished within 1 hour when ~10,000 SAR matrices are compressed. 10,000 random unit excitation pulses are applied in the actual SAR model and the compressed SAR model, and it is shown that local SAR in the compressed model never exceeds the over-estimation boundary (see Fig. 5).Discussion and Conclusion
Our k-means based algorithm yielded a substantial gain in the VOP compression; the modified algorithm showed improved compression capabilities across all investigated cases. The compression is gained while minimizing the maximum over-estimation bound per cluster. Further, the computation can be controlled by the maximum iterations. The algorithm for all application cases in Fig. 2 can be converged using less than 100 iterations ($$$\leq$$$ 1 hour). Fast computation times and low over-estimation ratios enable VOPs to be used in real-time SAR supervision and can be extended for use in MR thermometry applications [4-5].
To ensure local SAR safety in the pTx design, several safety margins need to be considered: 1) The local SAR prediction should always assume the worst-case scenario; 2) The compressed VOP model need to consider model uncertainties in a way such that local SAR is not underestimated under any circumstances; 3) EM simulation errors, and/or inter-subject variability [4] will have an effect on SAR modeling, and they need to be addressed in the VOP compression.
Future work will consider these safety margins, and possibly include VOP consistency checking between online monitoring and offline prediction. Once enabled, pTx technology will be a cutting-edge asset to mitigate RF field inhomogeneity or to achieve inner volume selection for MRI at an ultra-high field.
Acknowledgements
The authors would like to thank Xin Li (BME, Purdue University) for generating the datasets from the 7T FDTD simulation.References
[1] Homann, Hanno. “SAR Prediction and SAR Management for Parallel Transmit MRI.” Vol. 16. KIT Scientific Publishing, 2012.
[2] Eichfelder, G., & Gebhardt, M. “Local Specific Absorption Rate Control for Parallel Transmission by Virtual Observation Points.” Magn. Reson. Med., 66(5), 1468–76.
[3] Lee J, et al. Local SAR in Parallel Transmission Pulse Design. Magn. Reson. Med. 2012;67:1566–78.
[4] Massire, Aurélien, et al. “An 8Tx/8Rx Coil Validation Workflow Toward Virtual Observation Points-Based Parallel Transmission Cervical Spinal Cord in Vivo Imaging at 7T.” Proc. Intl. Soc. Mag. Reson. Med. 2017.
[5] Kuehne, Andre, et al. “Massively Accelerated VOP Compression for Population-Scale RF Safety Models.” Proc. Intl. Soc. Mag. Reson. Med. 2017.
Figures