4629
Sensing low-frequency, low-amplitude AC magnetic fields at ultra-low field with steady-state SIRS1Martinos Center, Massachusetts General Hospital, Charlestown, MA, United States, 2Harvard Medical School, Boston, MA, United States, 3Physics, Harvard University, Cambridge, MA, United States
Synopsis
In this work, we demonstrate a method to detect low-frequency, low-amplitude AC magnetic fields in an ultra-low-field (ULF) MRI system using a steady-state implementation of the Stimulus-Induced Rotary Saturation (SIRS) method. The method optimizes SNR efficiency by applying the SIRS mechanism in a bSSFP scan. This approach takes advantage of the low SAR and small absolute B0 deviations of the ULF system. We describe simulation results, show a clear signal response in phantoms, and describe an in vivo protocol for using the method to detect response from an auditory stimulus.
Introduction
Brain activation measurements with MRI are typically done with BOLD fMRI. Efforts have been made, however, to develop more direct measurements of neuronal activity. The Stimulus-Induced Rotary Saturation (SIRS) technique has been shown to detect low-frequency magnetic fields in MRI scans1,2, but contamination of the SIRS signal by the BOLD signal makes in vivo validation challenging. Here, we demonstrate improvements to our previous efforts of implementing SIRS at ultra-low field (ULF), where BOLD contamination is insignificant. We describe simulation, phantom, and in vivo experiments.Methods
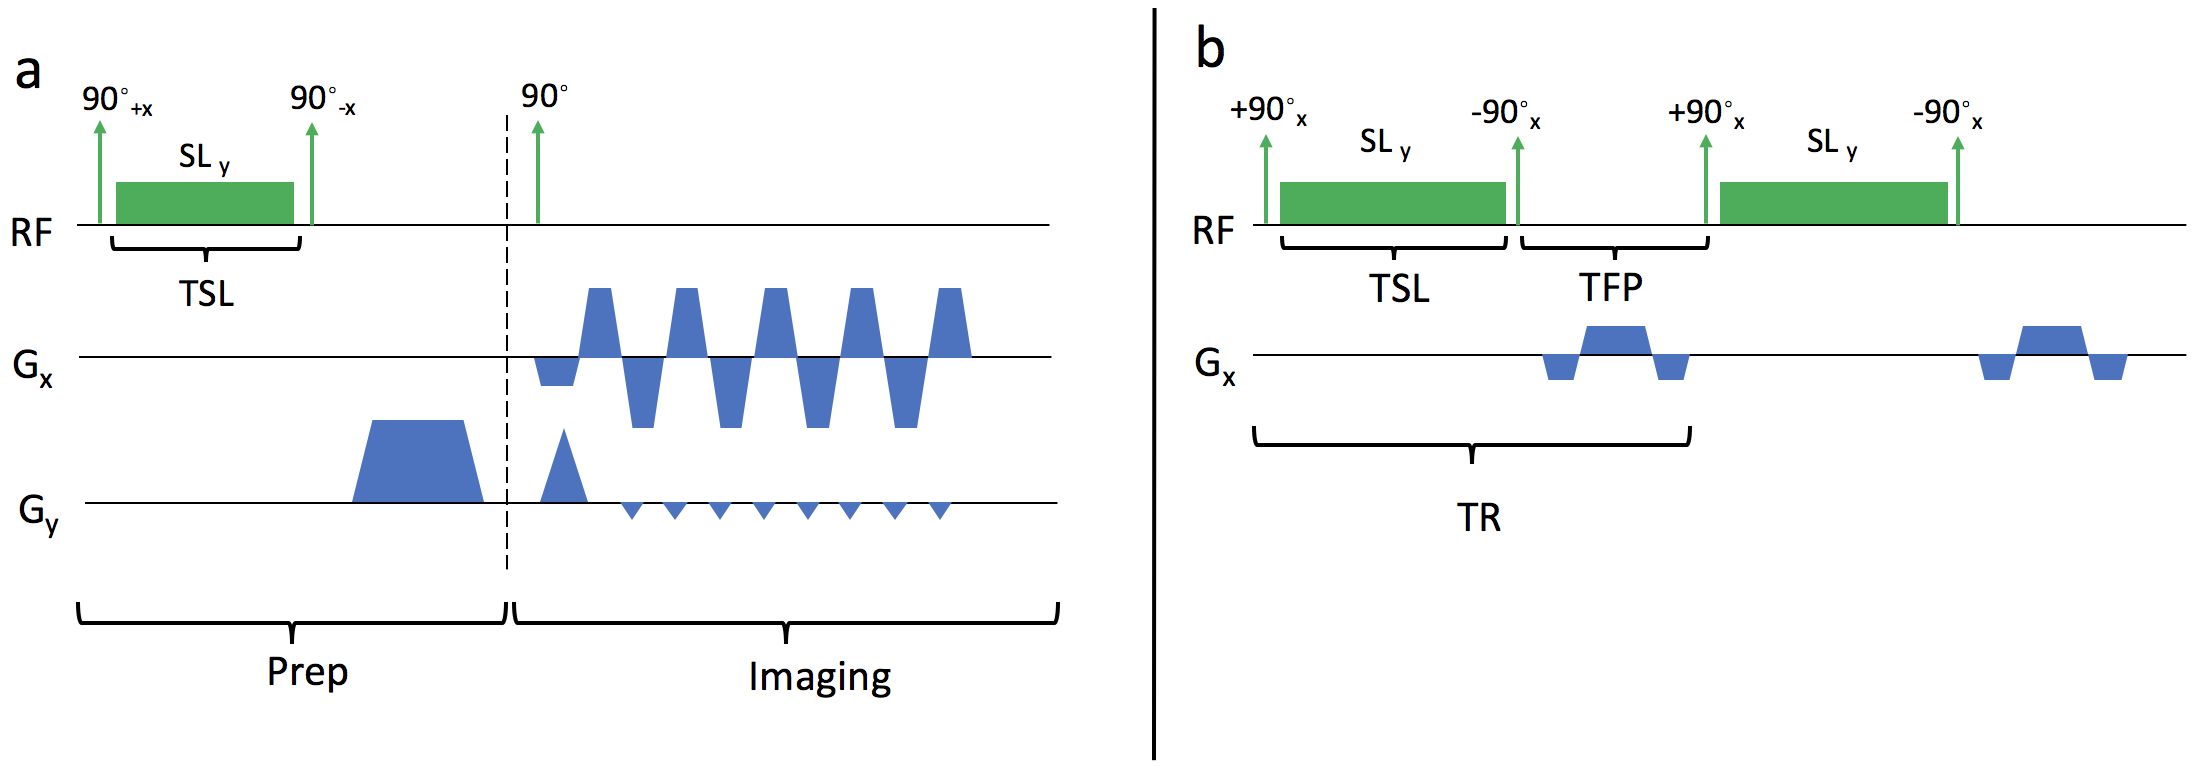
In conventional SIRS, a spin-lock preparation module sensitizes the magnetization to a low-frequency external field (Figure 1a). This field then acts as an RF pulse, tipping the magnetization and providing a contrast. This contrast is small and easily contaminated by other mechanisms such as BOLD. To remove BOLD contamination, the SIRS method was implemented on a ULF scanner with field strength 6.5 mT3. Since operation at such low magnetic field results in low SNR, and the scanner’s low maximum gradient amplitude of 1 mT/m precludes single-shot techniques like EPI, high SNR efficiency is crucial. We therefore implemented the SIRS method in a steady-state fashion (Figure 1b). In this approach, the small tip from the external field during spin-lock effectively gives the RF excitation in a bSSFP sequence. This tip has the small value of α = γBstimTSL, where the magnetic field Bstim is very small. The signal can nonetheless be large, as it is well known that bSSFP can give a large signal with a small tip if phase is consistent between TRs4.
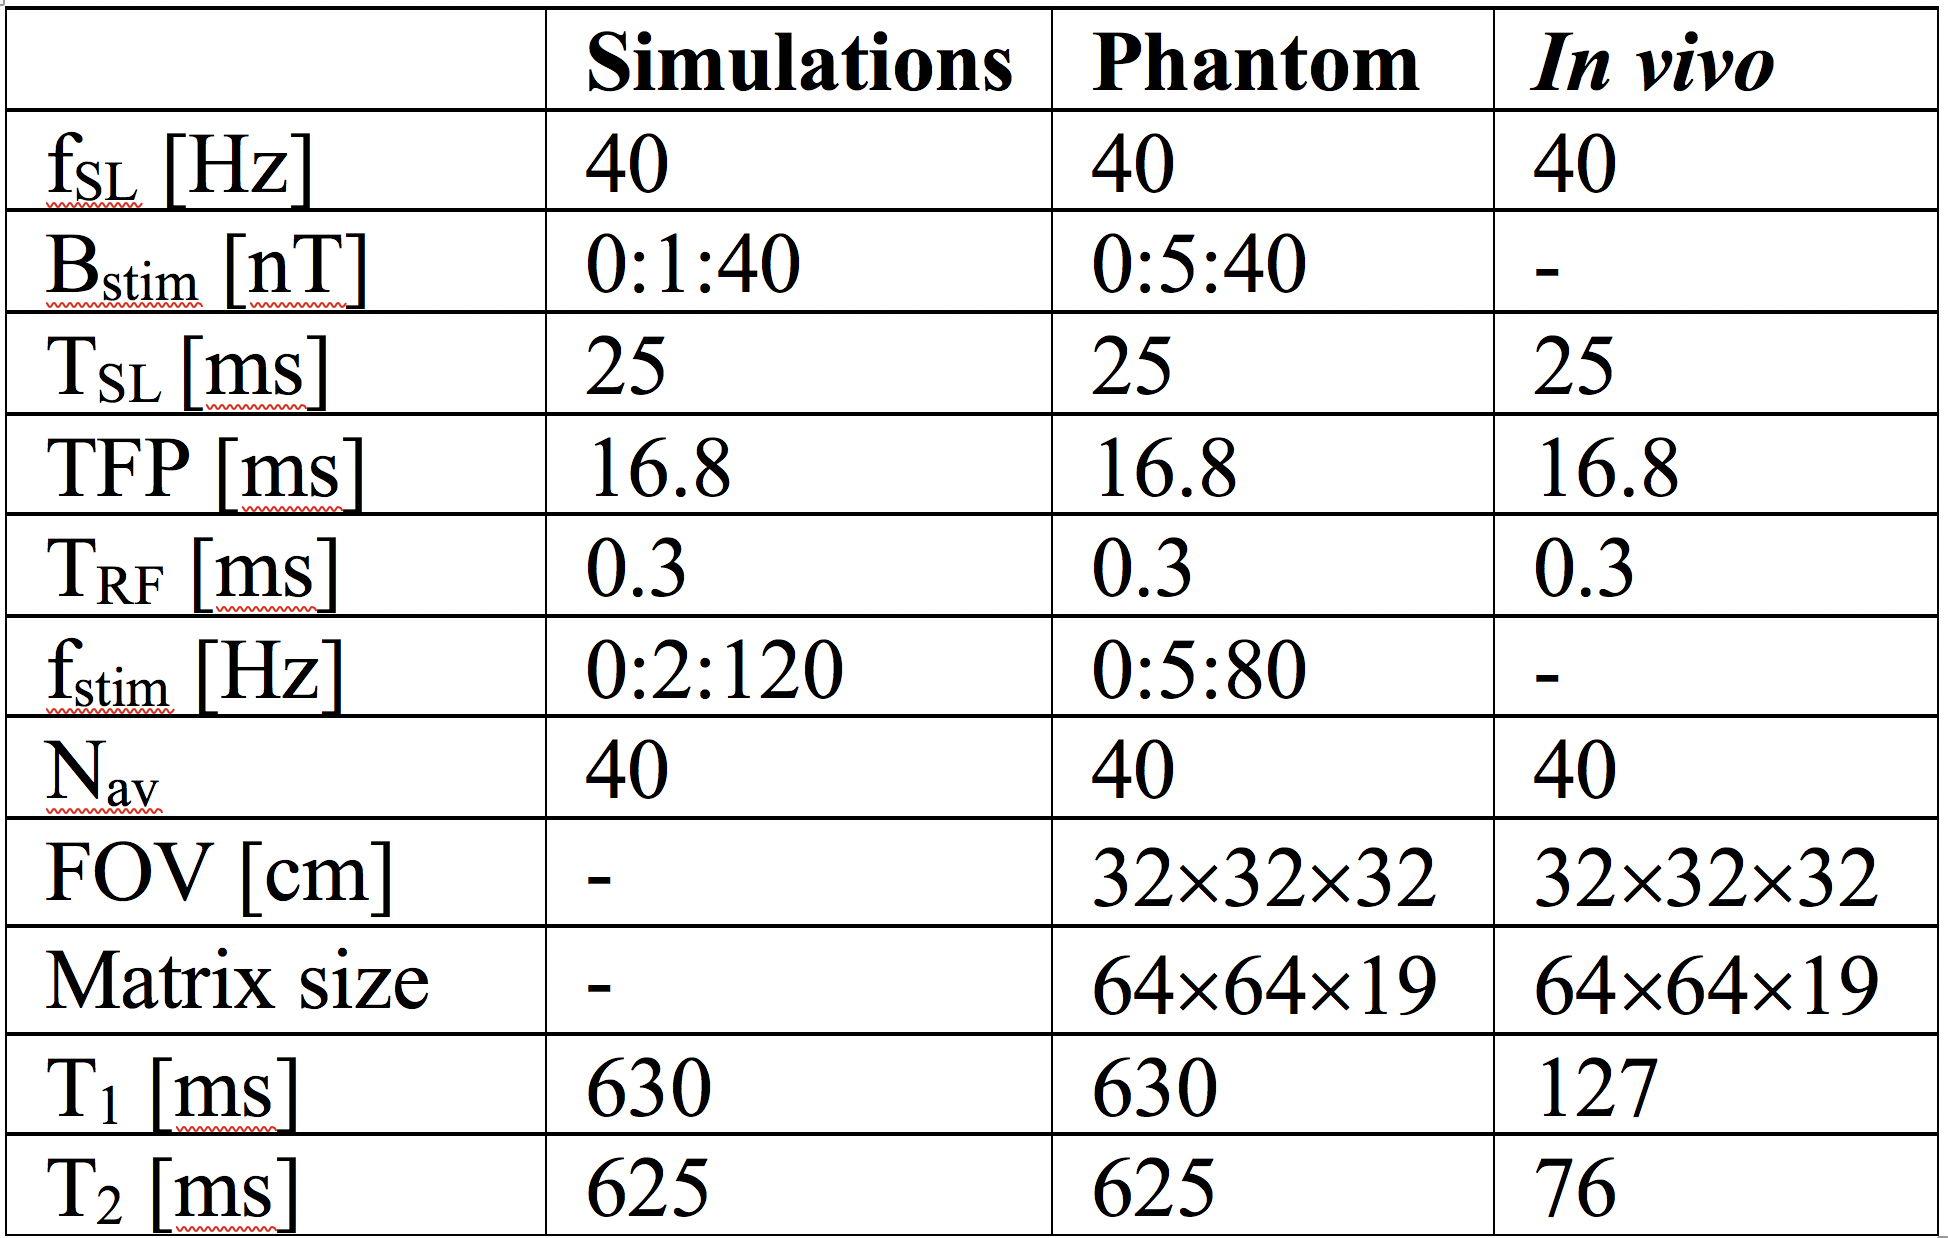
First, Bloch simulations of the steady-state SIRS sequence were performed in MATLAB (parameters in Table 1). Next, a spherical phantom, 20 cm in diameter, was created and filled with CuSO4 solution, giving T1 and T2 as shown in Table 1. A small wire loop was inserted into the phantom and connected to a voltage source. The source was set to produce a sinusoidal wave with frequencies fstim and field amplitudes Bstim in the center of the coil, shown in Table 1. The relationship between the voltage and the Bstim field at the coil center was calibrated with a magnetometer. Finally, the sequence was tested on two subjects in vivo (parameters in Table 1). The subjects lay supine in the ULF magnet and a sound was played through pneumatic head phones. The sound consisted of a long train of pulses (or “clicks”) of duration 1ms, spaced 25 ms apart, giving a stimulus frequency of 40 Hz. The steady-state SIRS sequence was tuned to be sensitive to frequencies of 40 Hz in the right auditory cortex5.
Results
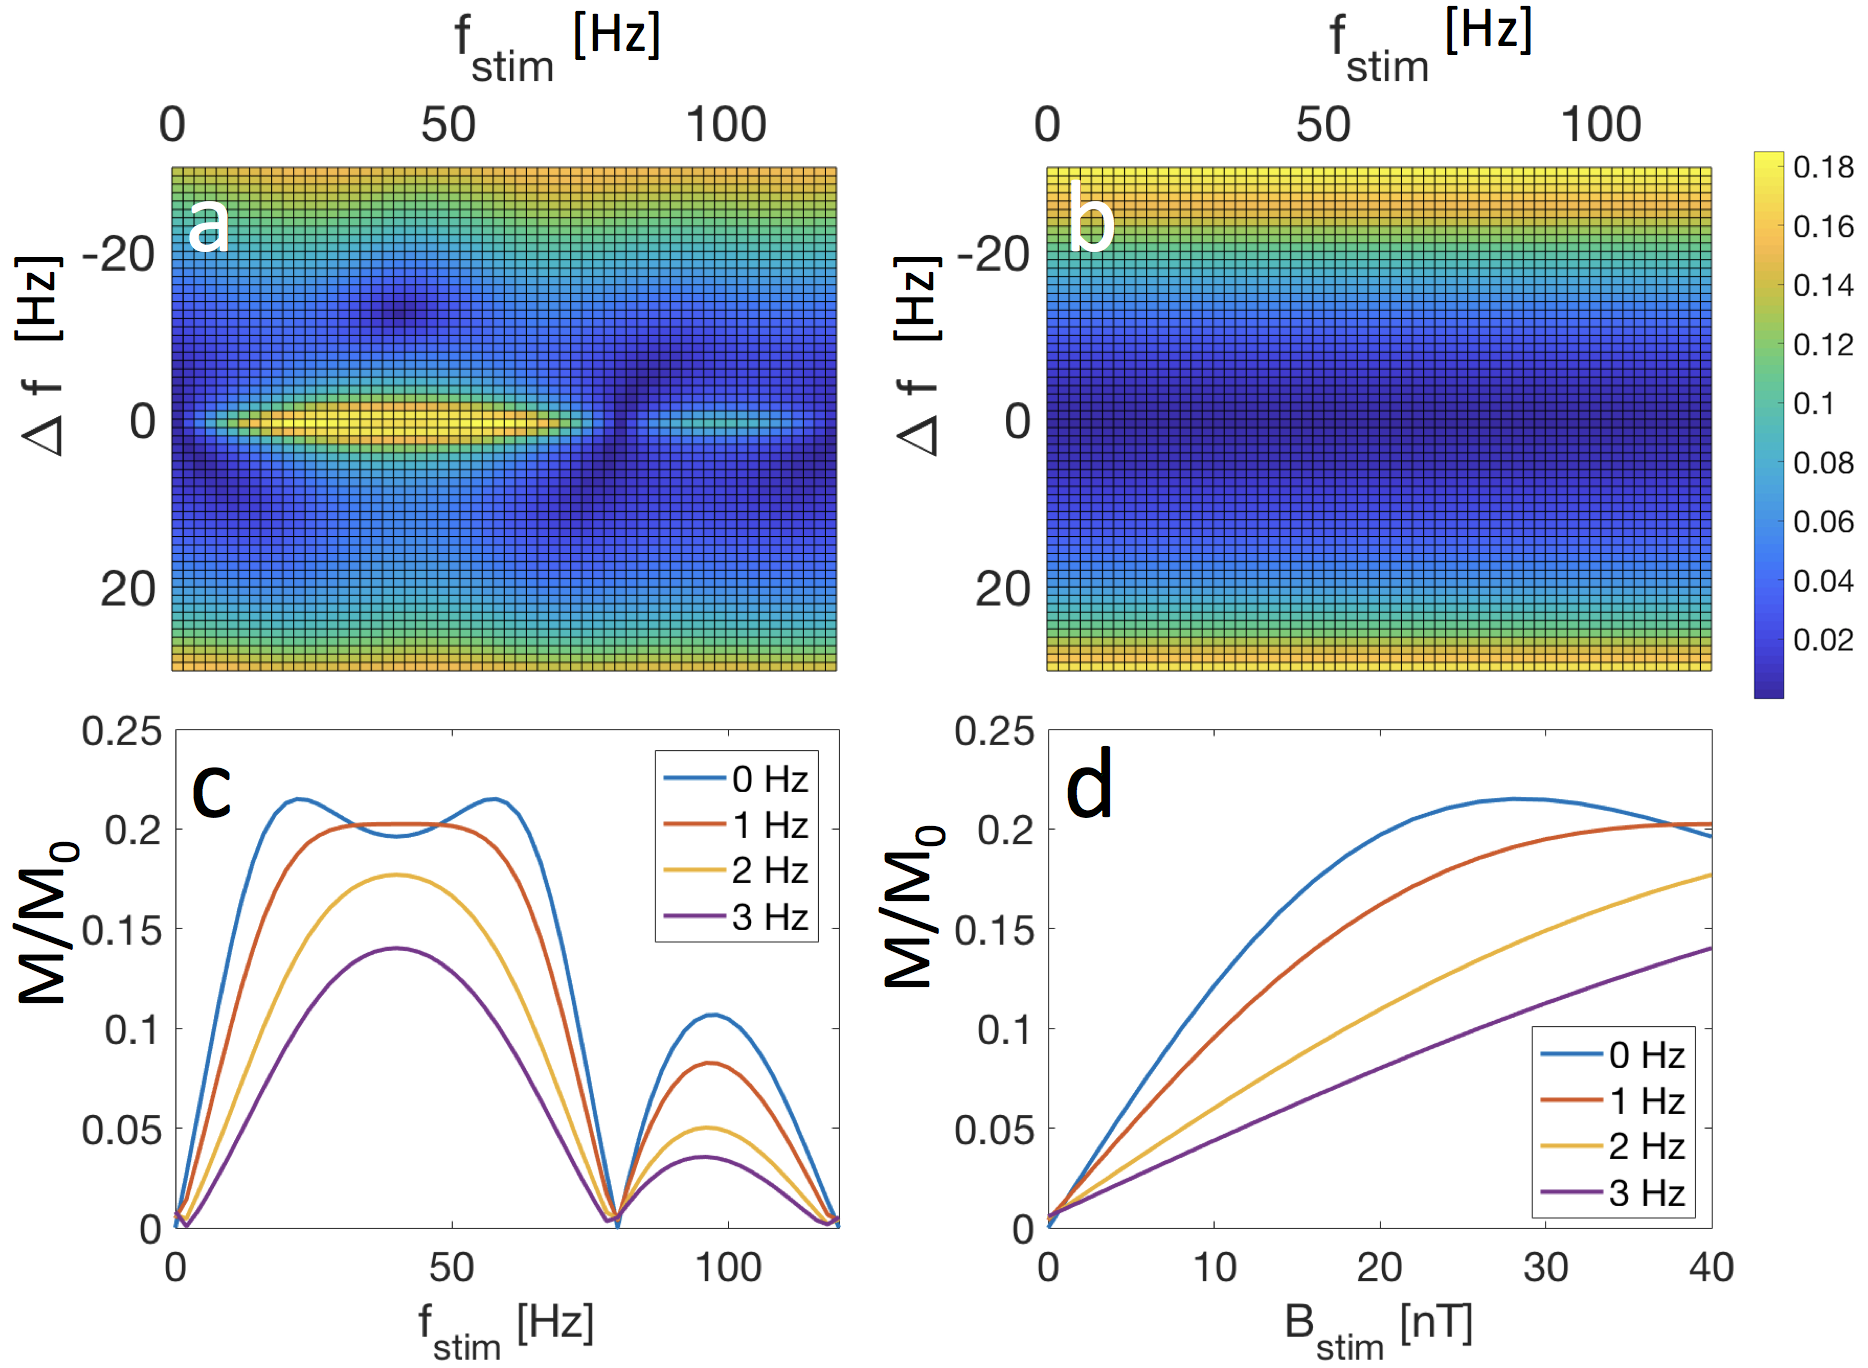
The simulation results are shown in Figure 2. The results demonstrate a strong signal response when fstim = fSL and the off-resonance is Δf = 0 Hz. As the stimulus frequency shifts away from fSL, the response eventually drops. As a function of off-resonance Δf, the response shows a spike, similar to bSSFP with a small RF amplitude.
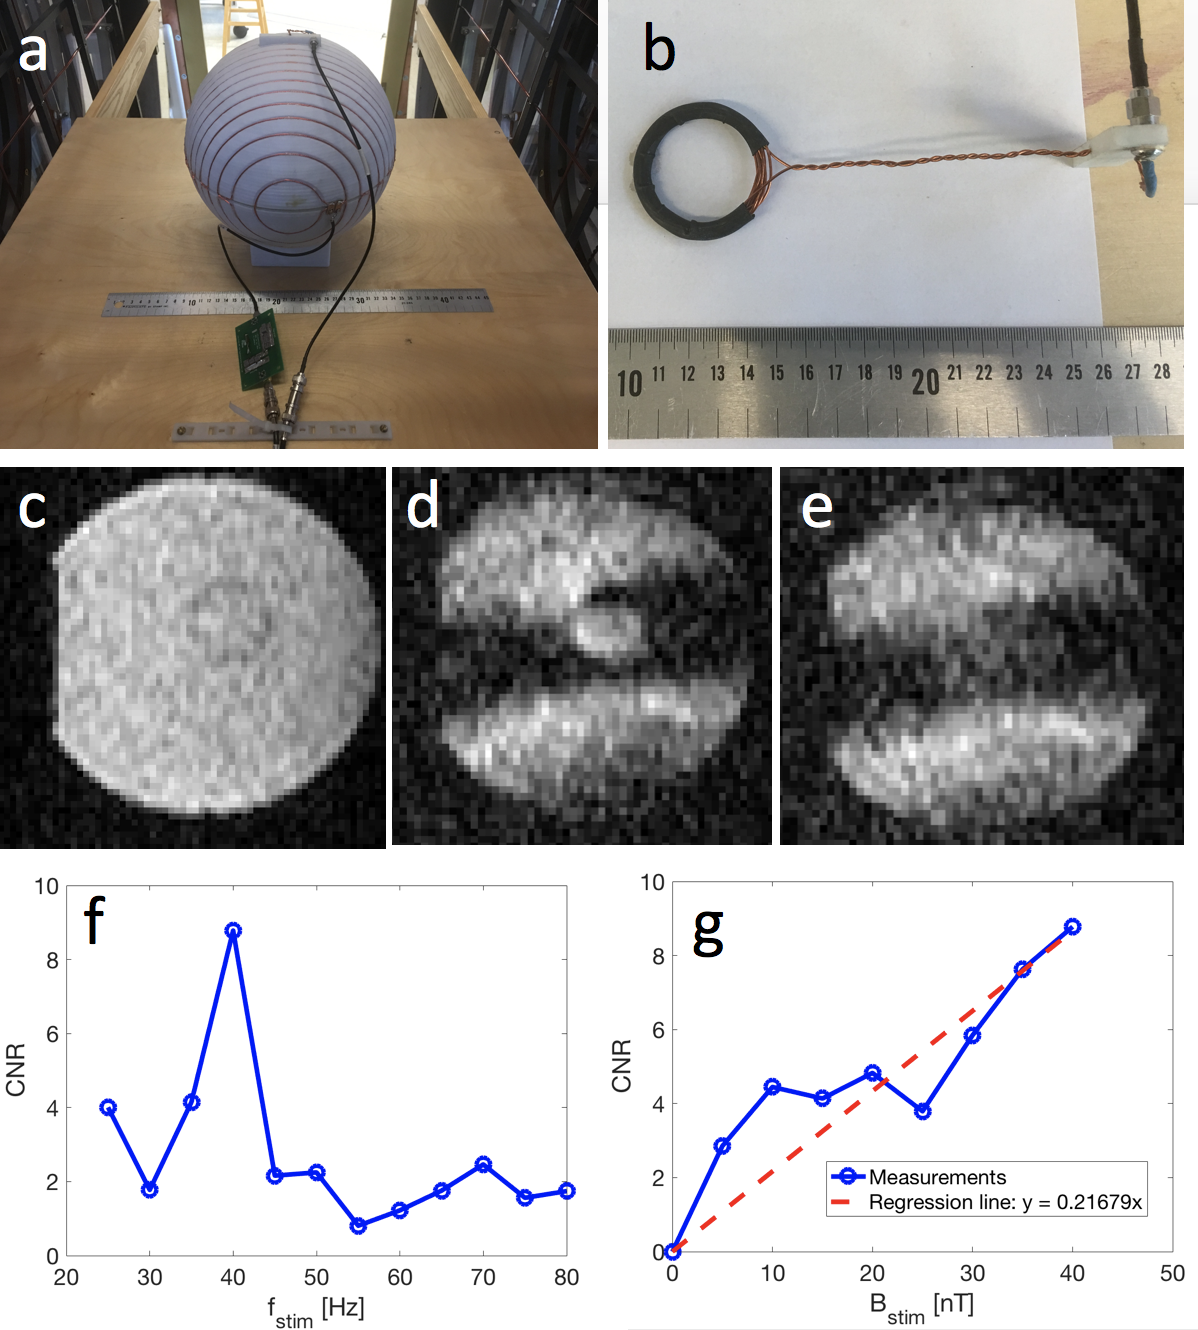
The phantom setup is shown in Figure 3. Figure 3c shows a normal bSSFP scan of the phantom as a reference. The small loop carrying the stimulus current is clearly visible. Figure 3d shows a sample image with fSL = 40 Hz and a stimulus of fstim = 40 Hz, Bstim = 40 nT turned on and off. The result agrees well with the simulations, showing a dark band where the magnetization is close to being on resonance and the stimulus field giving positive signal contrast.
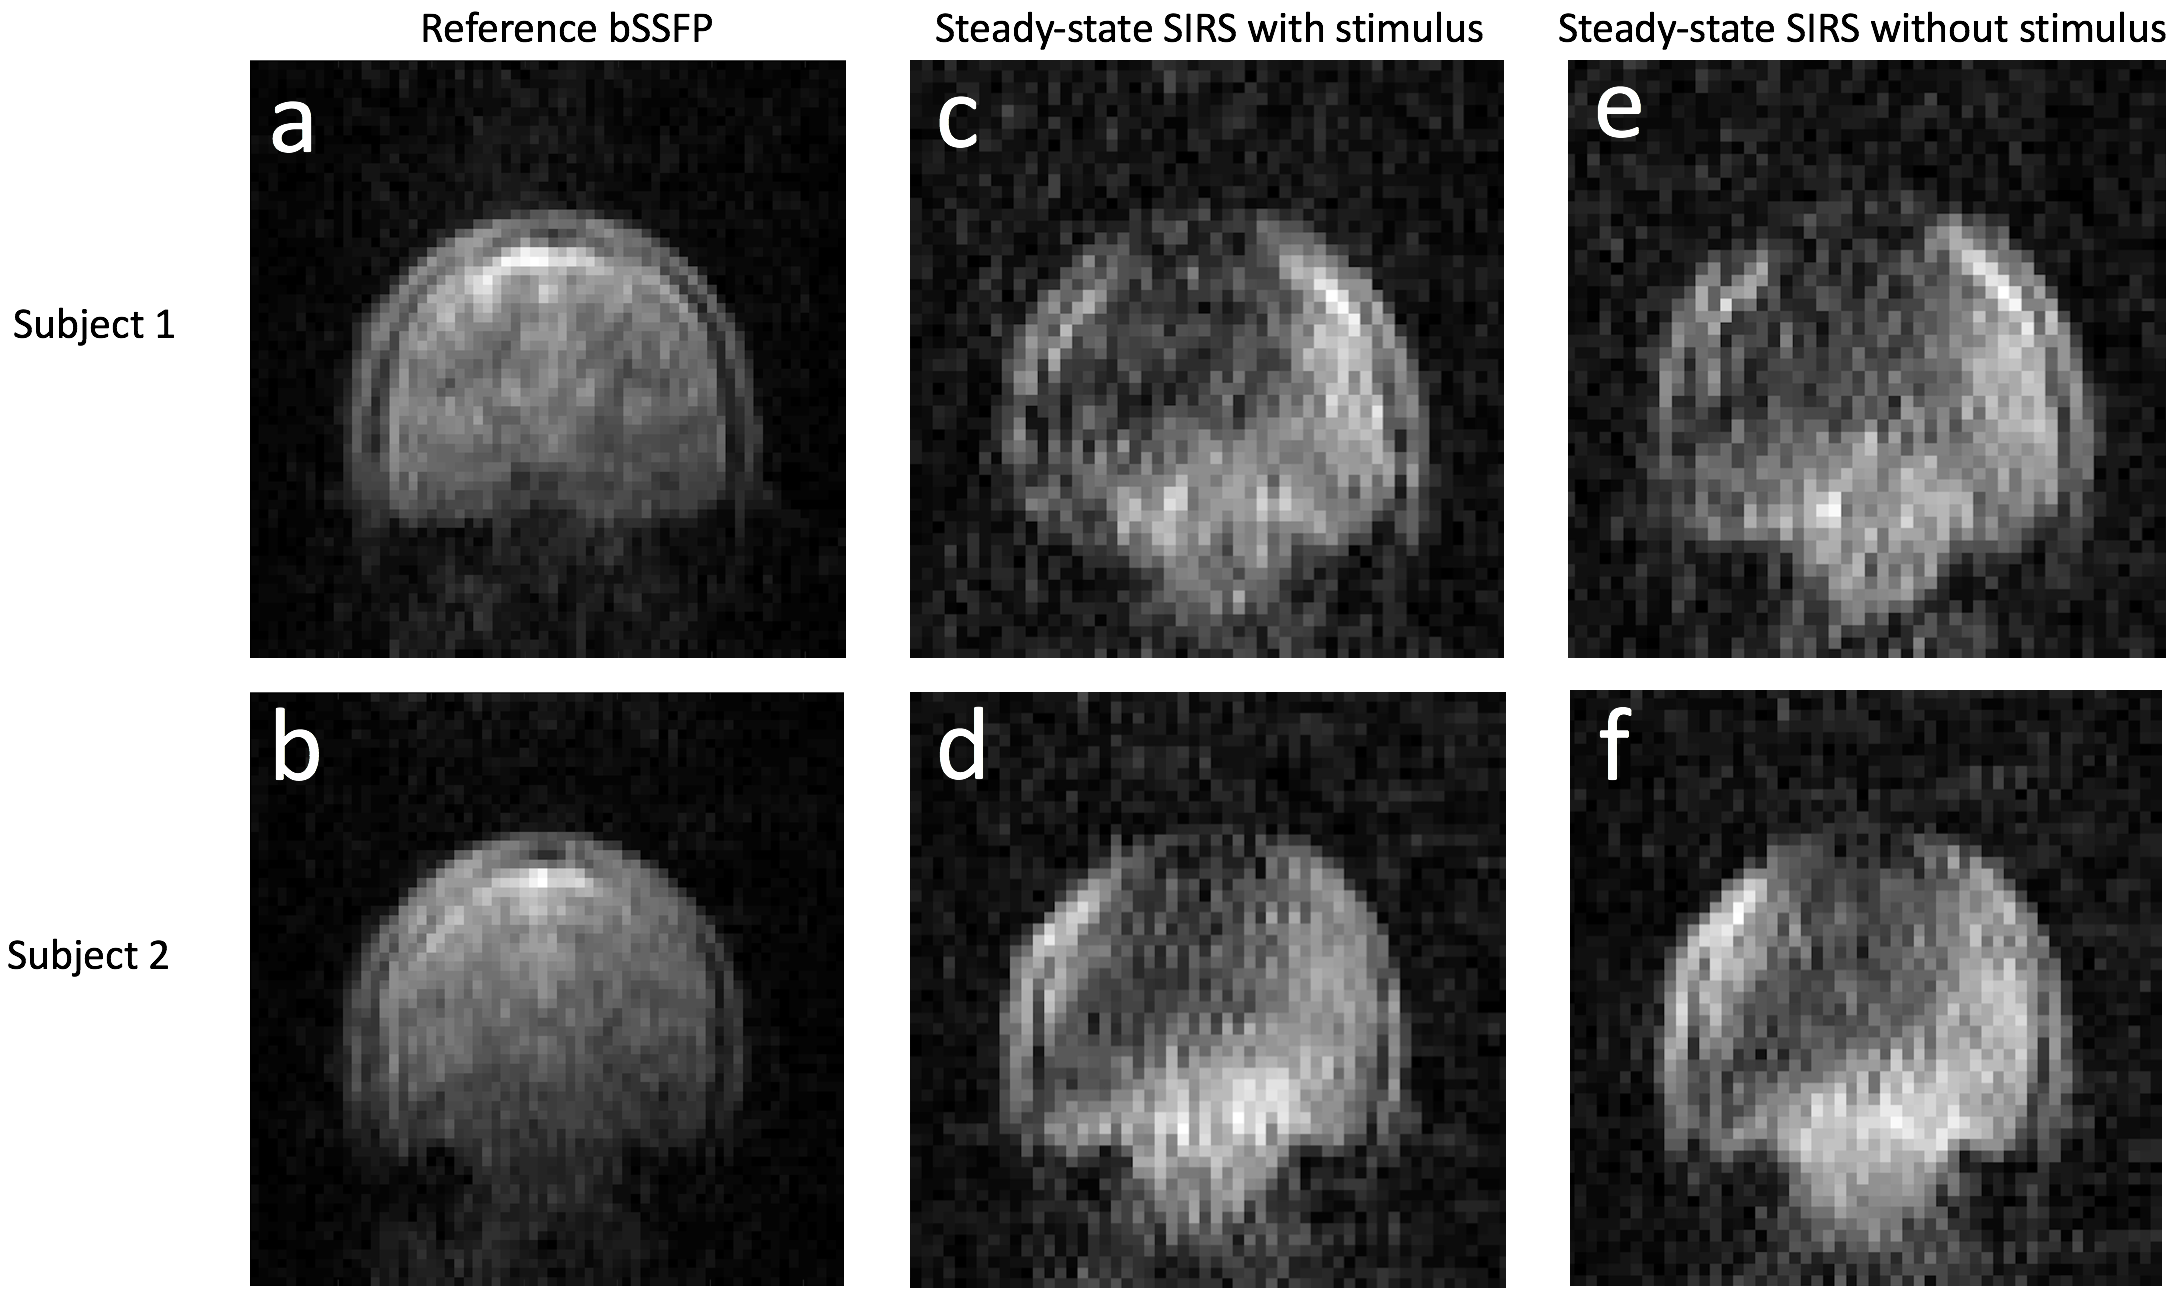
The in vivo results are shown in Figure 4. A similar banding pattern as in the simulations and phantom scans is visible, but no contrast difference can be seen between the scans with and without stimulus.
Discussion
The method presented takes advantage of certain unique aspects of the ULF system. Due to the low field, the spin-lock field can be applied every TR throughout the scan without risk of heating the subject. Furthermore, as can be seen from Figure 2, the sequence is only sensitive to stimuli within a narrow frequency range, with a small off-resonance Δf eliminating the contrast. This is well suited for a ULF system, which has small absolute frequency deviations. Unlike the phantom, no contrast was seen in vivo. This could be due to the low field amplitude or the inconsistent phase of the stimulus field, and likely a combination of the two.Conclusion
The SIRS sequence can be used in a steady-state manner to obtain a signal response from a low-amplitude, low-frequency AC field at ultra-low fields.Acknowledgements
DARPA 2016D006054References
1: Witzel et al. Neuroimage 2008;42:1357-1365. 2: Jiang et al. MRM 2016;75:519–526. 3: Sarracanie et al. Nature Scientific Reports 2015;5:15177. 4: Carr. Phys Rev 1958;112:1693–1701. 5: Picton et al. International Journal of Audiology 2003;42:177-219.Figures