4619
General Abnormality Detection in MR Images using a Generative Adversarial Network1Philips Research, Hamburg, Germany, 2University of Applied Sciences Karlsruhe, Karlsruhe, Germany
Synopsis
In this study, a Generative Adversarial Network is used for detection of abnormalities in MR brain images such as lesions, artifacts etc. Given a query image, a generative model that is trained to create normal appearing brain images is used to find a best match. Since abnormalities cannot be reproduced accurately by the generative model, pathologies and artifacts become apparent.
Introduction
Neural networks have shown great potential for automatic detection of abnormal structures in medical images - both pathologies1 and artifacts2. The main requirement for such convincing performance, however, is the availability of large amounts of high-quality annotations for each abnormality to be detected. For many pathologies (in particular rare diseases) and artifacts, such annotations are usually not available.
Here we demonstrate a general abnormality detection technique (e.g. lesions, artifacts etc.) based on a Generative Adversarial Network3 (GAN) that does not require annotations of abnormal structures. It relies on an unsupervised learning approach with the aim to train a generative model to cover the distribution of all normal images, thereby allowing for the detection of all possible abnormalities.
Methods
A large dataset of normal MP-RAGE brain MR images was generated based on the ADNI dataset4. Images with motion artifacts were discarded. All remaining images were normalized on a volume level and cropped to a matrix size of 160 x 256. Only the central 30 slices were selected to reduce the variability of the data to be modeled, resulting in training and testing datasets of 43,320 and 750 images, respectively. Data augmentation was realized using random translation, rotation, horizontal flipping, and deformation. A symmetric GAN was then trained to learn the manifold of these MR images.
The Generator consisted of 6 transposed convolutional layers (kernel size k=4, stride s=2), each followed by batch normalization and a Recitified Linear Unit (ReLU). A vector of 200 random numbers provided the input to the Generator. The Discriminator consisted for 6 convolutional layers (k=4, s=2), where batch normalization and leaky ReLUs were used. The GAN was trained for 90 epochs using the Adam optimizer. An additional regularization term was implemented that penalized large gradients of the discriminator on real data, i.e. on the true data distribution5.
During evaluation, all parameters of the networks were kept fixed, and backpropagation was used to determine the optimal input vector z that produced the GAN-generated image most similar to the query image. The loss function for this search was given by
$$L(z)=(1-\alpha)\sum_{x,y}|I_q(x,y)-I_g(x,y;z)|^2 + \alpha|D(I_g(x,y;z))-1|^2$$
where $$$\alpha$$$ is a weighting factor (chosen as 0.02), $$$I_q$$$ and $$$I_g$$$ are the query and generated images, respectively, and $$$D$$$ is the Discriminator. While the first term enforces similar image content in query and generated image, the second term ensures that generated images lie on the manifold of normal images.
To simulate abnormal tissue
structures, local hyper- and hypointensities were added to a subset of the test
images. To simulate typical MR artifacts, fold-over artifacts due to
incorrectly placed FOV as well as susceptibility-induced signal voids were
added to another subset of the test images.
Results
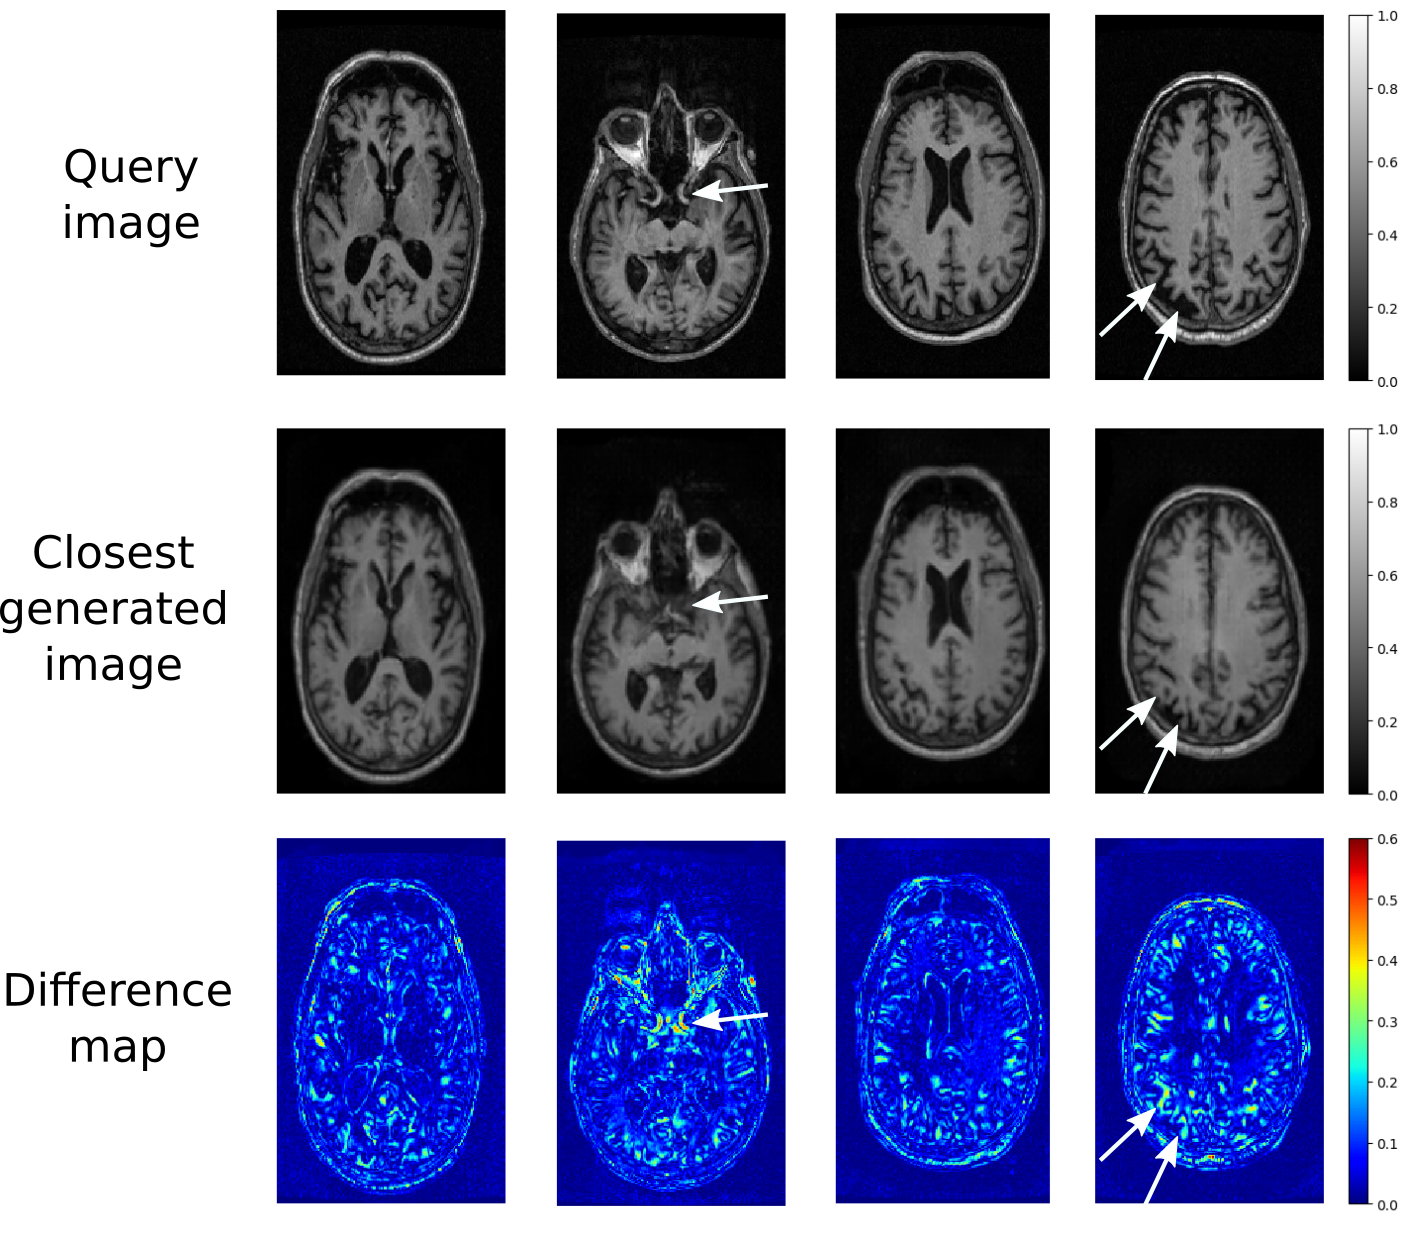
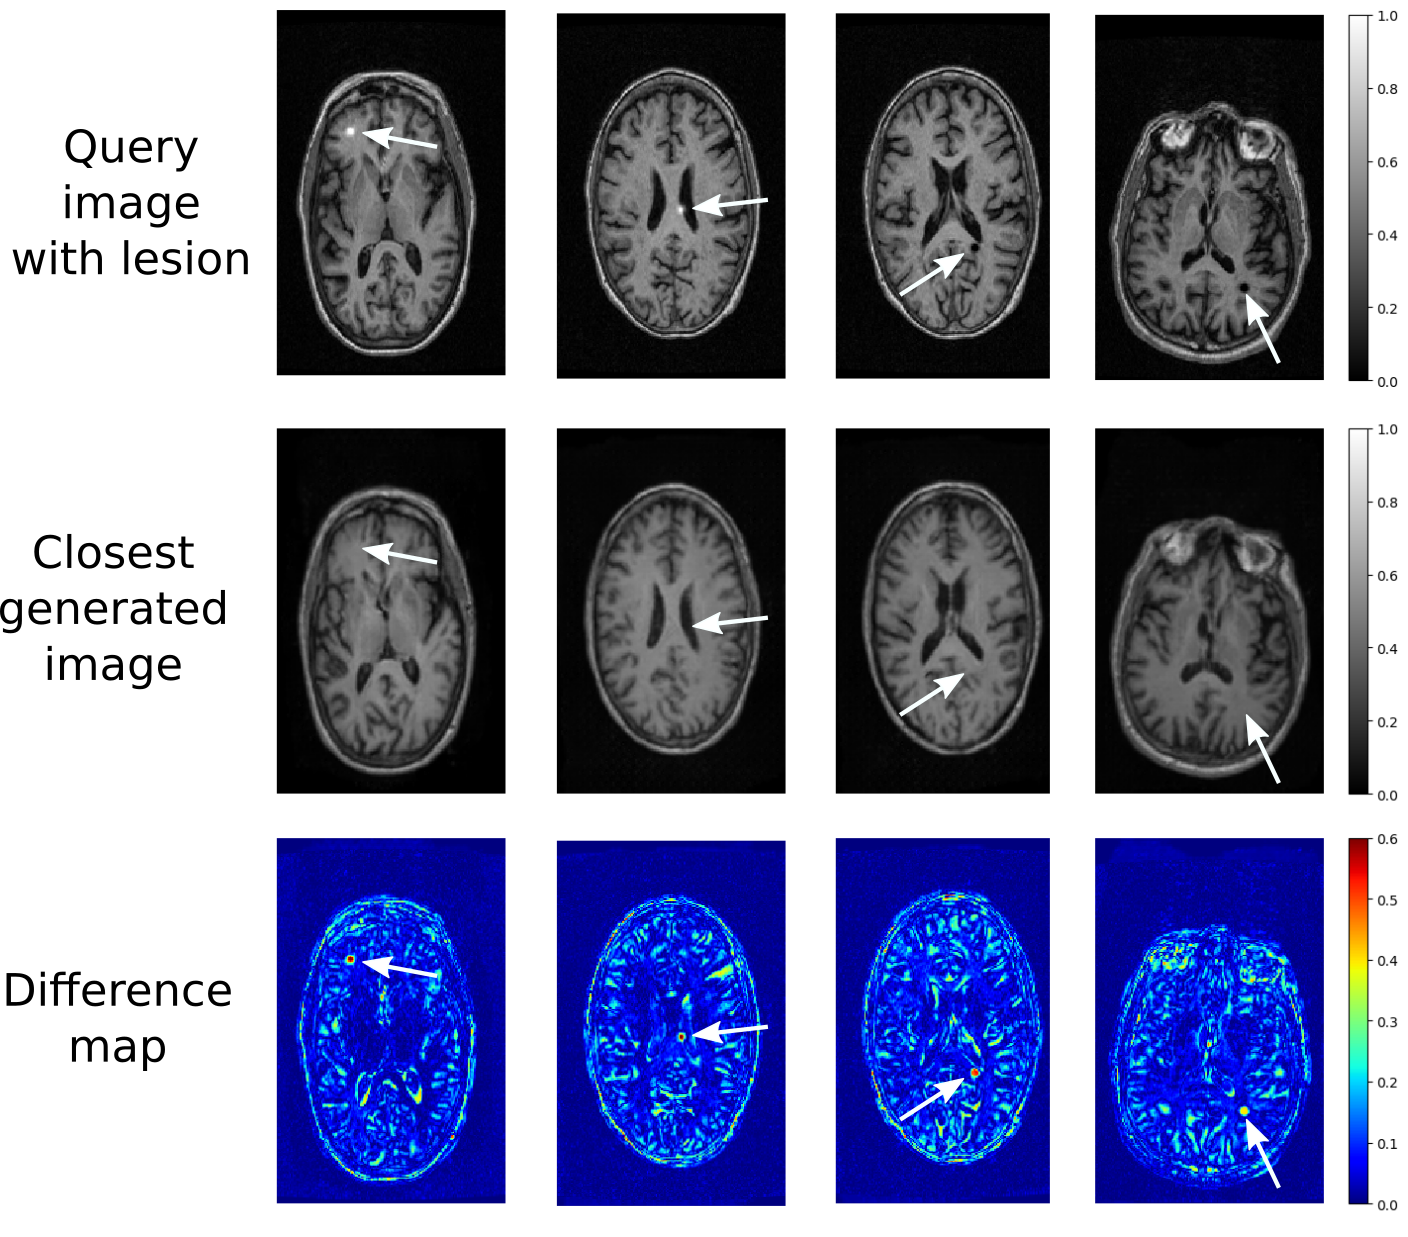
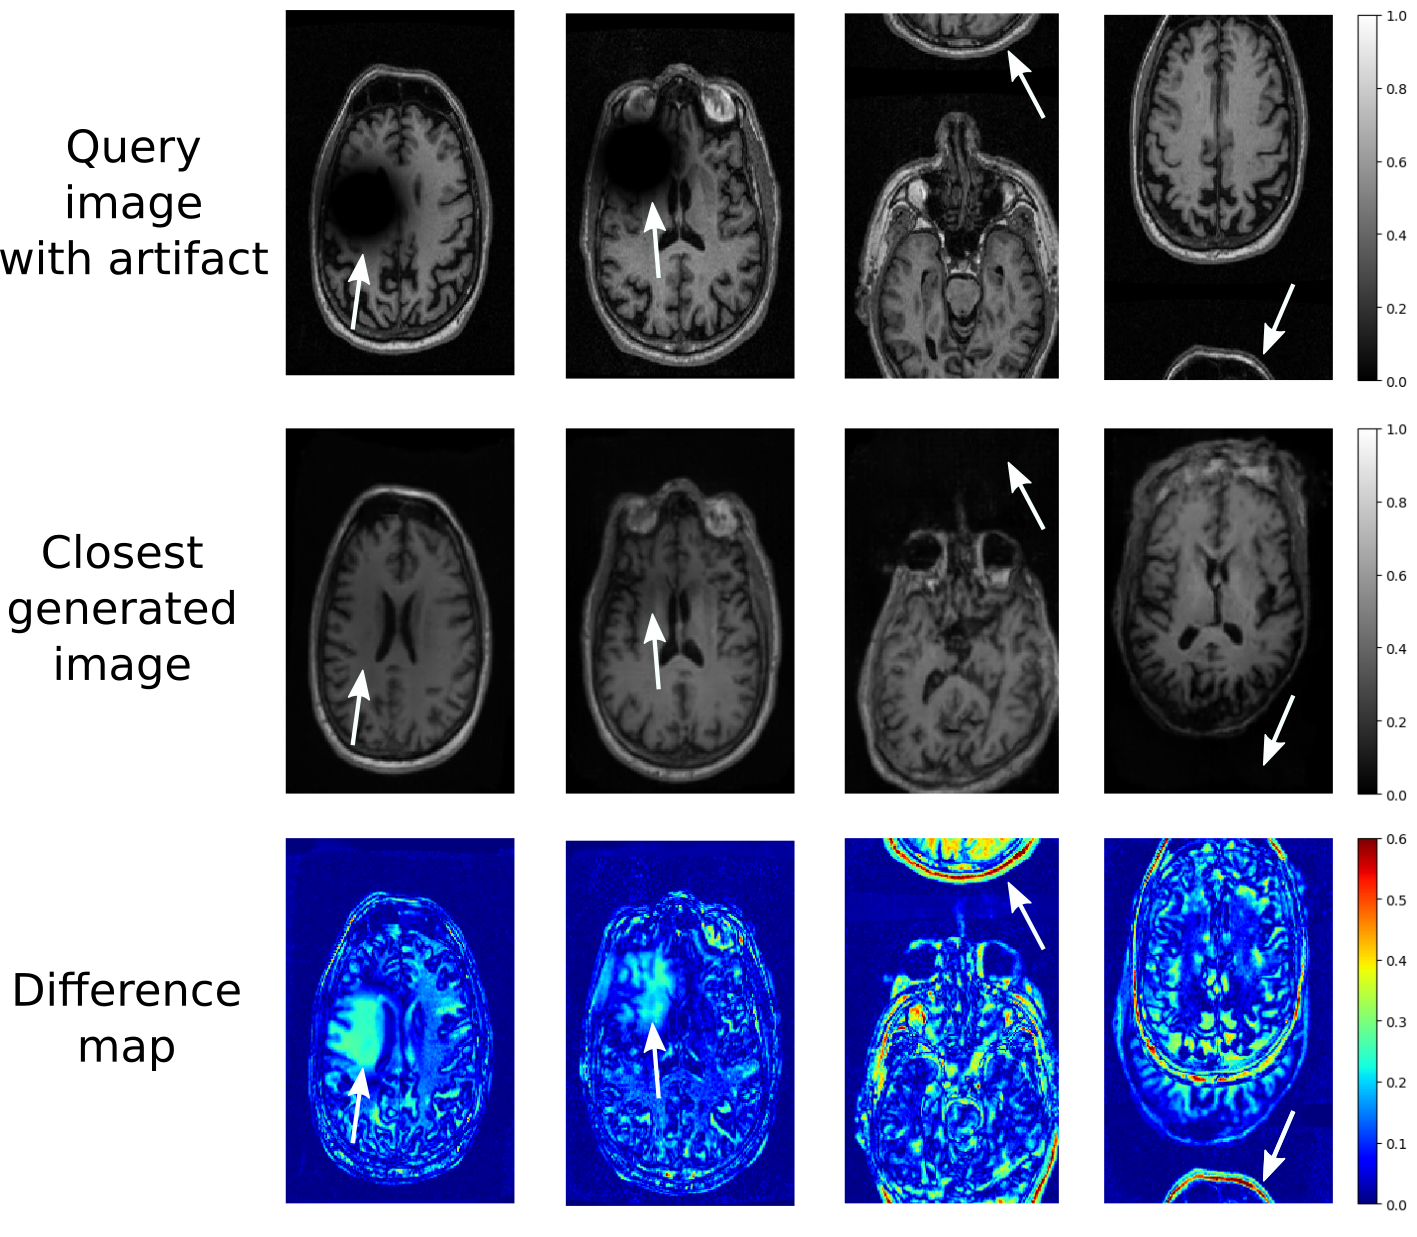
Figure 1 shows the performance of the method for query images from the test dataset without abnormalities. In all cases, a visually similar image could be created by the generator. Minor anatomical details were not accurately reproduced in some cases, such as vessels or cortical structures. The results for query images with artificial pathologies are shown in Figure 2. While the overall anatomies were again correctly reproduced, the local hyper- and hypointense lesions could not be created by the generator, and are therefore clearly visible in the difference maps. Similarly, the results for signal voids and wrap-around artifacts, shown in Figure 3, demonstrate that both artifact types could not be accurately reproduced by the generator, leading to large values in the difference maps.Discussion
The presented method relies on the availability of a large dataset of normal, i.e. healthy and artifact-free images. Ideally, this dataset should cover the entire range of healthy anatomical variations – otherwise, false-positive detections may occur for structures that were not contained in the training dataset. Consequently, translation of this method to even larger datasets may allow for even more accurate reconstruction of healthy anatomical structures, thereby increasing the sensitivity to subtle artifacts and pathologies. Future works should also include a detailed quantitative evaluation, ideally using manual reference segmentations of in vivo abnormalities.Conclusion
In this feasibility study, we presented a GAN-based method for automatic detection of abnormal structures in MR images. It requires a large dataset of normal images with high anatomical variability, but no annotations of particular pathologies or artifacts.Acknowledgements
No acknowledgement found.References
1. Pereira S, et al. Brain tumor segmentation using convolutional neural networks in MRI images. IEEE Trans. Med. Imaging 2016;35:1240–51.
2. Demesmaeker R, et al. Deep Learning for Automated Medical Image Quality Assessment: Proof of Concept in Whole-Heart Magnetic Resonance Imaging. Proc ISMRM 2018; no. 4784.
3. Goodfellow I, et al. Generative adversarial nets. Advances in neural information processing systems 2014:2672-2680.
4. Jack Jr CR, et al. The Alzheimer's disease neuroimaging initiative (ADNI): MRI methods. J Magn Reson Imaging 2008;27(4):685-91.
5. Mescheder L. et al. Which Training Methods for GANs do actually Converge? International Conference on Machine Learning 2018.
Figures