4618
An Investigation into the Origins of an MRI Artifact Induced by Increasing Temperature1Medical Biophysics, University of Toronto, Toronto, ON, Canada, 2Physical Sciences, Sunnybrook Health Sciences Centre, Toronto, ON, Canada
Synopsis
An artifact has been observed in pure water samples after increasing the temperature above 25 °C, regardless of the heating mechanism. This study aims to determine the origins of the temperature-induced artifact by using MR thermometry and T1 relaxation to investigate samples containing increasing concentrations of agar. The addition of a small concentration (0.1%) of agar eliminates the temperature artifact suggesting that the increased viscosity of the samples decreases convection currents. Moreover, this addition of a small concentration of agar study provides a practical means of experimentally scanning samples at physiological temperature.
Introduction
When scanning MR phantoms, it is desirable to recreate the conditions of human physiology. This investigation addresses the issue of temperature stability in pure water phantoms. It has been observed that scanning a pure water phantom after it has been heated above room temperature will produce a consistent and reproducible artifact regardless of the heating mechanism. Another crucial observation is that with the addition of a small concentration (0.1%) of agar, the temperature-induced artifact disappears. The goal of this phantom investigation is to determine the origin of the artifact induced by increasing the temperature in a pure water sample.Methods
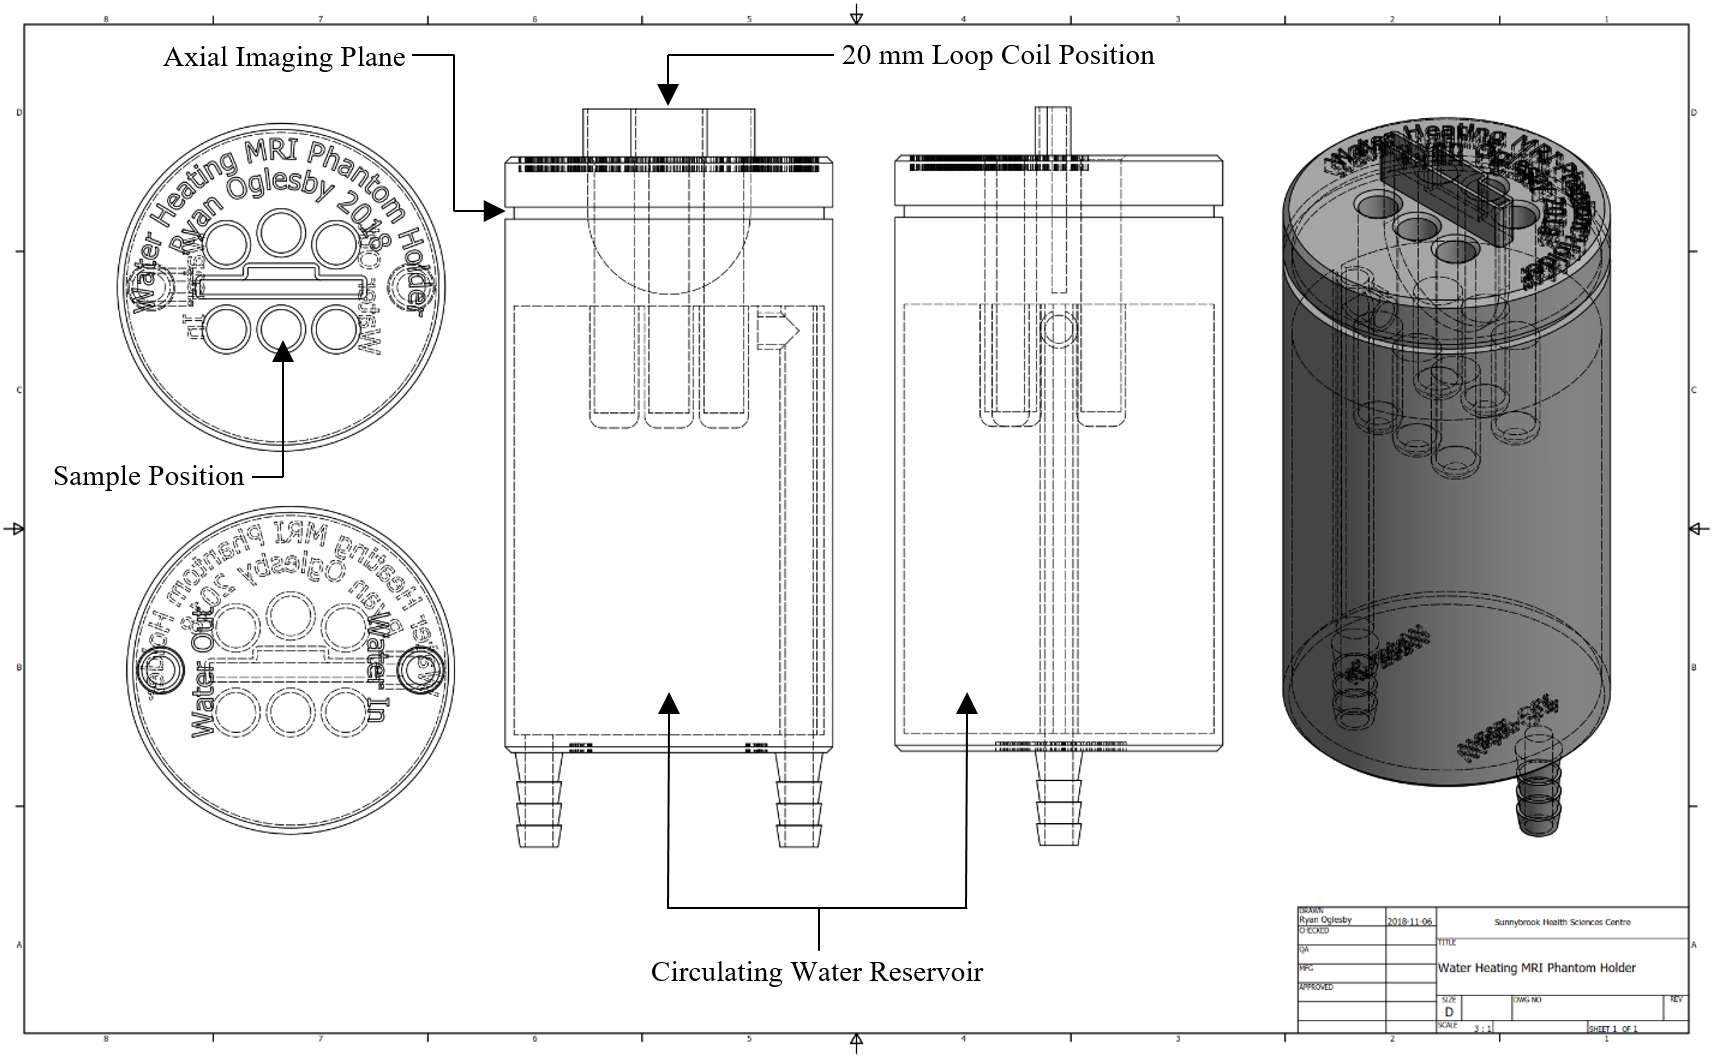
Six samples were prepared with concentrations of agar ranging from 0–5 mM (molecular weight = 336.337 g/mol)1 at a pH of 7.0 ± 0.3. Samples were scanned at 7T (BioSpec 70/30 USR, Bruker BioSpin, Billerica, MA) using a temperature controlled phantom holder stabilized at 37.0 ± 0.5 °C (Fig. 1). Single slice images were acquired using fast low angle shot (FLASH; TR = 100 ms, TE = 4 ms, FOV = 25 × 25 mm, matrix = 128 × 128, and FA = 30°) to localize the samples and demonstrate the artifact. A T1 map was calculated from inversion recovery-prepared rapid acquisition with refocused echoes (RARE; TR = 10000 ms, TE = 6 ms, FOV = 25 × 25 mm, matrix = 64 × 64, and TI = 30, 100, 320, 1000, 3200, 10000 ms). Fitting was done in MATLAB using a monoexponential model to calculate voxelwise T1 relaxation time. Temperature change was calculated using multiple gradient echo (MGE; TR = 100 ms, TE = 2 ms, FOV = 25 × 25 mm, matrix = 128 × 128, FA = 30°, and echoes = 4). Using the phase ($$$\phi$$$) images collected before ($$$T_0$$$ = 25 °C) and after ($$$T$$$ = 37 °C) heating the samples, the change in temperature ($$$\Delta T$$$) was calculated by the following equation2:
$$ \Delta T = \frac{\phi(T_0) - \phi(T)}{\gamma\alpha B_0 TE} $$
where $$$\gamma$$$ is the gyromagnetic ratio of the proton, $$$\alpha$$$ is the proton resonance frequency change coefficient ($$$\alpha$$$ = -0.01 ppm/°C for pure water3), and B0 is the magnetic field strength. Calculations were done in MATLAB.
Results
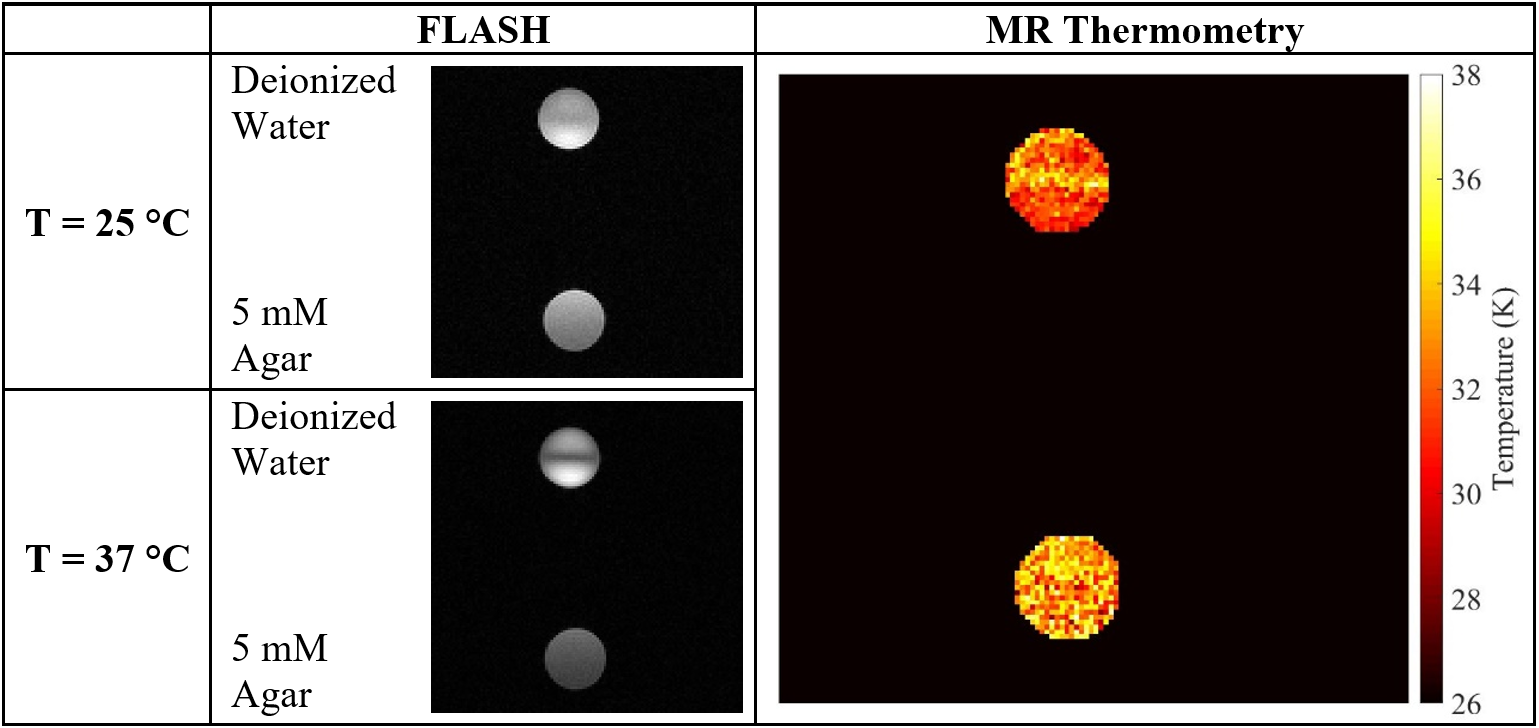
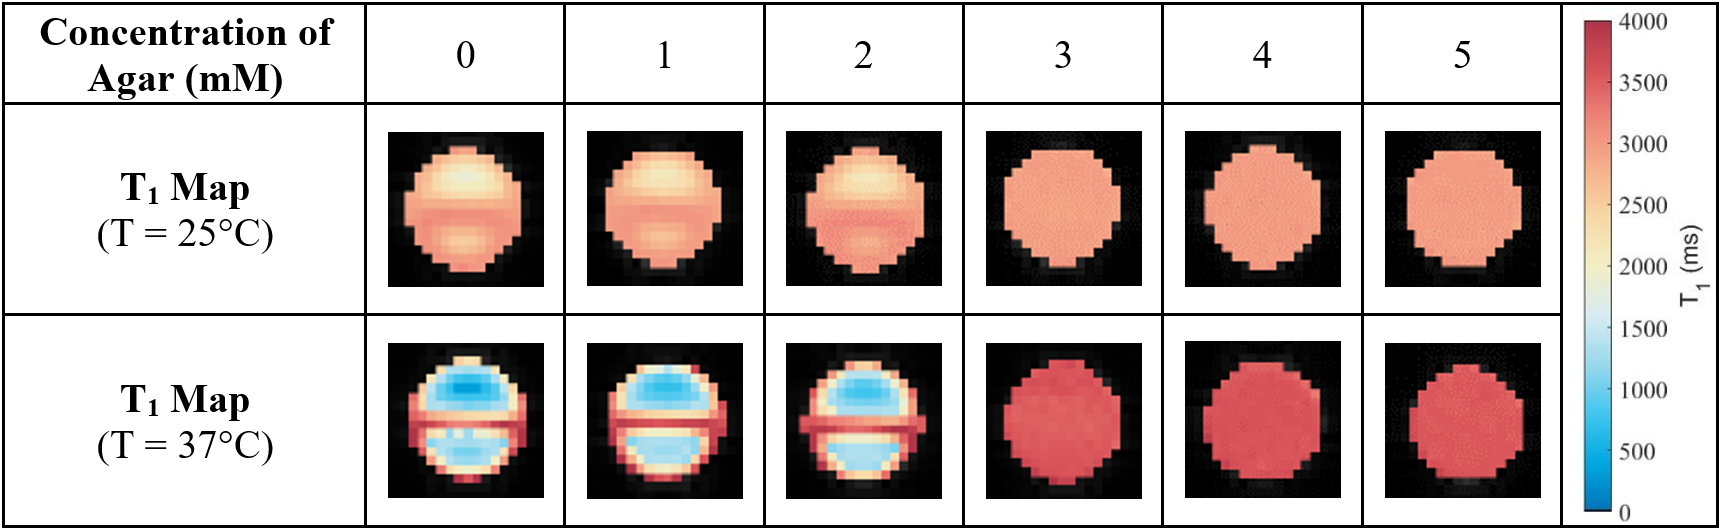
The FLASH images clearly illustrate the temperature induced artifact after heating the samples to 37 °C (Fig. 2 – Left). Mapping the temperature axially across the sample holder demonstrates a temperature gradient with the warmest part of the sample located along the center line of the artifact (Fig. 2 – Right). It should also be noted that the solution temperature from MR thermometry did not uniformly reach the desired 37 °C, although direct measurement (via fiber optic temperature probe) indicated otherwise. A more precise demonstration was given by the T1 relaxation maps, in which the artifact occurred in samples with up to 2–3 mM of agar, above which the temperature-induced artifact disappeared (Fig. 3).Discussion
The temperature gradient observed using MR thermometry in pure water and water with the addition of agar (eliminating the temperature gradient) suggests that the viscosity of the sample plays a role in the production of this temperature-induced artifact. Circulating convection currents within the samples are likely the origin of the temperature artifact. However, further confirmation, possibly using diffusion-weighted imaging need to be run.Conclusion
The current hypothesis is that the origin of these temperature-induced artifacts are convection currents, which only occur in water with up to 2–3 mM of agar. The small concentration (0.1%) of agar needed to eliminate the temperature artifact does not greatly affect the other relevant MR parameters required for phantom studies (e.g., those found in CEST signal models). Therefore, the proposed method of heating with the addition of agar is a suitable experimental design for metabolic phantom investigations.Acknowledgements
We thank the Canadian Institutes for Health Research (PJT148660) for financial support.References
1. National Center for Biotechnology Information. PubChem Compound Database; CID=71571511. https://pubchem.ncbi.nlm.nih.gov/compound/71571511. Accessed Nov. 7, 2018.
2. Rieke V and Butts Pauly K. MR Thermometry. J Magn Reson Imaging. 2008;27(2):376-390.
3. Chung AH, Hynynen K, Colucci V, et al. Optimization of spoiled gradient-echo phase imaging for in vivo localization of a focused ultrasound beam. Magn Reson Med. 1996;36(5):745-752.
Figures