4617
MR Optimum – A web-based application for signal-to-noise ratio evaluation.1Department of Radiology, Bernard and Irene Schwartz Center for Biomedical Imaging, New York University School of Medicine, New York, NY, United States, 2Department of Radiology, Center for Advanced Imaging Innovation and Research (CAI2R), New York University School of Medicine, New York, NY, United States, 3Sackler Institute of Graduate Biomedical Sciences, New York University School of Medicine, New York, NY, United States
Synopsis
The signal-to-noise ratio (SNR) is a commonly used metric to evaluate image quality and radiofrequency coil performance in MRI. However, its calculation could be challenging. Here we introduce MR Optimum, a novel web-based application for the evaluation of SNR. By means of a user-friendly web GUI, readily available via any internet browser, it provides access to various methods for SNR calculation. The computing unit can be installed on a local server or distributed over the cloud. Results can be visualized, analyzed and exported in various formats. MR Optimum could help standardizing how SNR is calculated and reported in scientific publications.
Introduction
The Signal to Noise Ratio (SNR) is commonly used as a metric to assess image quality and radiofrequency detector coil performance in MRI. However, accurate estimation of the SNR can be challenging. For example, there are several methods to calculate SNR, which must be chosen depending on the available data 1. In the case of coil arrays, different methods can yield different SNR values, based on how the array elements are combined. Furthermore, an erroneous choice of the SNR calculation method can lead to incorrect estimation of the spatial noise distribution in parallel imaging 2. The aim of this work was to develop an easy-to-use web-based application for SNR calculation, which could help standardizing the way SNR is calculated and reported in scientific articles. We named this software tool “MR Optimum”.Software Architecture and Features
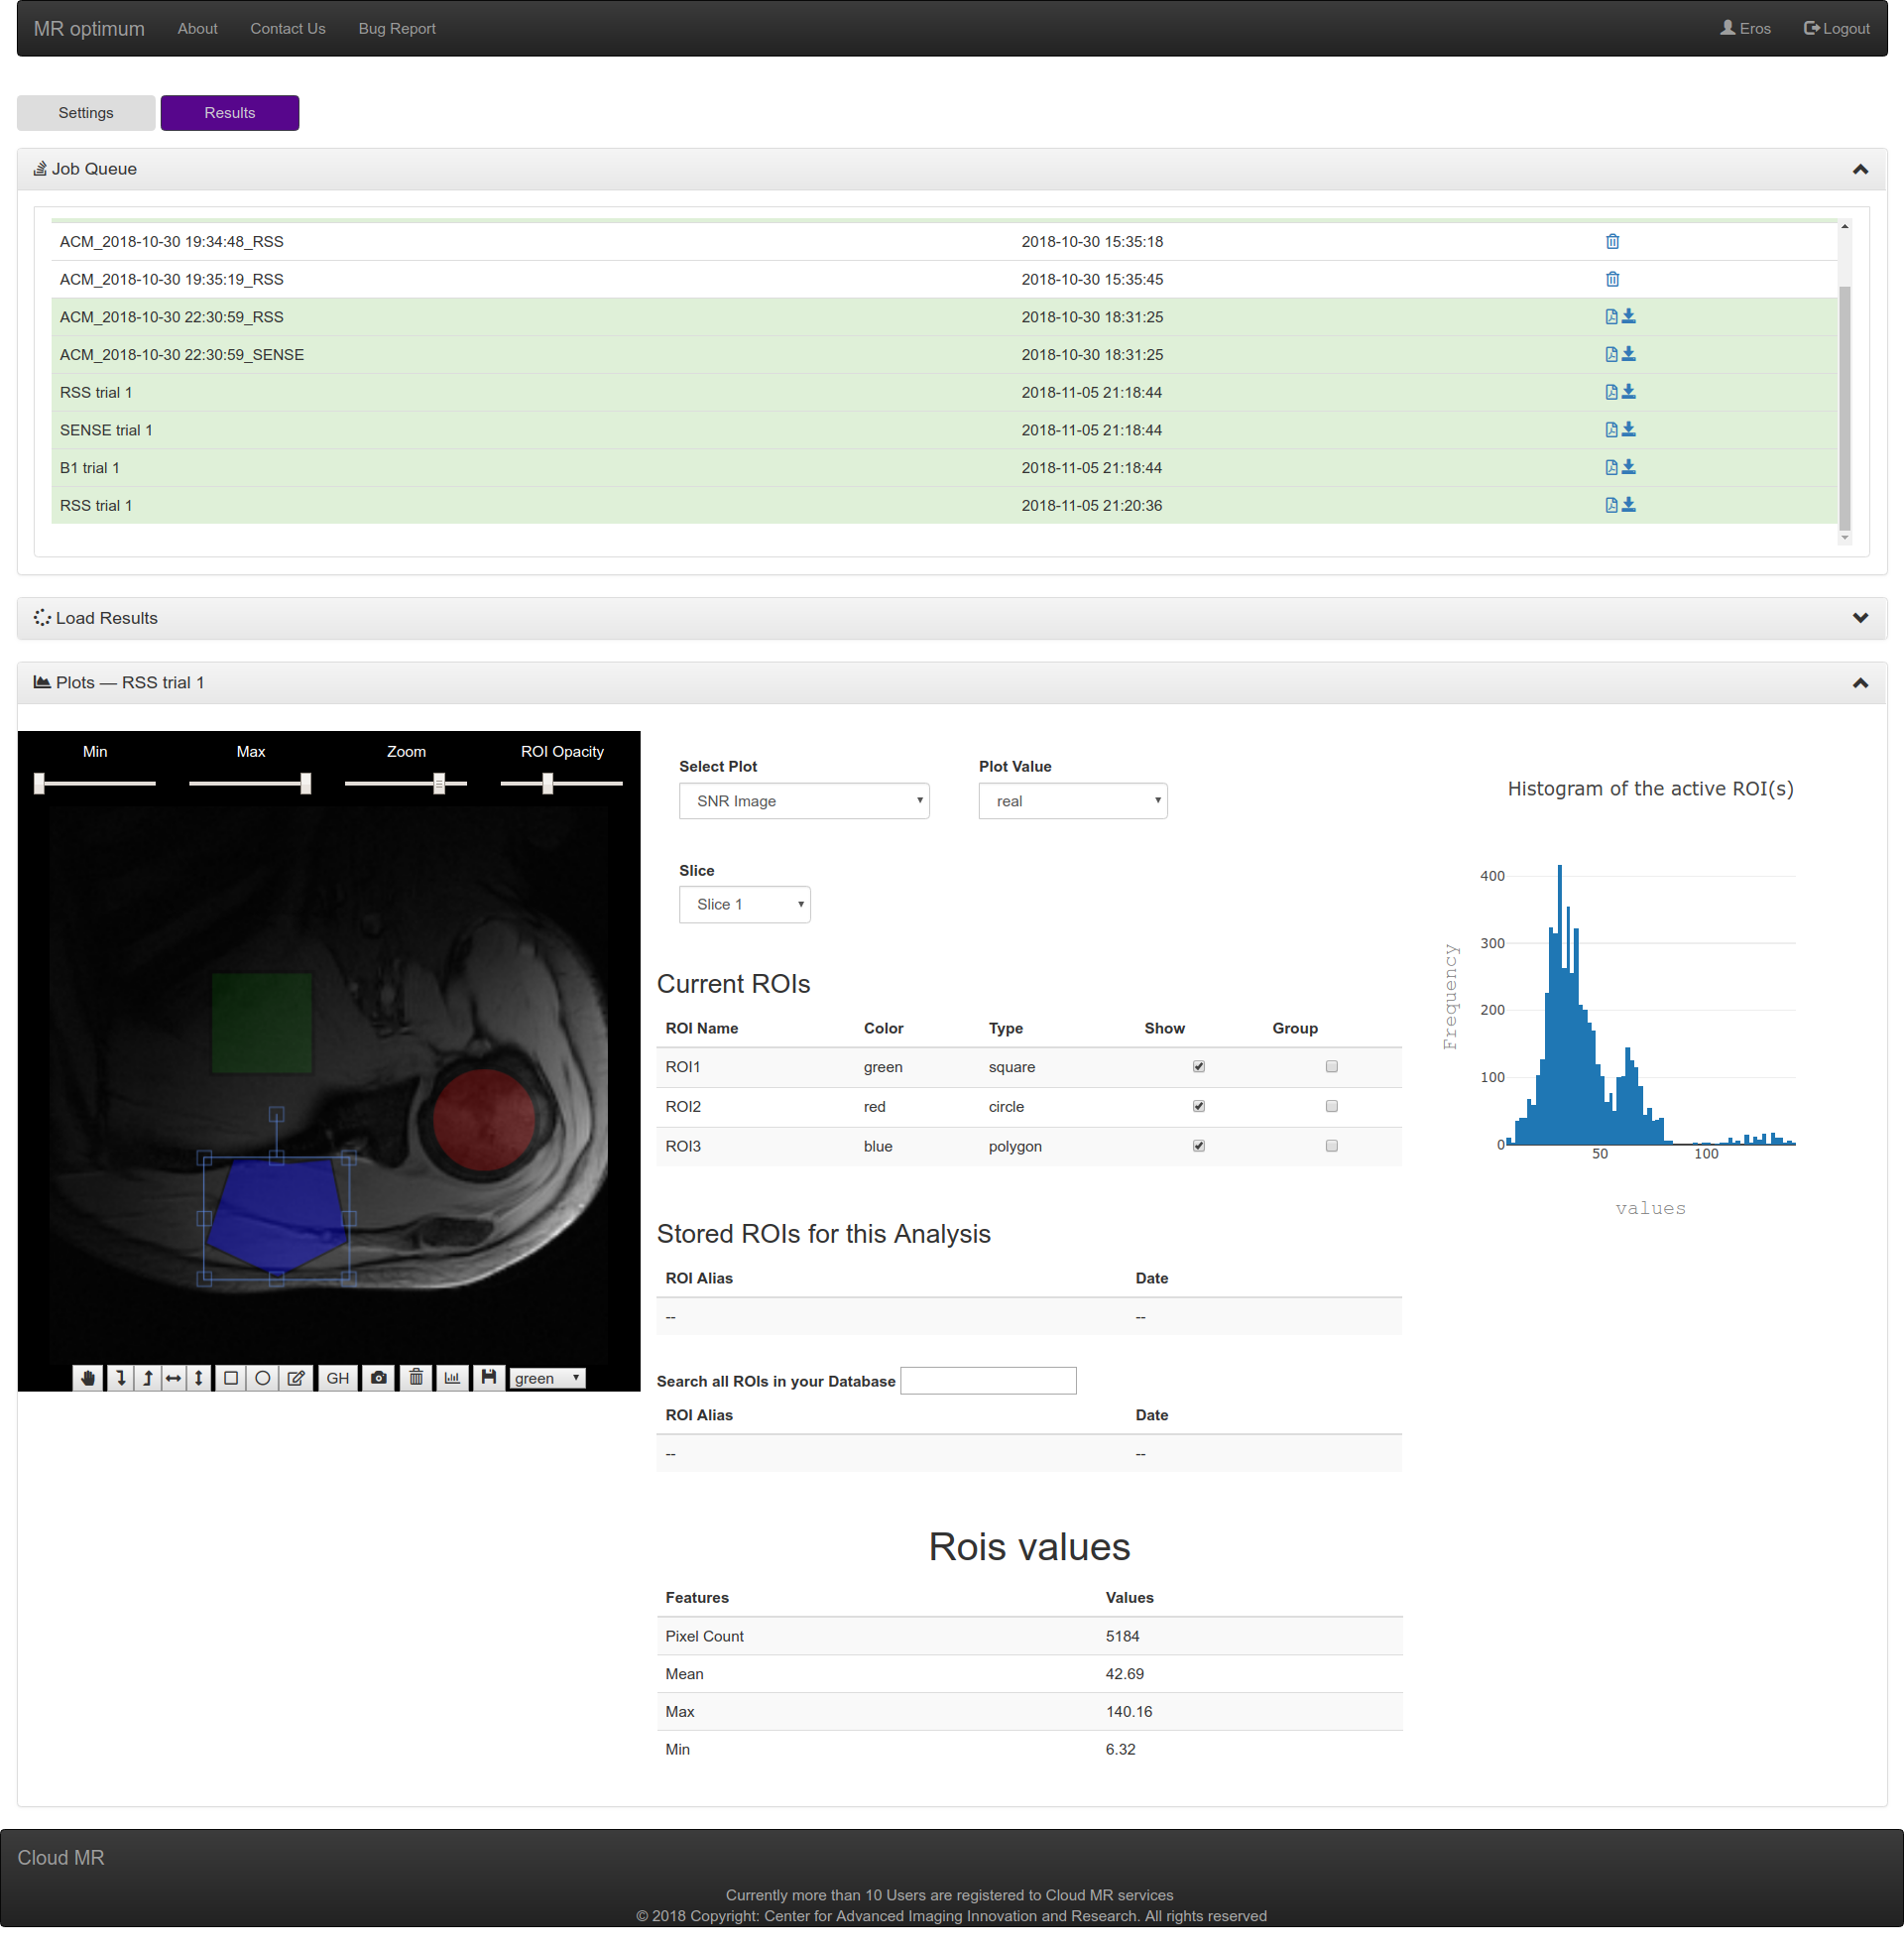
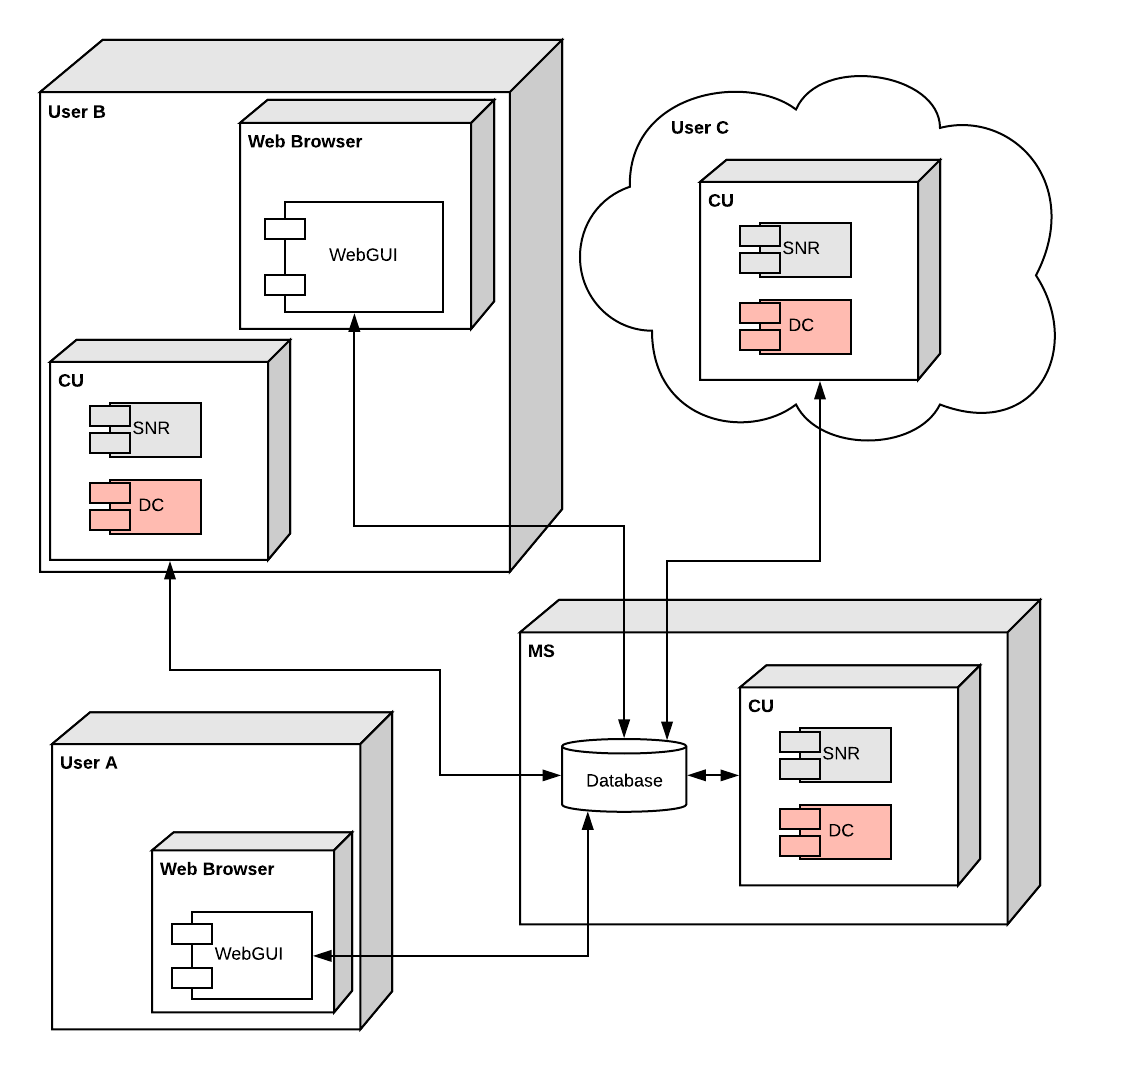
The software architecture of MR Optimum is composed of three parts (Figure 1): The Managing System (MS), the Computing Unit (CU) and the web-based graphical user interface (WebGUI). There is only one MS, which is installed on the main server, managed by the developers. The MS keeps track of the queued jobs and input/output files, by updating information entries in a local SQL database. One CU is installed on the main server, but there could be multiple copies installed on local servers or distributed over the cloud (Figure 1). Four methods for SNR calculation are currently implemented in the CU: difference image 1, array combining (AC) 2, multiple replicas 1 and pseudo multiple replicas 3. For the difference image method, the input consists of two replicas of an image. The output is an SNR value, calculated as one half the ratio between the average and standard deviation of pixel intensities within the same region of interest (ROI), defined over the sum and the difference of the two images, respectively 1. The AC method takes raw data as input and reconstructs images in SNR units for various phased arrays combining approaches, following the procedure outlined by Kellman and McVeigh 2. For the multiple replicas method, the input is a series of identical replicas of the same acquisition, whereas the output is an image in SNR units, calculated pixel-wise by dividing the average value of each pixel along the stack of replicas by the corresponding standard deviation 1. The pseudo multiple replicas approach 3 uses Monte Carlo simulations to approximate true multiple replicas data, which can only be acquired for phantoms due to scan time limitations. The final component of the CU is the data checker (DC), which ensures that the correct type of data is input into the different SNR calculation methods (Figure 2). The WebGUI is hosted on the main server, but can be accessed via any internet browser, following user log in. It is organized in two tabs – Settings and Results. In the Settings tab, expandable panels become visible and guide users through all options available for the SNR calculation methods they had selected (Figure 3). Panels open sequentially based on users’ choices and automatically collapse after the desired option values have been set. Input files can be uploaded directly while requesting a job, or selected from files previously stored by the user in the MS database. The Results tab is divided in three panels (Figure 4): one to check the status of the queued jobs, one to load previously stored results, and one to visualize results. The latter enables users to draw ROIs, extract statistics, export figures, etc.Discussion and Conclusion
MR Optimum is a novel web-based software application for the evaluation of SNR. It is readily usable from any internet browser and provides standardized access to the most common methods for SNR calculation. The current version is compatible with MR vendor raw data supported by the ISMRMRD standard 4. It relies on a modular software architecture, which enables to easily incorporate new methods, and can be connected with simulation software to predict the SNR performance of coil designs before they are built. MR Optimum is in beta testing and will be released in the following months via the website www.cloudmrhub.com, as the first application of Cloud MR, an open source platform under development that is aimed at disseminating software tools for rational design and assessment of radiofrequency coils.Acknowledgements
This work was supported in part by NIH R01 EB024536, and it was performed under the rubric of the Center for Advanced Imaging Innovation and Research(CAI2R, www.cai2r.net), a NIBIB Biomedical Technology Resource Center (NIH P41 EB017183).References
- O. Dietrich, J. G. Raya, S. B. Reeder, M. F. Reiser, and S. O. Schoenberg, “Measurement of signal-to-noise ratios in MR images: Influence of multichannel coils, parallel imaging, and reconstruction filters,” J. Magn. Reson. Imaging, vol. 26, no. 2, pp. 375–385, 2007.
- P. Kellman and E. R. McVeigh, “Image reconstruction in SNR units: A general method for SNR measurement,” vol. 54, no. 6, pp. 1439–1447, 2005.
- P. M. Robson, A. K. Grant, A. J. Madhuranthakam, R. Lattanzi, D. K. Sodickson, and C. A. McKenzie, “Comprehensive quantification of signal-to-noise ratio and g-factor for image-based and k-space-based parallel imaging reconstructions,” vol. 60, no. 4, pp. 895–907, 2008.
- Inati SJ, Naegele JD, Zwart NR, Roopchansingh V, Lizak MJ, Hansen DC, Liu CY, Atkinson D, Kellman P, Kozerke S, Xue H, Campbell-Washburn AE, Sørensen TS, Hansen MS. ISMRM Raw data format: A proposed standard for MRI raw datasets. Magn Reson Med. 2017 Jan;77(1):411-421. doi: 10.1002/mrm.26089.
Figures
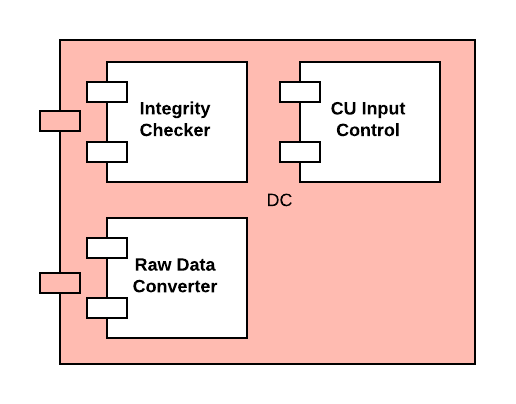
In addition to all algorithms for SNR calculation, the CU contains a data checker (DC) module, which consists of three sub-components: 1) the Integrity Checker, which assesses data consistency; 2) the CU Input Control, which ensures that the correct data type is input to each algorithm implemented in the CU; 3) the Raw Data converter, which converts raw data from MR scanners into the ISMRMRD format.
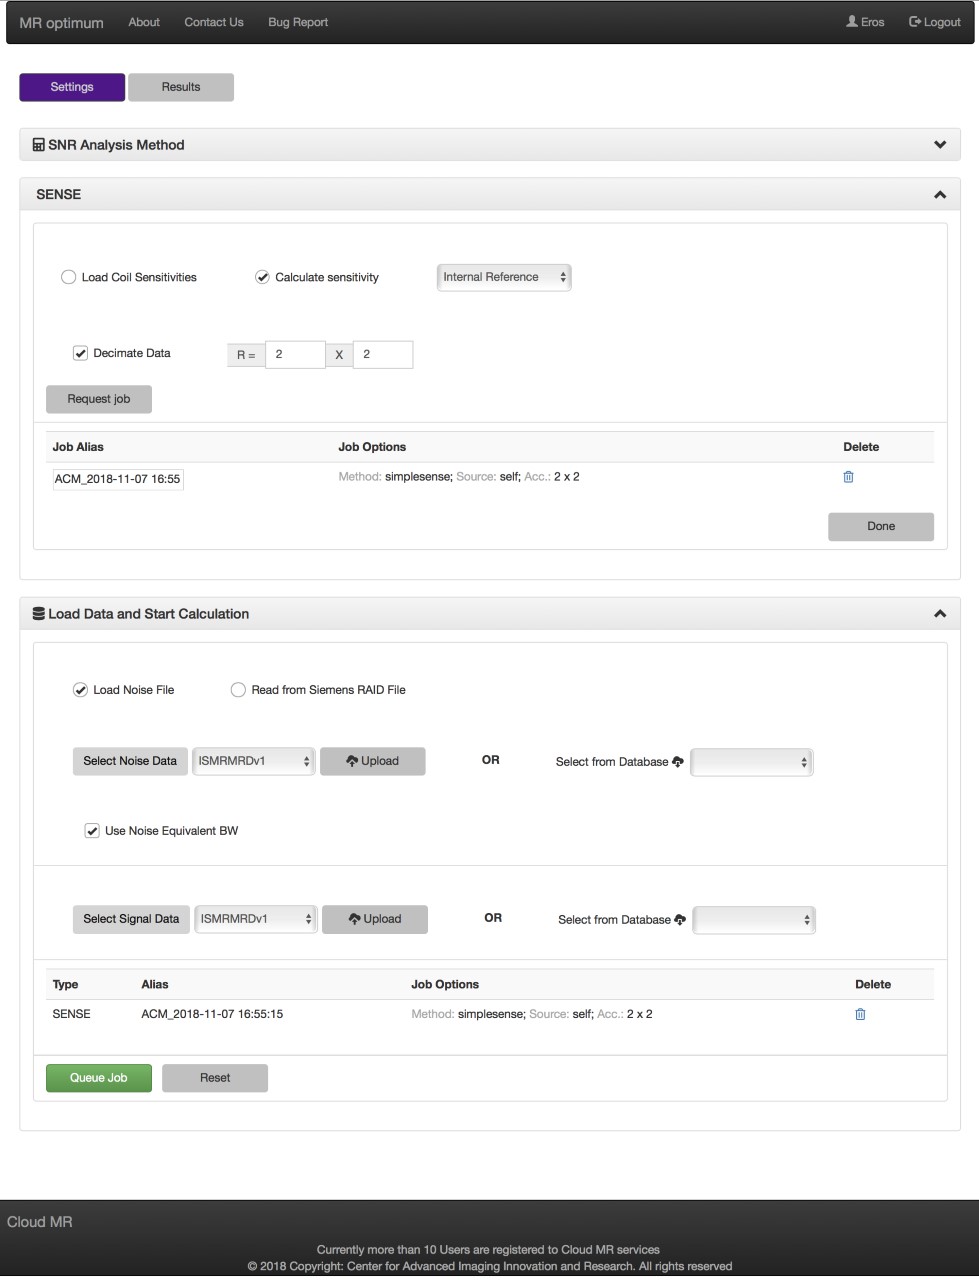
The WebGUI is implemented in html and several javascripts library ( angularjs, jquery, bootstrap, plotly.js, math.js and fabric.js). From the Settings tab, users can select one or more methods for SNR calculation, set the corresponding option values, load the data and queue jobs on the server. The WebGUI is organized in expandable panels that become visible based on the selected methods, and automatically expand or collapse to sequentially guide users through choosing all the needed options. The snapshot shows the settings for the SENSE-type array combination method.