4583
On the signal strength of Simultaneous Transmission and Reception (STAR) acquisition: EPG simulation and analysis1Biomedical Engineering, Columbia University, New York, NY, United States, 2MR Research Center, Columbia University, New York, NY, United States
Synopsis
Simultaneous Transmission And Reception (STAR) has the potential to remove the constraint of temporal separation between transmission and reception. In principle, much shorter acquisition times with significantly higher signal strength compared to pulsed sequences should be achievable. However, the signal characteristics differ from that of the conventional pulsed-RF framework. In this work, we characterize STAR characteristics with extended phase graph (EPG) simulation. We show the signal evolution from a simple STAR experiment as well as how tissue contrast could be generated in steady state.
Introduction
Simultaneous Transmission And Reception (STAR) has the potential to remove the constraint of temporal separation between transmission and reception as well as significantly reducing the power requirements. STAR in MRI was recently demonstrated using hardware that effectively isolates Tx and Rx1. In the simplest experiment, an oscillating magnetic field is continuously applied to the sample and reception can happen at all times during the experiment. Our goal is to quantify the temporal behavior of this signal in both transient and steady-state regimes with different acquisition and tissue parameters. To this end, the extended phase graph (EPG) is employed2,3 : we use a train of infinitesimally spaced hard RF pulses to approximate the continuous wave STAR experiment.Methods
EPG and STAR simulation
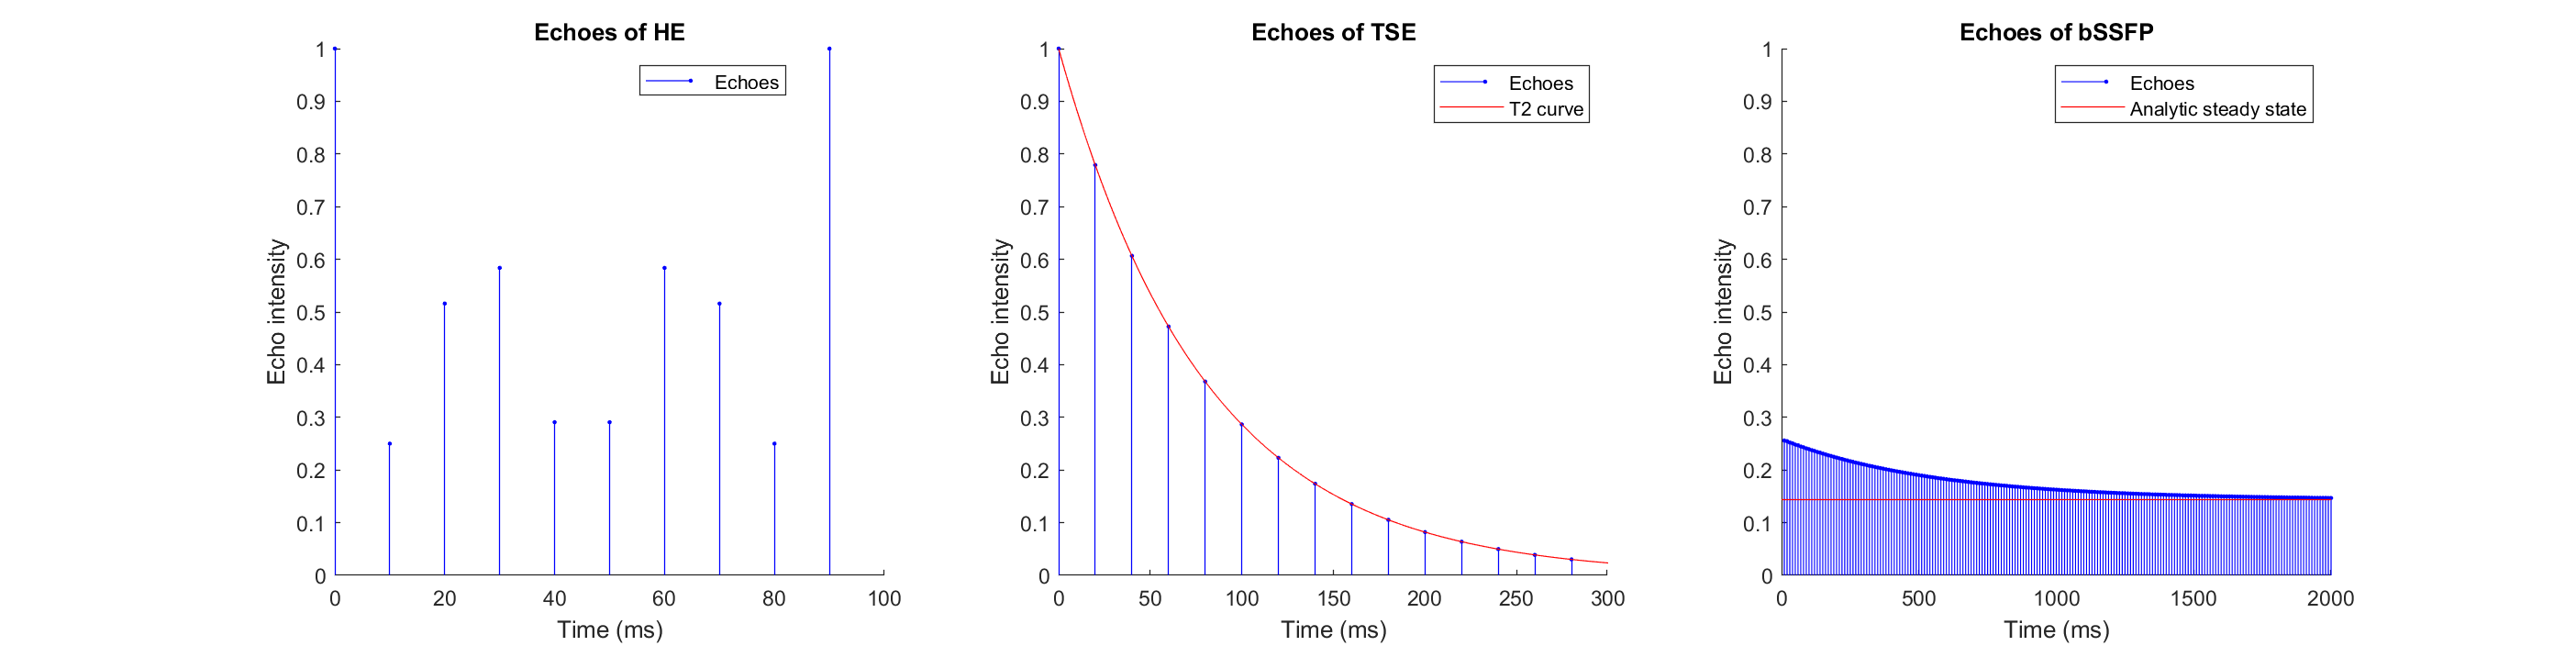
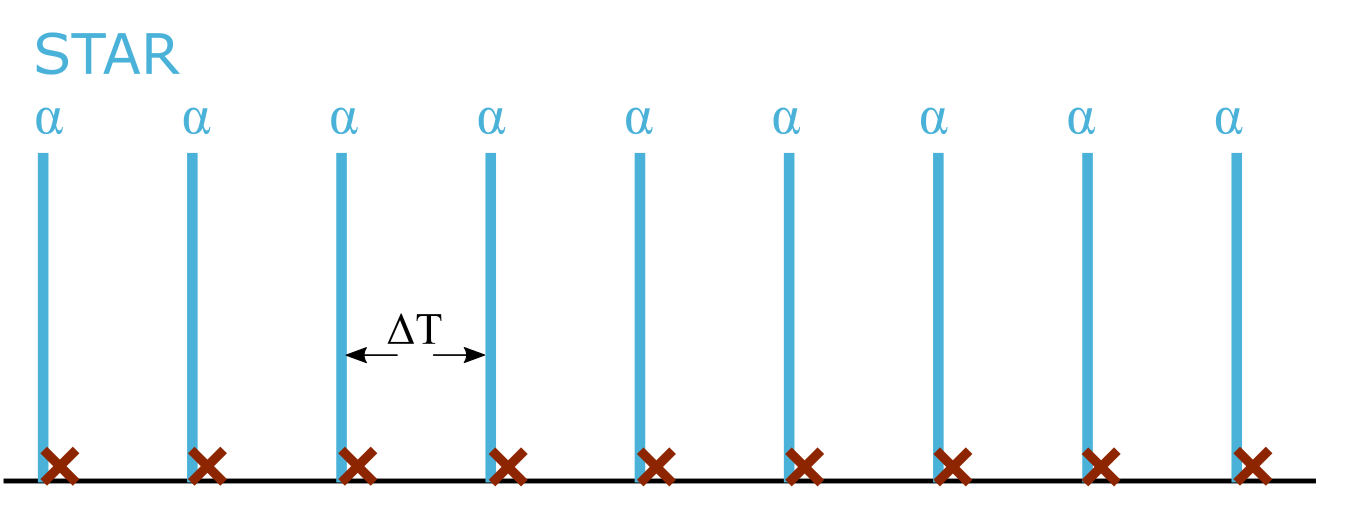
The EPG algorithm3 was implemented in MATLAB and validated with HyperEcho (HE)4, Turbo Spin Echo (TSE), and bSSFP5 sequences to ensure they exhibit the expected behavior (Figure 1). A continuous RF wave along the x axis was simulated in EPG by using an even train of hard pulses at interval ΔT (0.1ms) at a flip angle α, which produces a flip rate of A = γ*B1+=α/ΔT (Figure 2). T2’ effects were assumed negligible, and the signal was sampled after every RF pulse. We also derived an expression for the STAR steady state using the Bloch equation.
BrainWeb steady-state STAR image synthesis
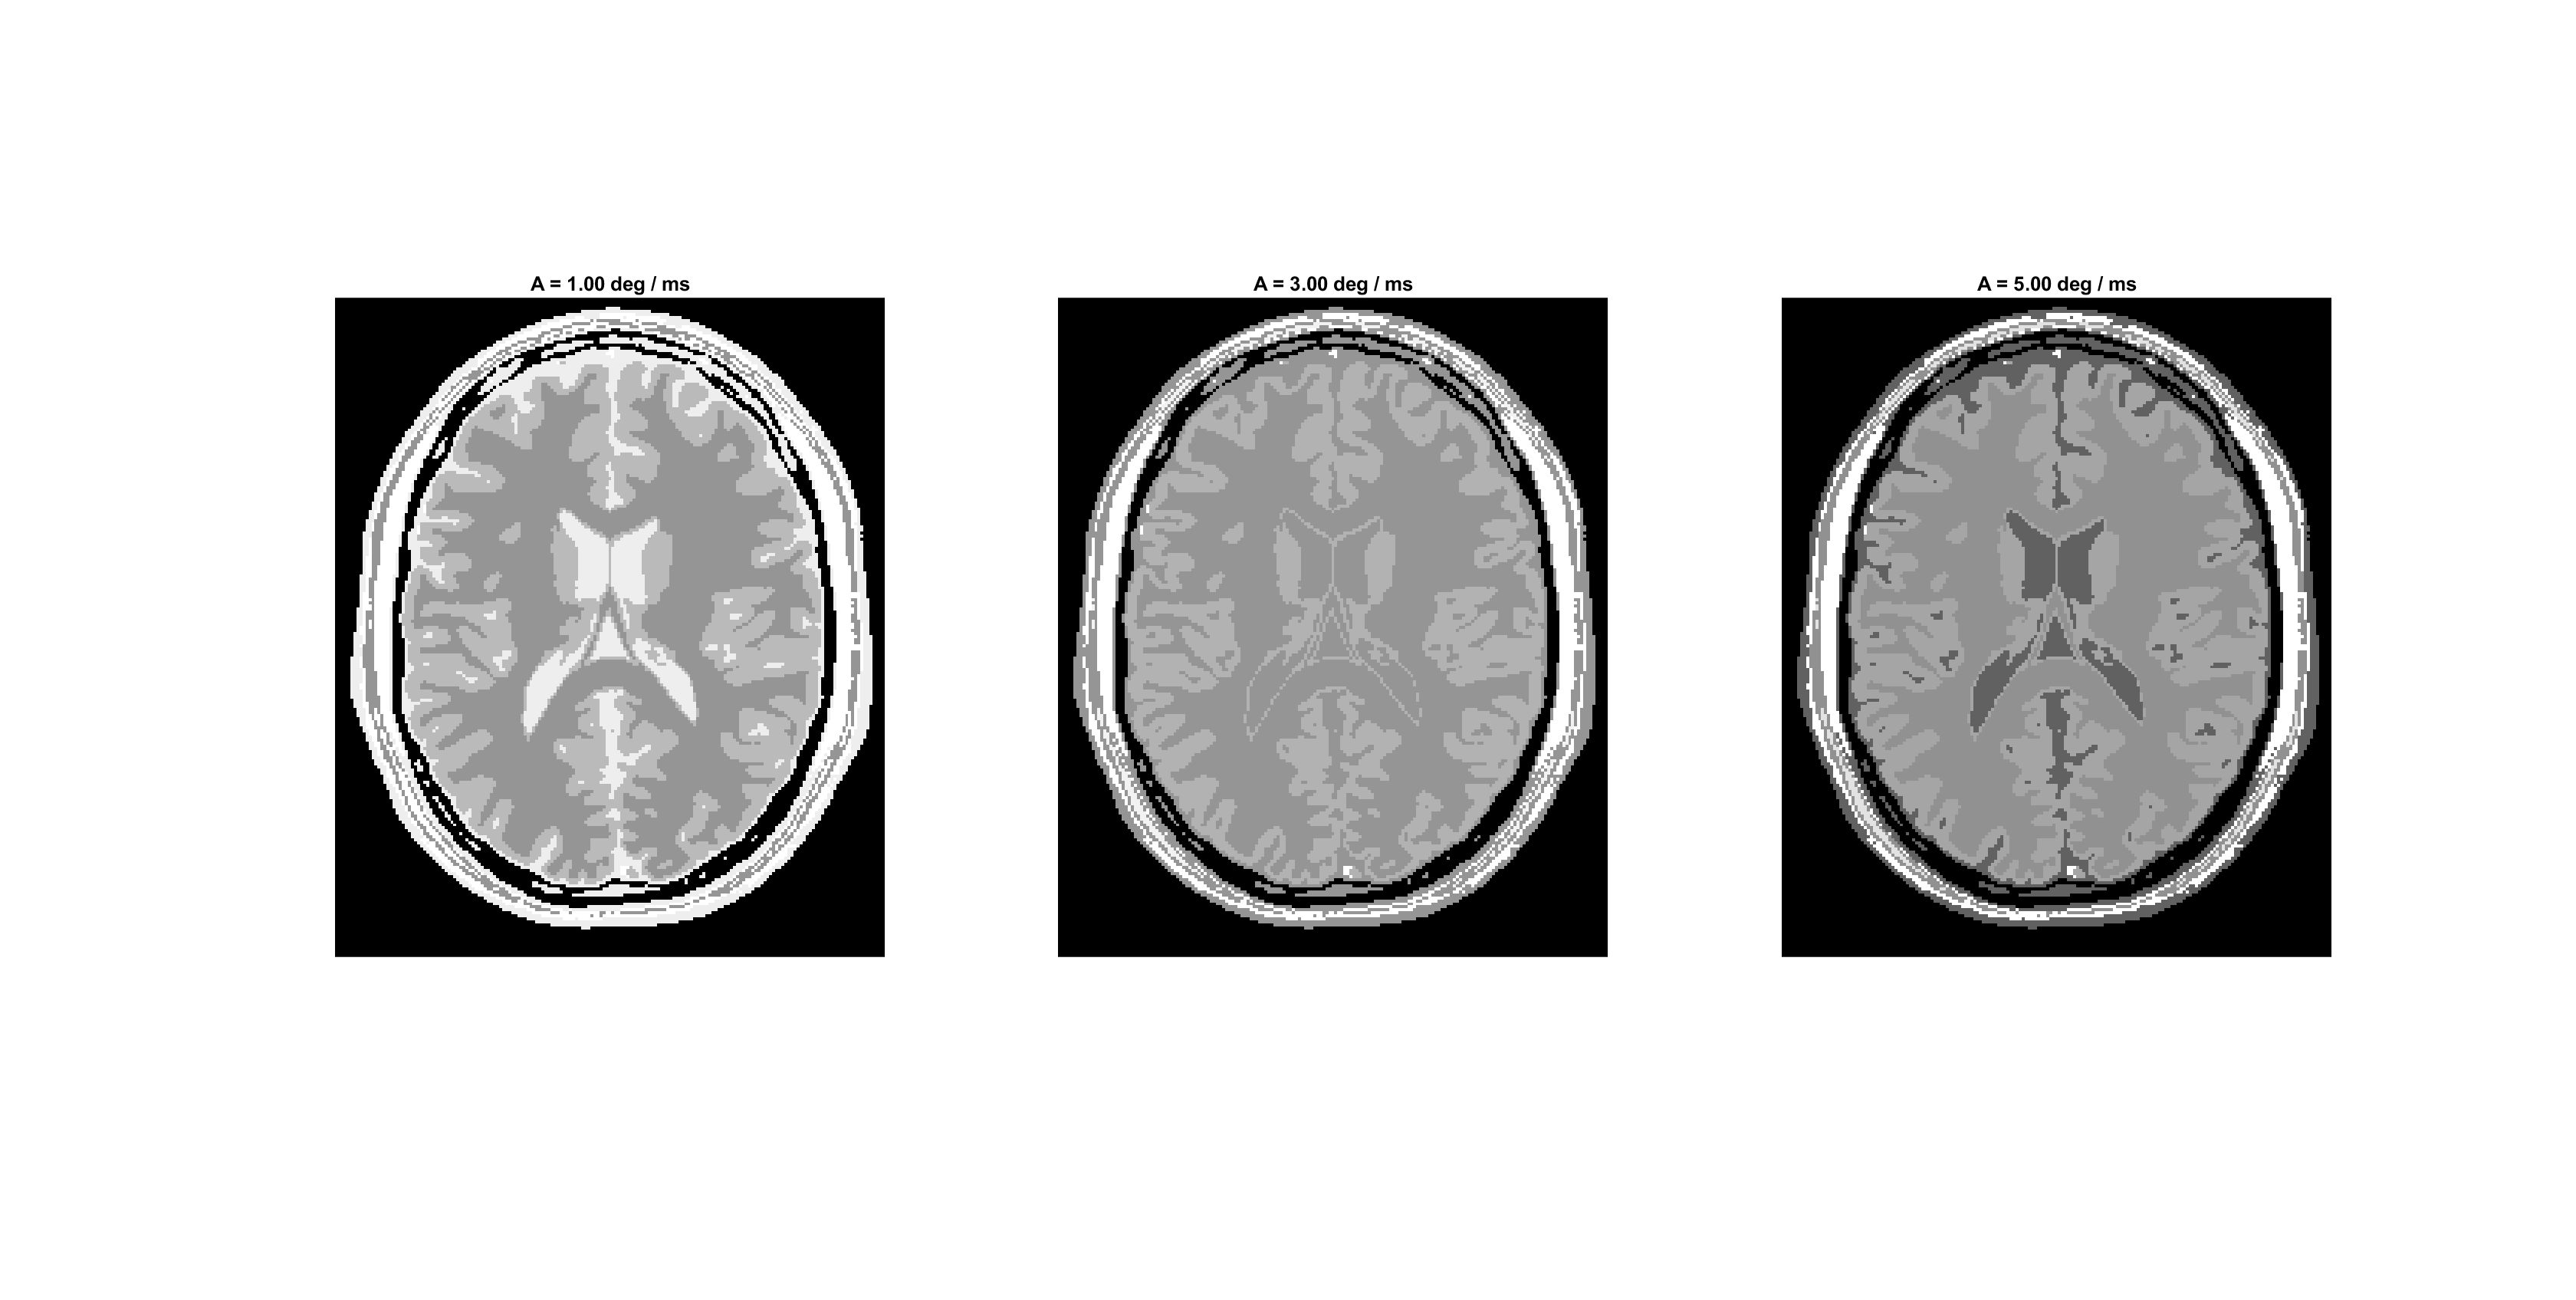
The BrainWeb7,8 anatomical model was used to synthesize an axial slice using steady-state STAR contrast at three different flip rates (1 deg/ms, 3 deg/ms, and 5 deg/ms) with a direct mapping of steady-state values to voxels labelled by tissue type. The steady-state values were obtained using BrainWeb’s standard T1 and T2 parameters.
Results
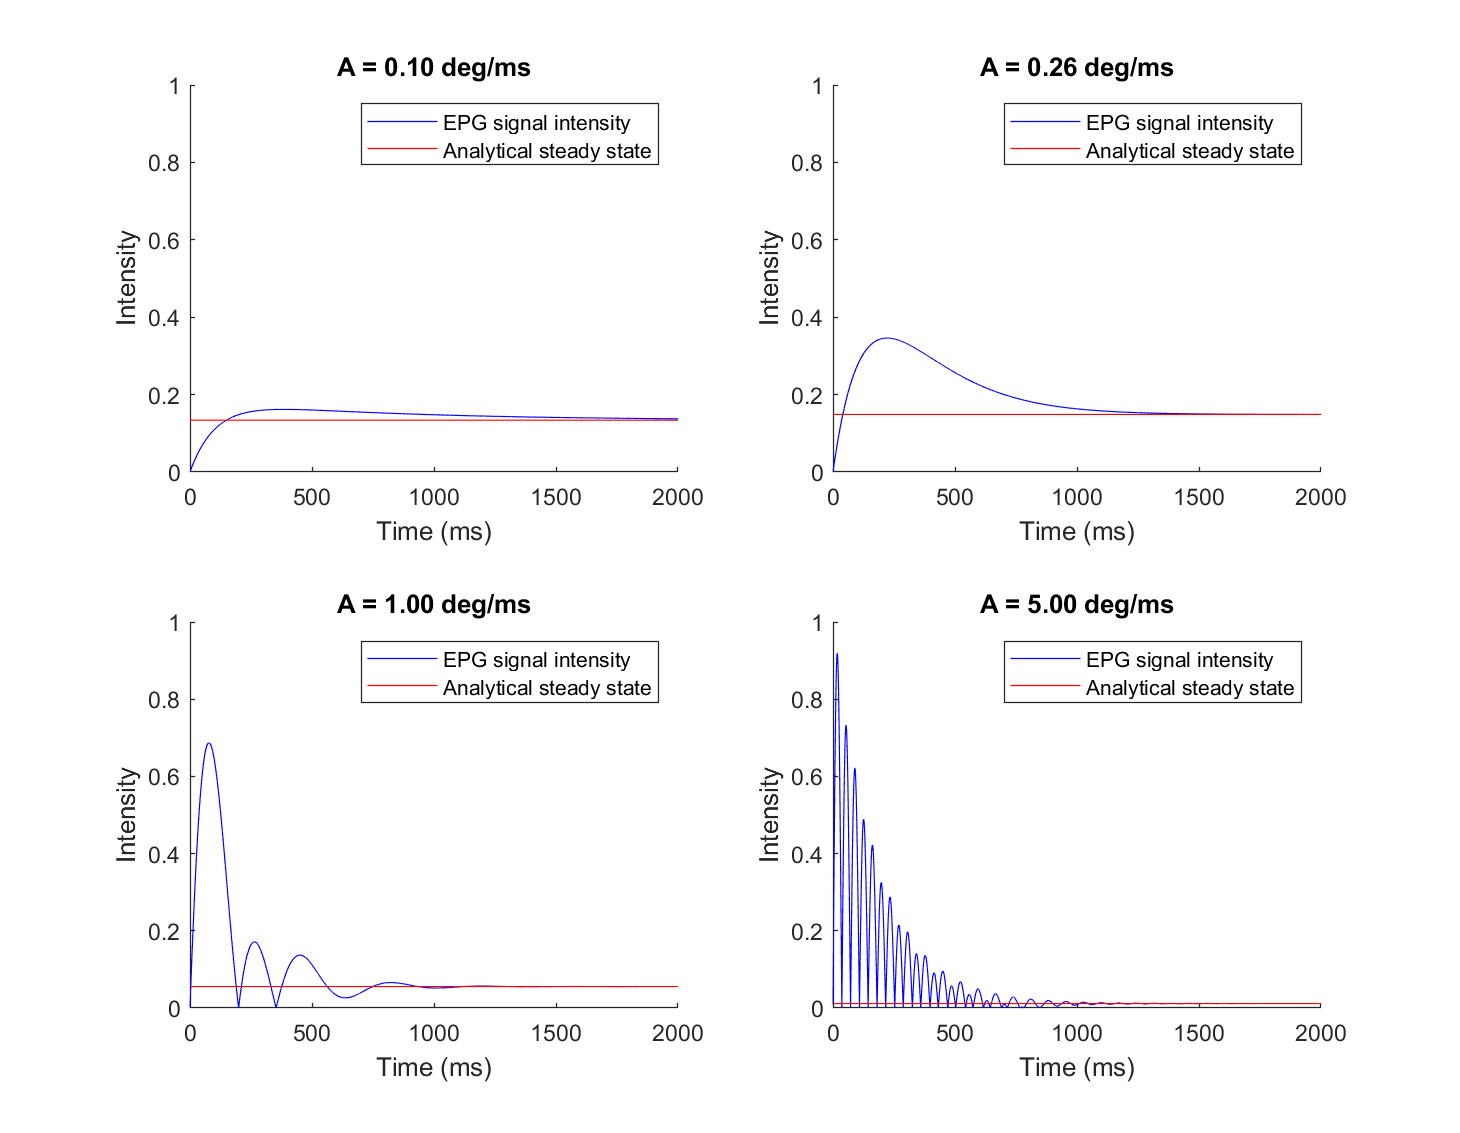
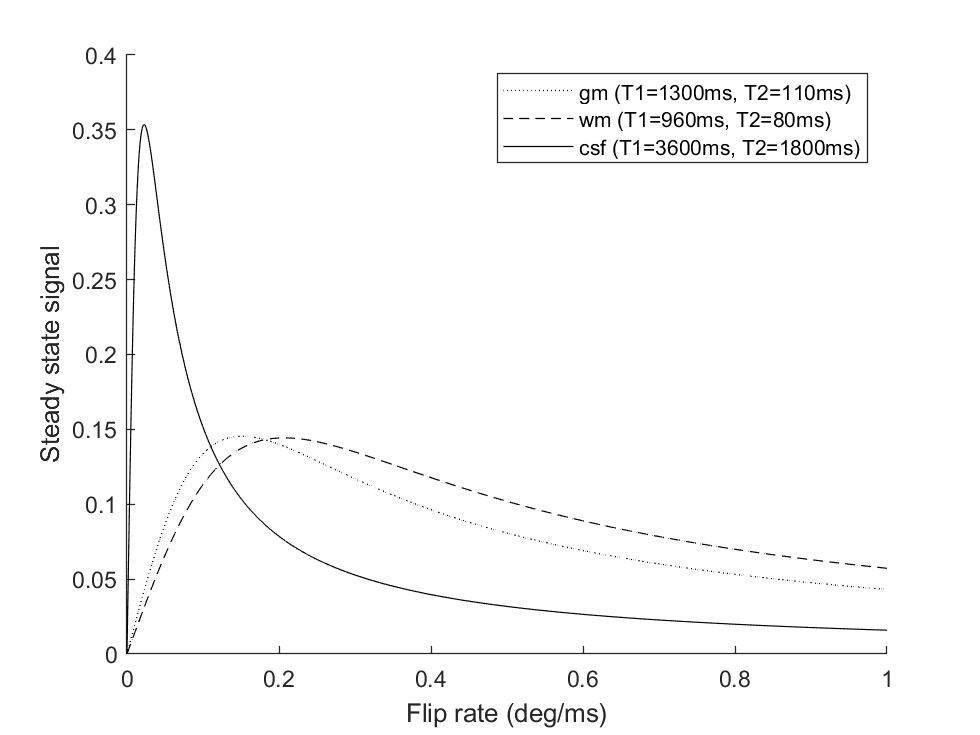
The simulated STAR sequence echo train exhibits oscillatory behavior at the flip rate γ*B1+ combined with a decay over time (Figure 3). With an early readout window and high sampling rate, the full signal strength may be observed due to negligible T1 and T2 relaxation at this time scale. The signal would appear as a sinusoid caused by nutation of M which would happen in the y-z plane if B1+ is applied along x. This transient signal eventually decays and settles on a lower steady state value dependent on T1, T2, and B1+, similar to the behavior in bSSFP. This behavior was confirmed with an analysis using Bloch equations: for a single tissue type and constant B1+ along the x axis, we have dMy/dt = γ(B1+)*(Mz)-My/T2, dMz/dt = -γ*(B1)*(My)-(Mz-M0)/T1. A stable fixed point always occurs at (u*,v*) = ((T2*A)/(1+T1*T2*A2), 1/(1+T1*T2*A2) where u = My/M0, v = Mz/M0, and A = γ*B1, and the system is critically damped when the flip rate A = 0.5*(1/T2 -1/T1). At higher flip rates, the system is strongly pushed by RF transmission and spirals down to equilibrium due to T1 and T2 damping, while at lower flip rates, T1 and T2 effects dominate and the system decays to equilibrium without oscillation (Figure 3). The equilibrium value is a function of T1, T2 and B1 and can generate a standing contrast after the sample reaches steady state. It also matches the steady state echo strength generated by EPG simulation (red lines in Figure 3) and validates the discrete approach. Therefore, we can approximate the same STAR behavior with different intervals in EPG as long as the flip rate, or angular nutation frequency (α/ΔT) is kept constant. The steady-state contrast is further explored in Figures 4 and 5, where the flip rate dependent contrast is shown and simulated on the BrainWeb model.Discussion and Conclusion
With constant B1+, an early readout provides a proton density contrast, while a T2 based contrast is seen later during steady state. For example, at γ*Β1+ = 1 degree/ms, the steady state occurs around t = 1 s. However, the main advantage of STAR is its near-zero readout delay. Thus, future work will focus on the design of a variable B1+ envelope for optimizing signal strength and/or contrast acquired in transient and steady states. Practical constraints to STAR acquisition include SAR limits and ADC bandwidth, which both restrict the maximum flip rate. Contrast also depends on a flip rate low enough to allow relaxation effects distinguish different tissues. These constraints need to be incorporated into STAR sequence design. In conclusion, we simulated and analyzed the signal behavior of a simple STAR experiment with constant-amplitude B1+ input. T1 and T2 contrast can be generated in steady state, although a variable flip rate scheme may be necessary for fast imaging with good contrast. For reproducibility of this research, we have shared the source code online9.Acknowledgements
No acknowledgement found.References
1. Sohn SM, Vaughan JT, Lagore RL, Garwood M, Idiyatullin D. In vivo MR imaging with simultaneous RF transmission and reception. Magnetic resonance in medicine. 2016 Dec;76(6):1932-1938.
2. Jaynes ET. Matrix treatment of nuclear induction. Physical Review. 1955 May 15;98(4):1099.
3. Weigel M. Extended phase graphs: dephasing, RF pulses, and echoes‐pure and simple. Journal of Magnetic Resonance Imaging. 2015 Feb;41(2):266-295.
4. Hennig J, Scheffler K. Hyperechoes. Magnetic Resonance in Medicine: An Official Journal of the International Society for Magnetic Resonance in Medicine. 2001 Jul;46(1):6-12.
5. Scheffler K, Lehnhardt S. Principles and applications of balanced SSFP techniques. European radiology. 2003 Nov 1;13(11):2409-2418.
6. Bernstein MA, King KF, Zhou XJ. Handbook of MRI pulse sequences. Elsevier; 2004 Sep 21; 592-593.
7. Cocosco CA, Kollokian V, Kwan RK, Pike GB, Evans AC. Brainweb: Online interface to a 3D MRI simulated brain database. InNeuroImage 1997.
8. Collins DL, Zijdenbos AP, Kollokian V, Sled JG, Kabani NJ, Holmes CJ, Evans AC. Design and construction of a realistic digital brain phantom. IEEE transactions on medical imaging. 1998 Jun;17(3):463-8.
9. EPG source code: https://github.com/tonggehua/EPG-simulation
Figures