4580
Highspeed Imaging of the Vocal Folds Oscillations with Image-based Motion Correction1Department of Radiology, Medical Physics, Medical Center University of Freiburg, Faculty of Medicine, University of Freiburg, Freiburg, Germany, 2German Consortium for Translational Cancer Research Freiburg Site, German Cancer Research Center (DKFZ), Heidelberg, Germany, 3Division of Phoniatrics and Pediatric Audiology, Department of Otorhinolaryngology, Head and Neck Surgery, Ludwig-Maximilians-University, Munich, Germany, 4Institute of Musicians' Medicine, Freiburg University Medical Center, Germany Faculty of Medicine, University of Freiburg, Freiburg, Germany
Synopsis
Highspeed imaging of the vocal folds oscillations is possible by applying a very short phase encoding gradient along the direction of motion. Due to repeated breathing cycles of the volunteer, motion and shifts are introduced that impair image quality. With the use of phase only cross correlation, we correct for this motion prior to the gated reconstruction by applying a linear phase to the k-space data. The proposed method is shown to improve reconstruction of anatomical features and SNR.
Introduction
Ultrafast one-dimensional (1D) oscillations of anatomical structures such as the vocal folds can be imaged with sub-TR temporal resolution. Therefore, rapid phase encoding gradients along the motion direction are applied yielding a temporal resolution well below one millisecond1. However, these measurements require an oscillatory motion that is continuous over seconds to minutes to achieve a sufficiently high SNR. These long measurement times are difficult to achieve in vocal fold studies, and multiple cycles of inhalation and subsequent phonation are needed. Patient neck motion between different phonation cycles introduces motion artifacts, which result in a reduction of image quality. Thus, in this work we evaluate image-based retrospective motion correction with phase only cross correlation (POCC)2-4 to reduce motion artefacts in sub-millisecond MRI of the vocal folds.Materials & Methods
To image the 1D-motion of the vocal folds, the phase encoding gradient of a conventional GRE sequence was applied along the motion direction of the vocal folds (L-R). Phase encoding was optimized by applying the shortest possible gradient lobe for each k-space line so that the temporal resolution increases for lines closer to k-space center (Figure 1). Measurements were performed on a clinical 3T MR system (Prisma Fit, Siemens Healthineers GmbH; Erlangen, Germany) and total acquisition time was TA=90 s, during which the volunteer performed several breathing/phonation cycles, while hearing a constant tone as a frequency reference.
MR data was acquired using a custom-built 4-channel flexible coil around the larynx (Figure 2). Full k-space data was acquired every 2.4 s (comprising 5 averages) in order to assess the current position of the neck for motion correction. The retrospective in-plane motion correction applies a POCC algorithm, which uses k-space information to detect translation between a reference and a current image of the image series (Figure 3). The shift between both images is corrected by applying a corresponding linear phase to the k-space data of the current image using the Fourier shift theorem. To reconstruct the oscillatory motion of the vocal folds, the electro-glottogram (EGG) was recorded during the MR measurement with an MR-safe EGG-unit (EGG-D400, Laryngograph Ltd., London, UK). Therefore, two EGG electrodes were placed on the neck of the volunteer at the position of the larynx. A periodic function was fit to the EGG data to extract frequency, phase and amplitude of the oscillation at each time of phase encoding. The phase was used for gating each acquired phase encoding line; frequency and amplitude were used to reject undesired data (e.g. data acquired during inhalation). An optical trigger from the MR system was used to synchronize both systems.
With FOV=70 mm and an image matrix of 80x80, partial Fourier acceleration of 7/8 was used to enable more repetitions of each k-space line during the fixed TA, as well as an asymmetric echo of 0.25/0.5 allowing for a reduced echo time (TE=2.4 ms). During the experiment, 38 images were acquired resulting in $$$n=$$$5*38*80*7/8$$$=$$$13300 individual k-space lines (TR=6.8 ms). Each accepted k-space line is sorted into one of $$$N$$$ frames, each representing one phase of the oscillatory motion. Here, data are reconstructed with $$$N=$$$10, resulting in a temporal resolution of $$$\Delta T = 1/(f*N) =$$$ 0.76 ms, where $$$f =$$$ 131 Hz is the phonation frequency. With the available gradient system capable of providing gradient amplitudes up to 80 mT/m and a slew rates up to 200 mT/m/ms, the duration of the phase encoding with the largest gradient moment was 0.56 ms.
Results
The alignment of anatomical features such as the left and right vocal folds and the anterior boundary of the glottis before and after motion correction can be seen in figure 3, as well as the image used as the reference in the POCC algorithm. The comparison of reconstructed vocal fold oscillations in figure 4 (animation) shows improvement in image quality, especially in posterior parts of the vocal folds close to the arytenoid cartilages. Also, the boundary between vocal folds and glottis is sharpened in the corrected image. SNR comparison in the left vocal fold over the course of the oscillation also shows a significant increase up to a factor of 2 with the application of motion correction.Conclusion
Highspeed imaging of the vocal folds with sub-millisecond temporal resolution was combined successfully with image-based motion correction to improve image quality and SNR, allowing for longer imaging durations and less restriction on patient positioning.Acknowledgements
No acknowledgement found.References
[1] Fischer, J., Abels, T., Özen, A. C., Echternach, M., Richter, M., Bock, M., 2018. Highspeed Imaging with Sub-millisecond Temporal Resolution of the Vocal Folds Oscillations using EGG-Gated Gradient Echo with Rapid Phase Encoding, in: Proc. Intl. Soc. Mag. Reson. Med. 26. Presented at the ISMRM 26th annual Meeting & Exhibition, Paris.
[2] Krafft, A.J., Zamecnik, P., Maier, F., de Oliveira, A., Hallscheidt, P., Schlemmer, H.-P., Bock, M., 2013. Passive marker tracking via phase-only cross correlation (POCC) for MR-guided needle interventions: Initial in vivo experience. Phys. Med. 29, 607–614.
[3] Oliveira, A. de, Rauschenberg, J., Beyersdorff, D., Semmler, W., Bock, M., 2008. Automatic passive tracking of an endorectal prostate biopsy device using phase-only cross-correlation. Magn. Reson. Med. 59, 1043–1050.
[4] Zamecnik, P., Schouten, M.G., Krafft, A.J., Maier, F., Schlemmer, H.-P., Barentsz, J.O., Bock, M., Fütterer, J.J., 2014. Automated Real-time Needle-Guide Tracking for Fast 3-T MR-guided Transrectal Prostate Biopsy: A Feasibility Study. Radiology 273, 879–886
Figures
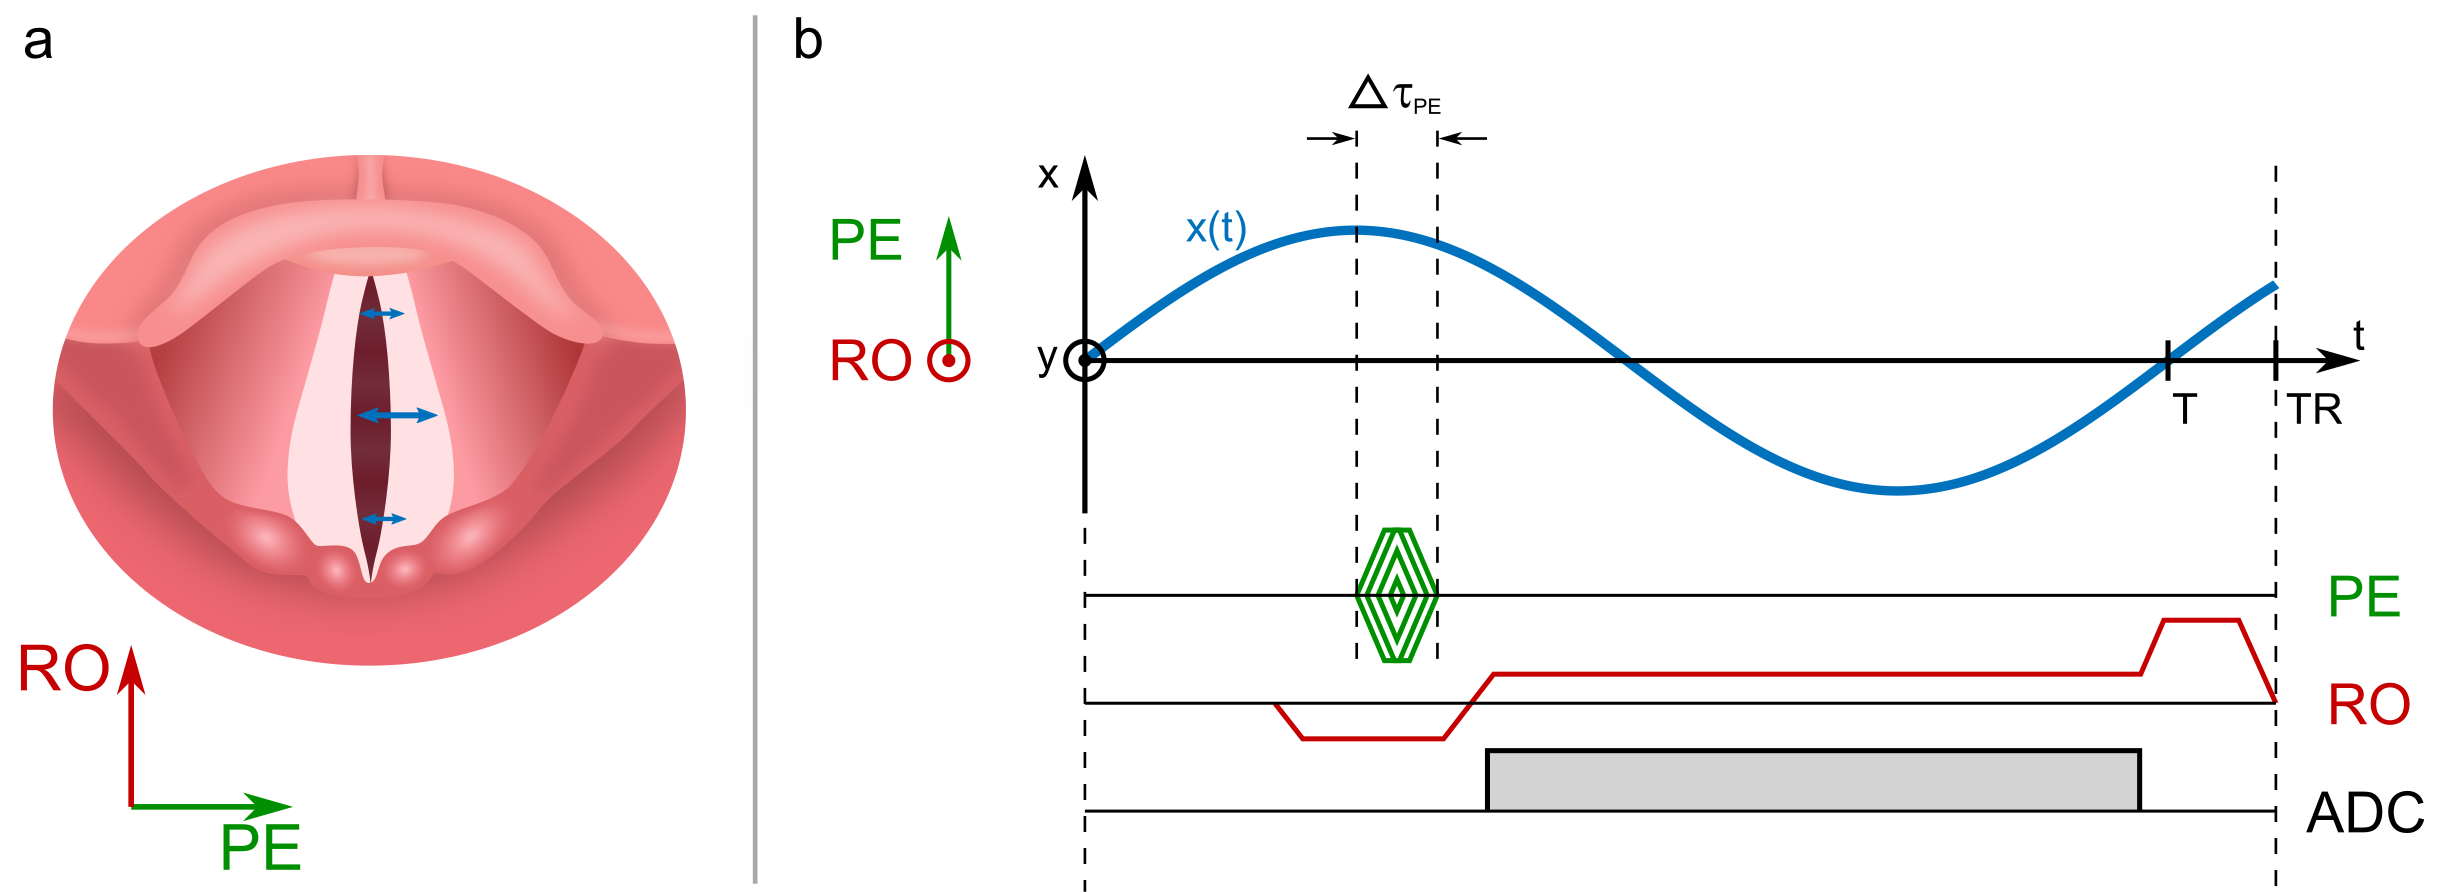
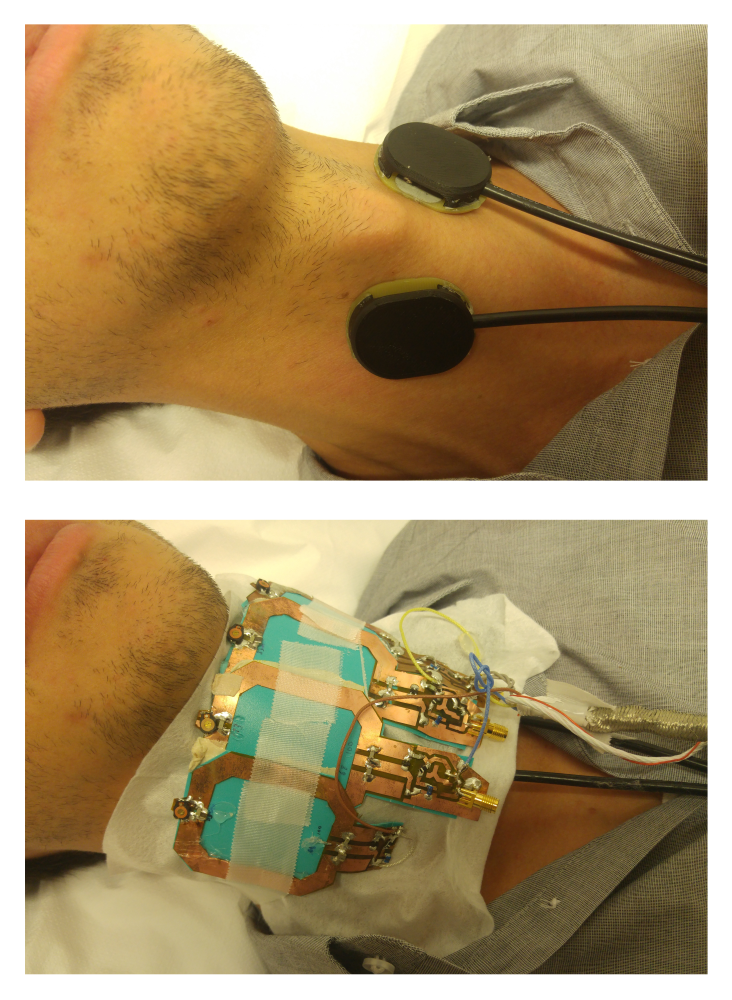
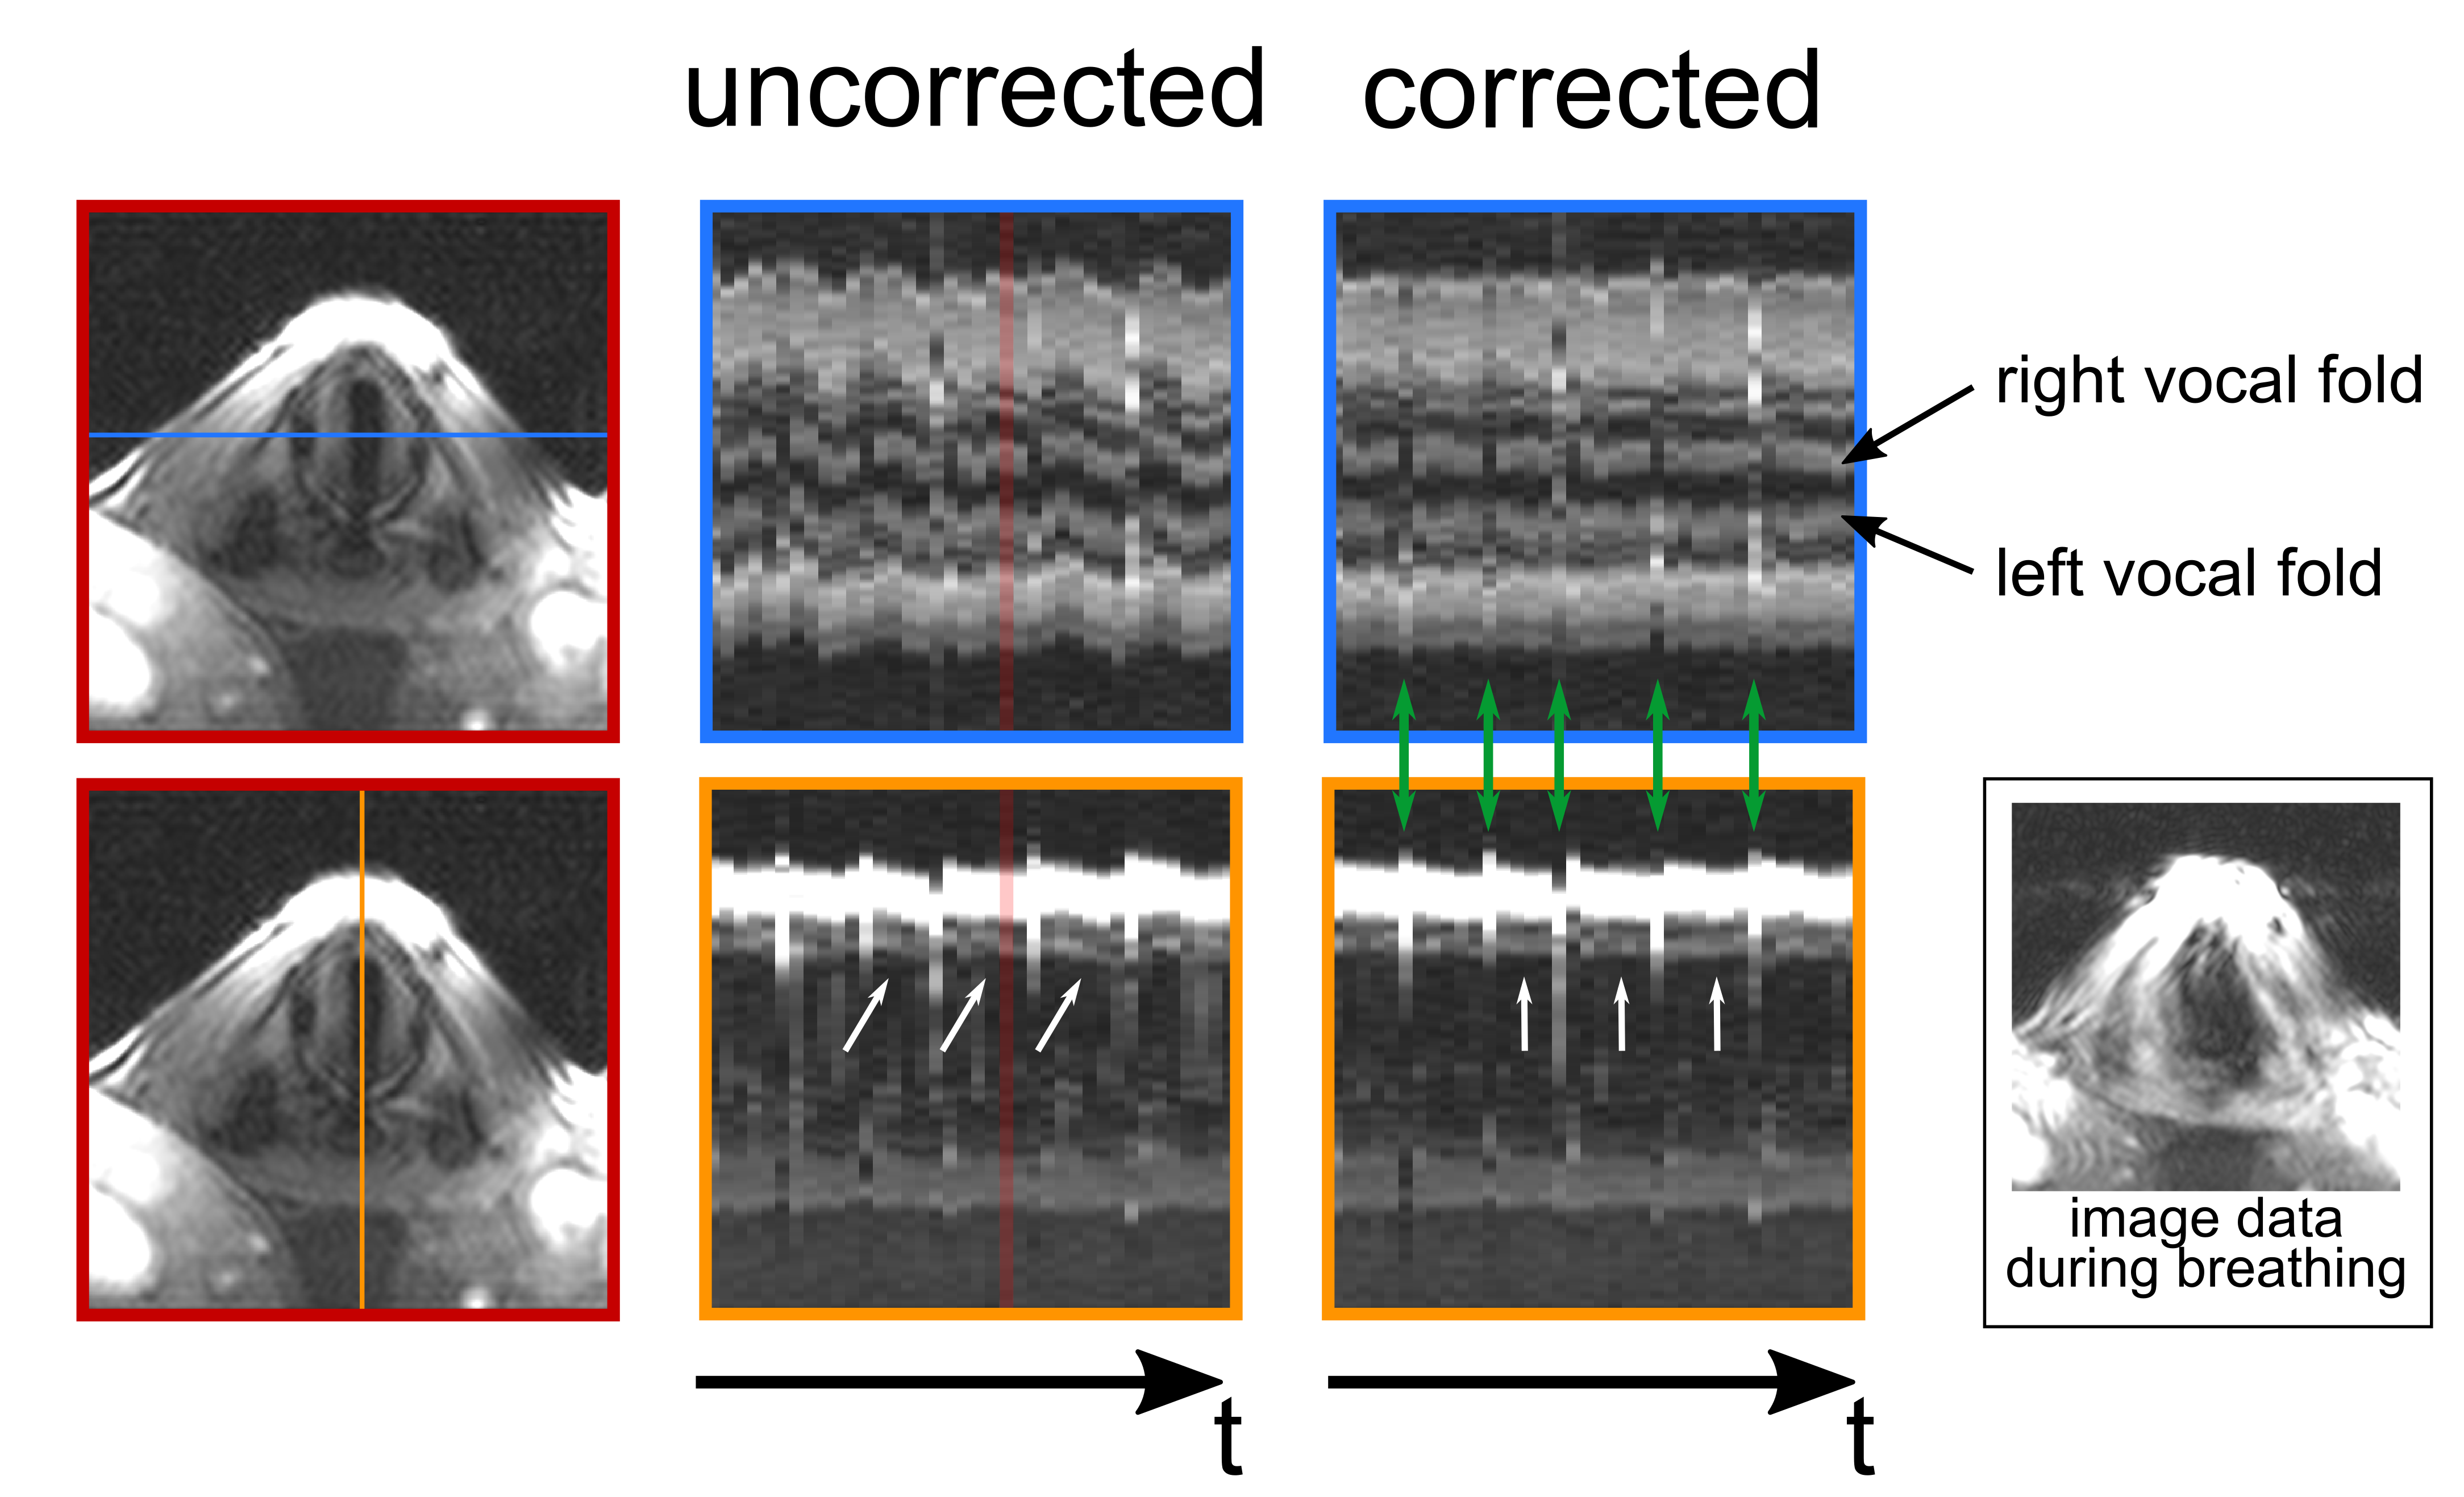
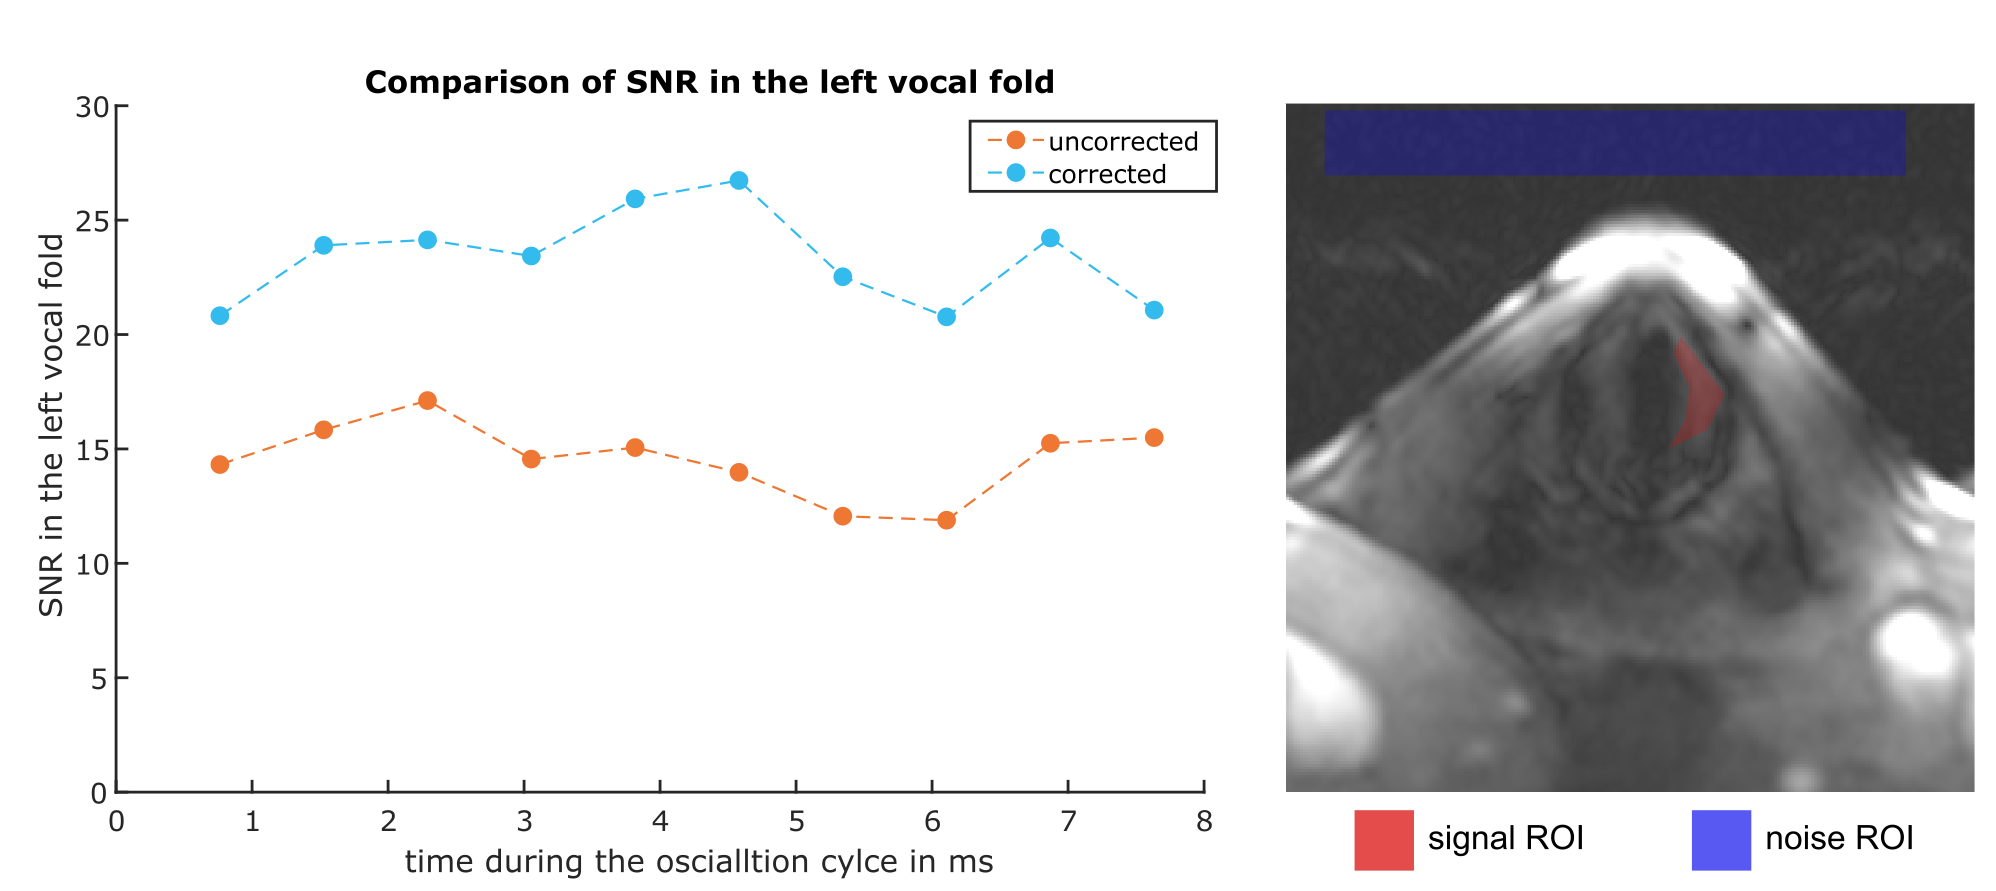
Figure 5: Left: SNR comparison in the left vocal fold over the reconstructed oscillation cycle using uncorrected and corrected k-space data. Right: Location of the signal and noise ROI in the image data.