4571
Rapid, multi-TE, T2-prepared RUFIS for Silent T2-weighted imaging1Neuroimaging, King's College London, London, United Kingdom, 2General Electric Healthcare, London, United Kingdom, 3ASL West, General Electric Healthcare, Menlo Park, CA, United States, 4Medicine, University of British Columbia, Vancouver, BC, Canada, 5ASL Europe, General Electric Healthcare, Munich, Germany
Synopsis
Zero echo time (ZTE) imaging using the RUFIS sequence allows for silent imaging with high efficiency. Without modifications, RUFIS produces proton density and/or T1-weighted images similar to a spoiled gradient echo sequence. In this work we present a novel T2-prepared RUFIS sequence with multiple echo times acquired in each shot, for efficient T2-weighted imaging. We present in vivo results acquired in 11 min with 1.5mm3 resolution, with effective echo times from 0 to 248ms.
Introduction
The Radial Ultra-Fast Imaging Sequence (RUFIS)1 allows for silent acquisition with zero echo time (ZTE). The RUFIS acquisition produces image contrast similar to a spoiled gradient echo sequence2. Previous studies have shown T2-weighted imaging with variable TE using the modified BIR-43 for T2-prepration together with gradient echo4 and spiral readouts5. In this work we combine a RUFIS readout with mBIR-4 T2-preparation for rapid, silent, T2-weighted imaging.
To obtain high quality T2-weighted images, a delay time must be included after the readout module (to allow T1-recovery), which results in long acquisition times if only a single readout is performed in each shot. Hence, to accelerate the sequence, we propose using multiple mBIR-4 pulses and RUFIS readouts within each shot to allow rapid acquisition of multiple echo times.
Methods
The Pulse Sequence Design
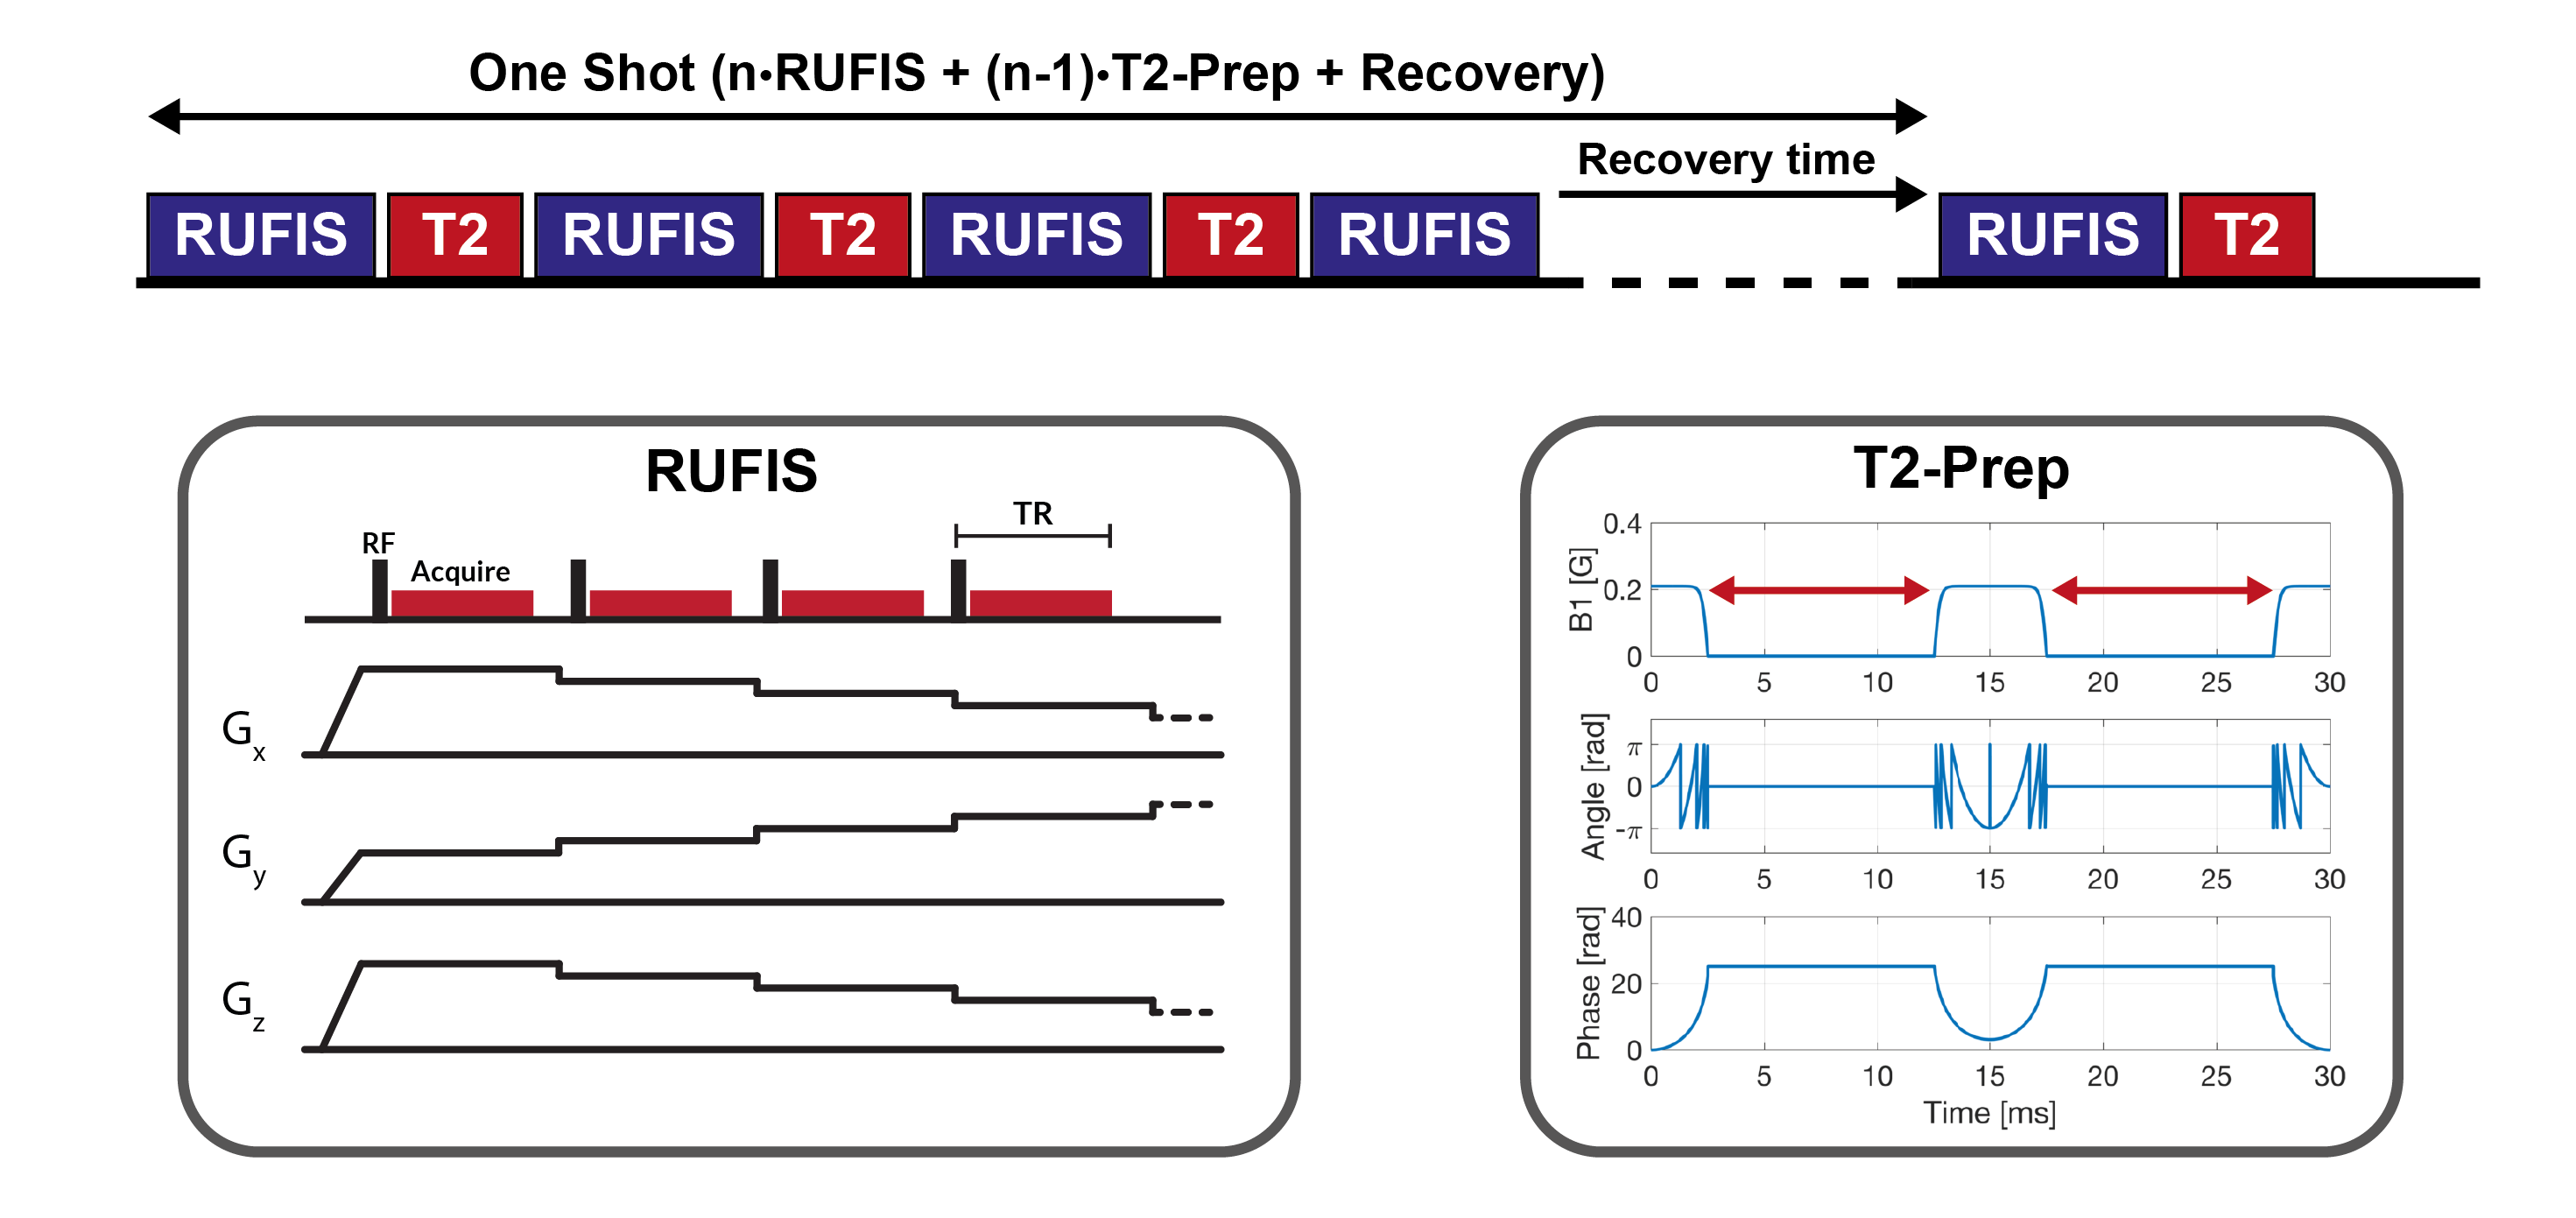
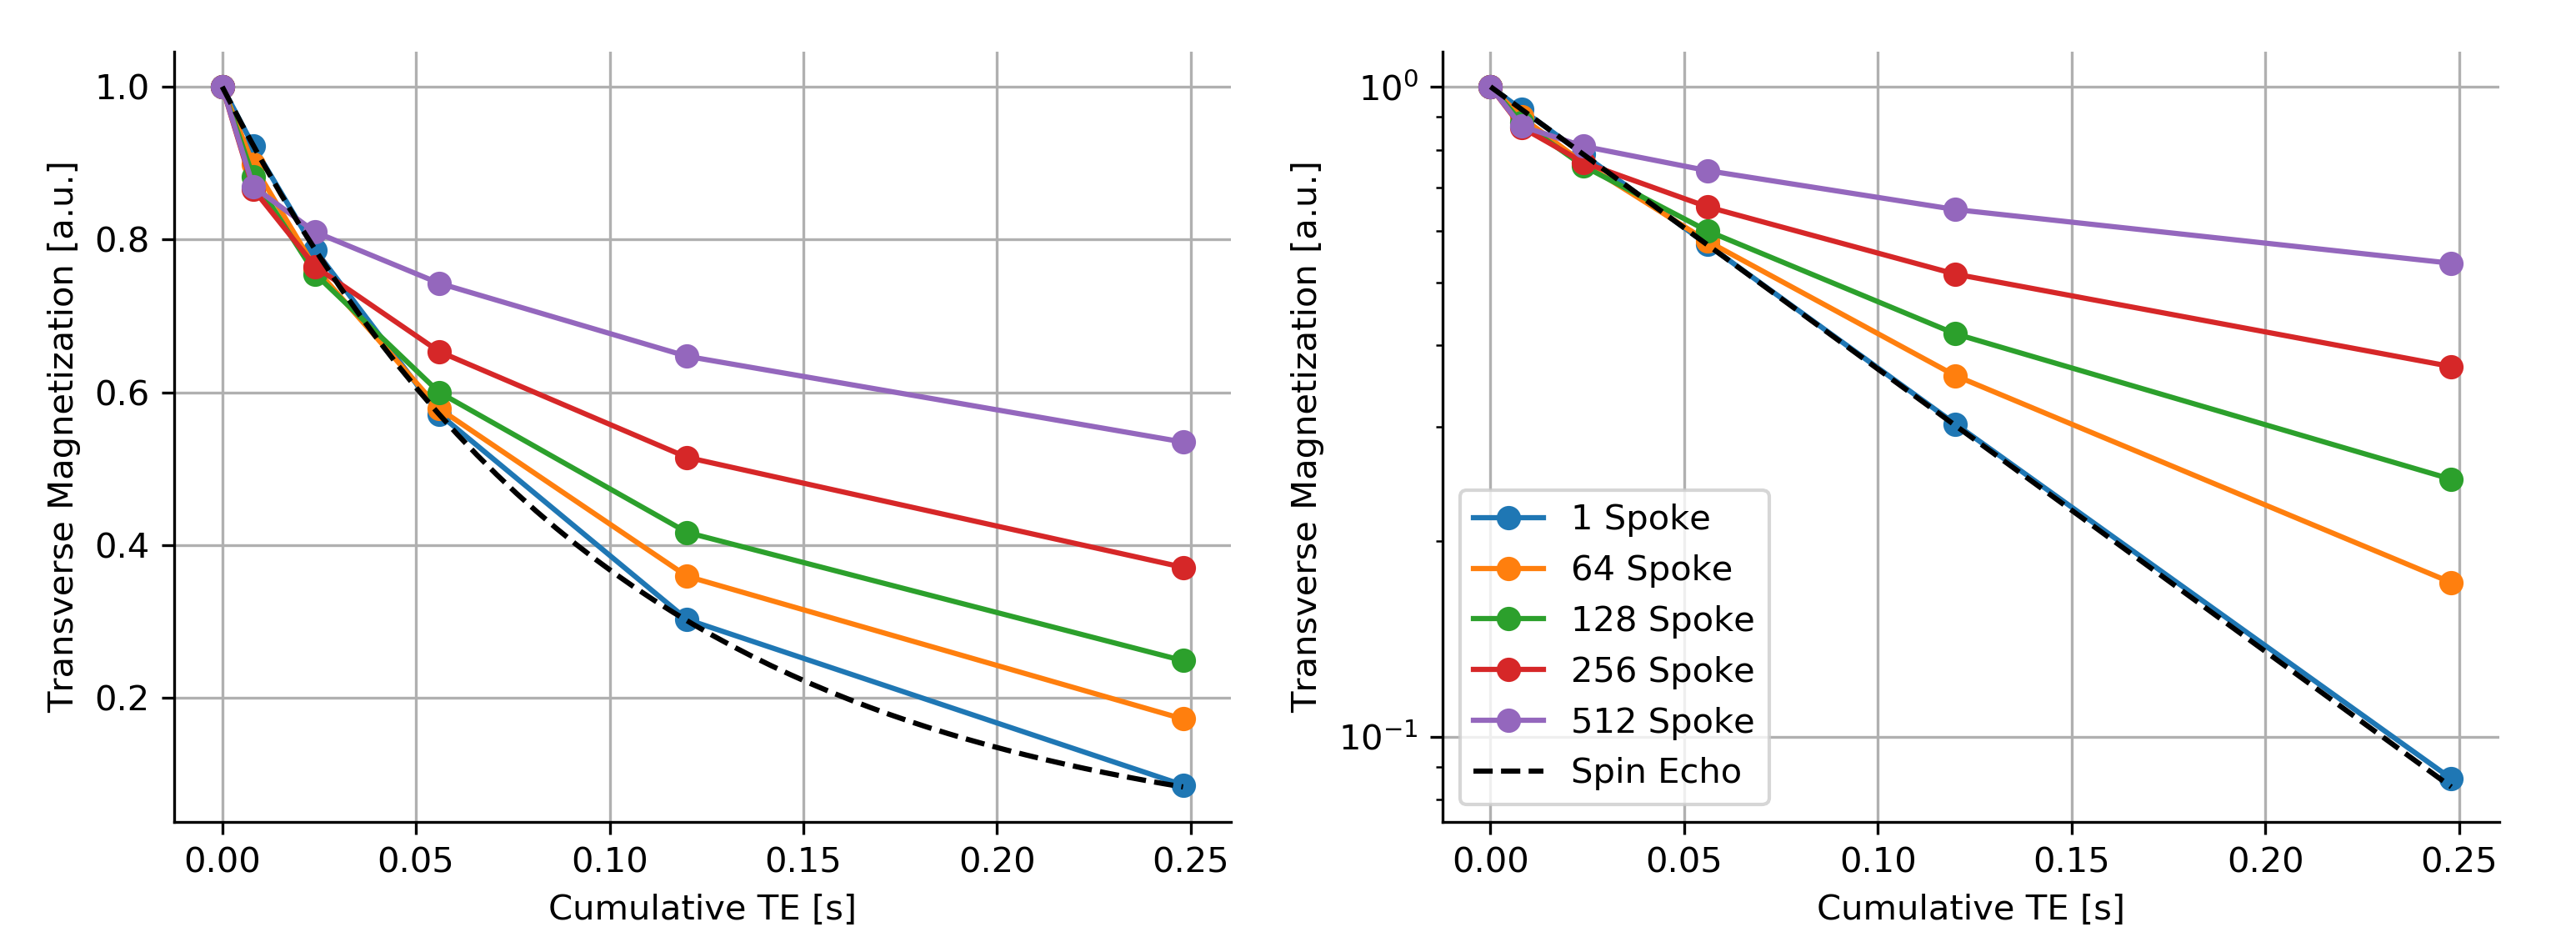
The T2-prepared RUFIS pulse sequence is shown in figure 1. The first RUFIS segment acquires an image with TE=0. The following segments acquire images with effective TEs equal to the cumulative TE of the preceding T2-preparation modules. Since each RUFIS readout contributes to T1-saturation, the TE for the T2-preparation modules were set to increase quadratically in order to obtain both short and long echo times with only a small number of readouts. For the last segment, a delay is added in for T1-recovery, as noted above. To study the influence of the number of spokes on T1-saturation in the acquisition, simulations were performed using a framework similar to the extended phase graph6.
In vivo Experiments
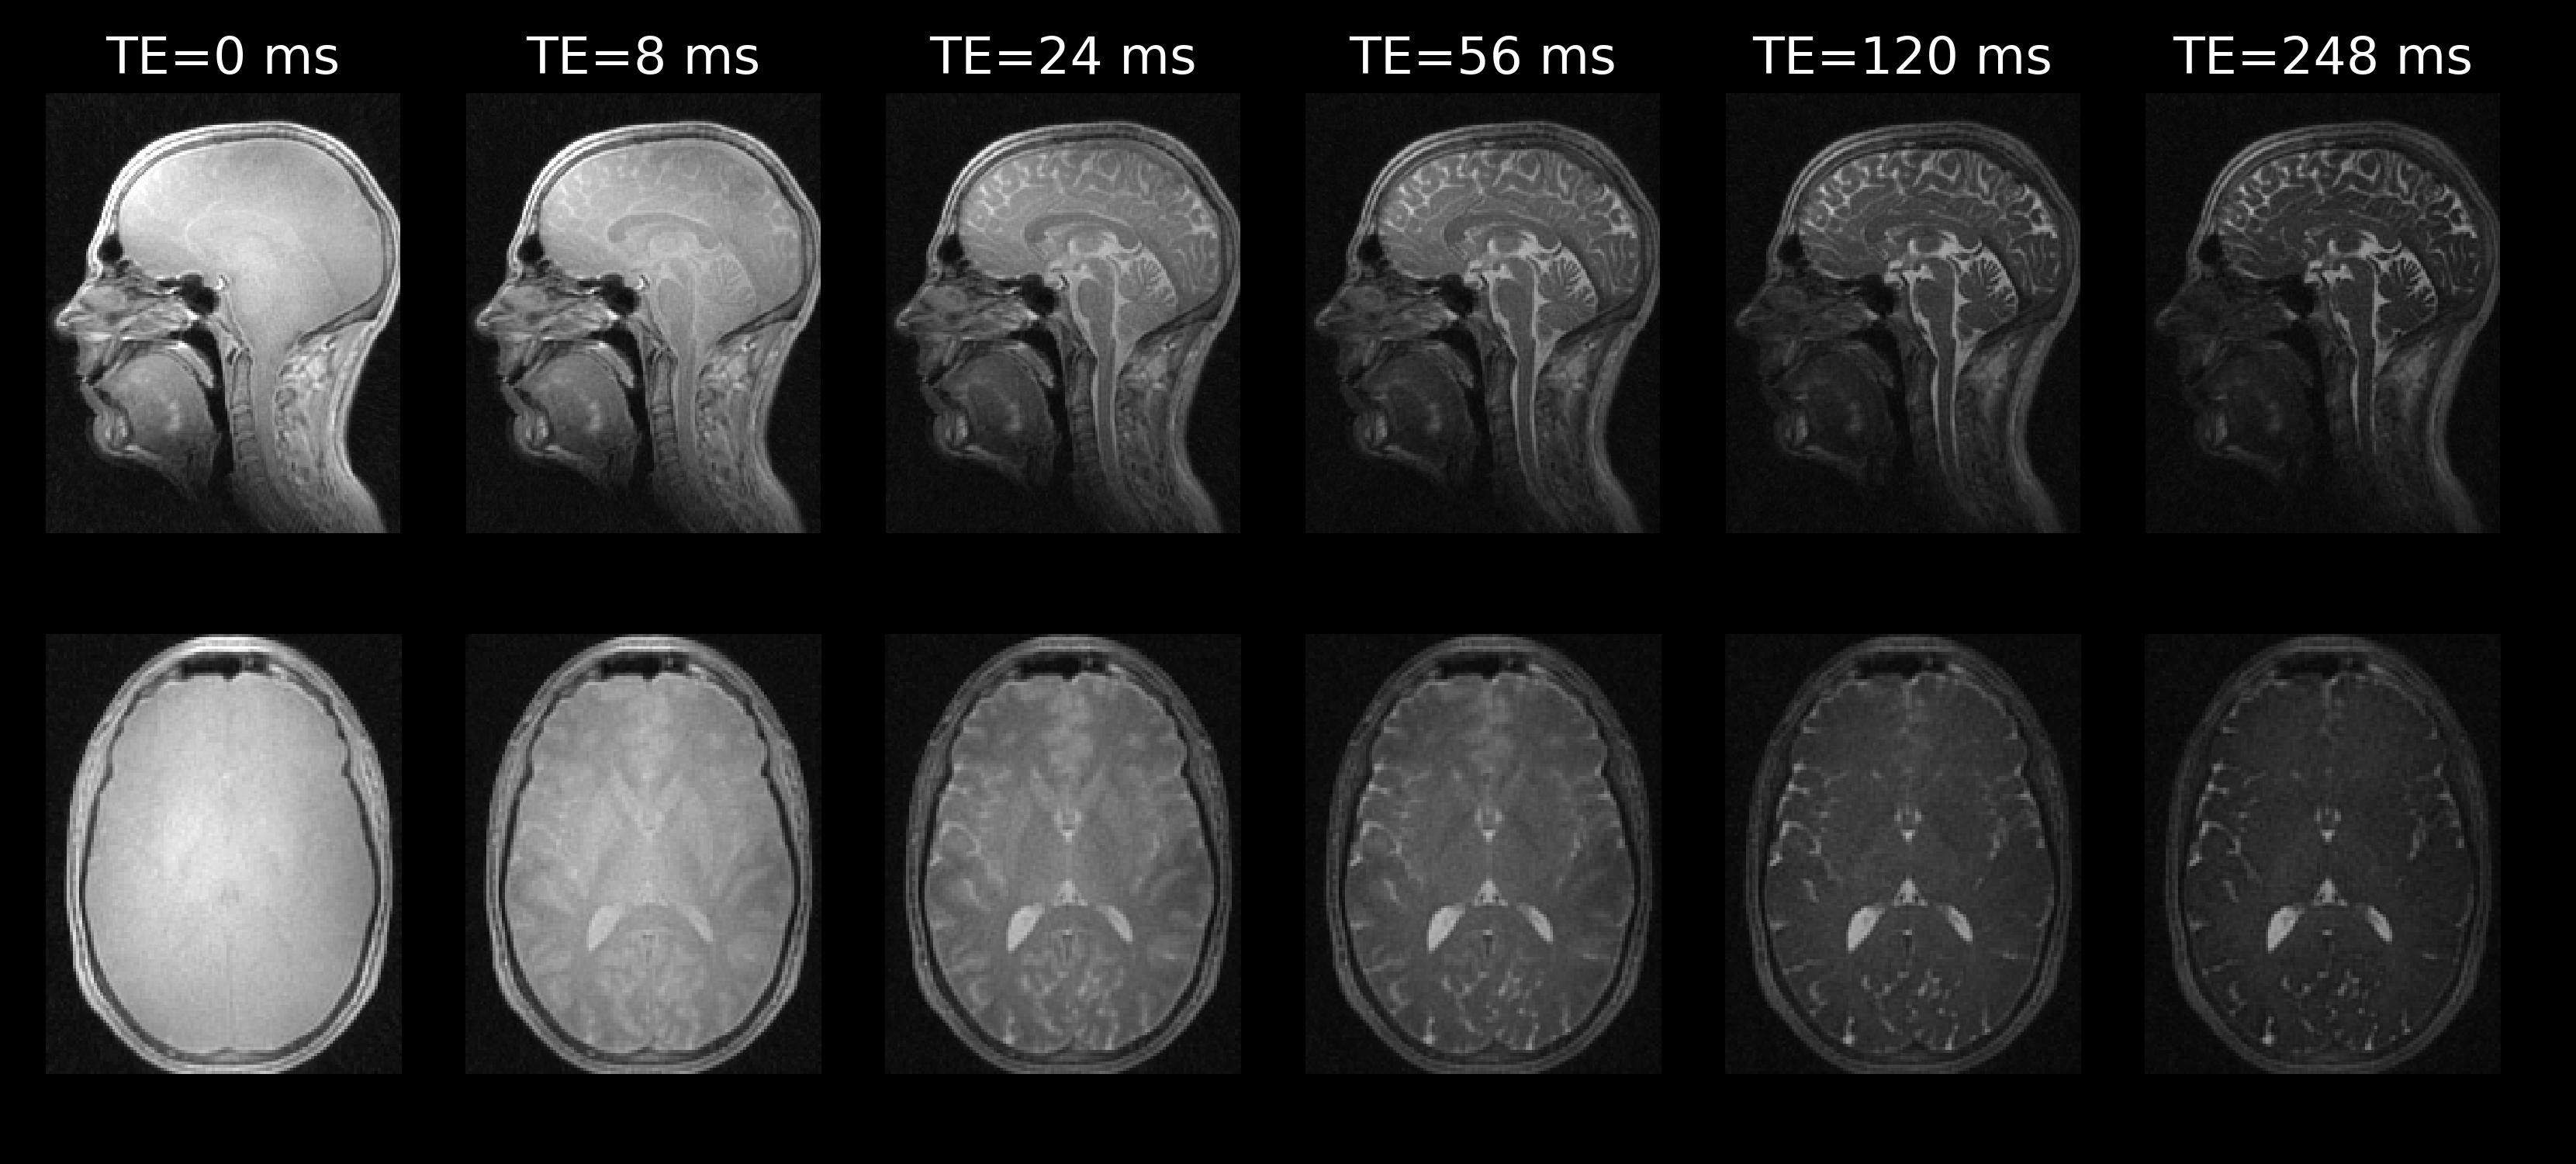
A single healthy volunteer was scanned on a GE MR750 scanner (body coil for RF transmit and a 12 channel head RF receive-coil). The mBIR-4 T2-preparation module was created with the design parameters: frequency sweep=9kHz, peak B1=0.21G, duration=10ms, effective flip angle=0°, as suggested by Nguyen et al.5. The effective echo times of the T2-preparation module were set to TE=[0,8,16,32,64,128]ms by increasing the spacing between the pulse sequence segments, as shown in figure 17. T2-prep pulse with TE=0 means that no preparation was applied. The minimum spacing between the pulses resulted in an effective echo time of 8ms, as determined by Bloch simulations. The T2-prepartion was combined with a RUFIS readout (128 spokes, flip angle 2°, readout bandwidth ±15.6 kHz, TR=2.4ms, voxel size=1.5x1.5x1.5mm3, FOV=192x192x192mm3 ). A 1.5s delay was added after each train of RUFIS and T2-preparation modules. Total acquisition time was 11 min.
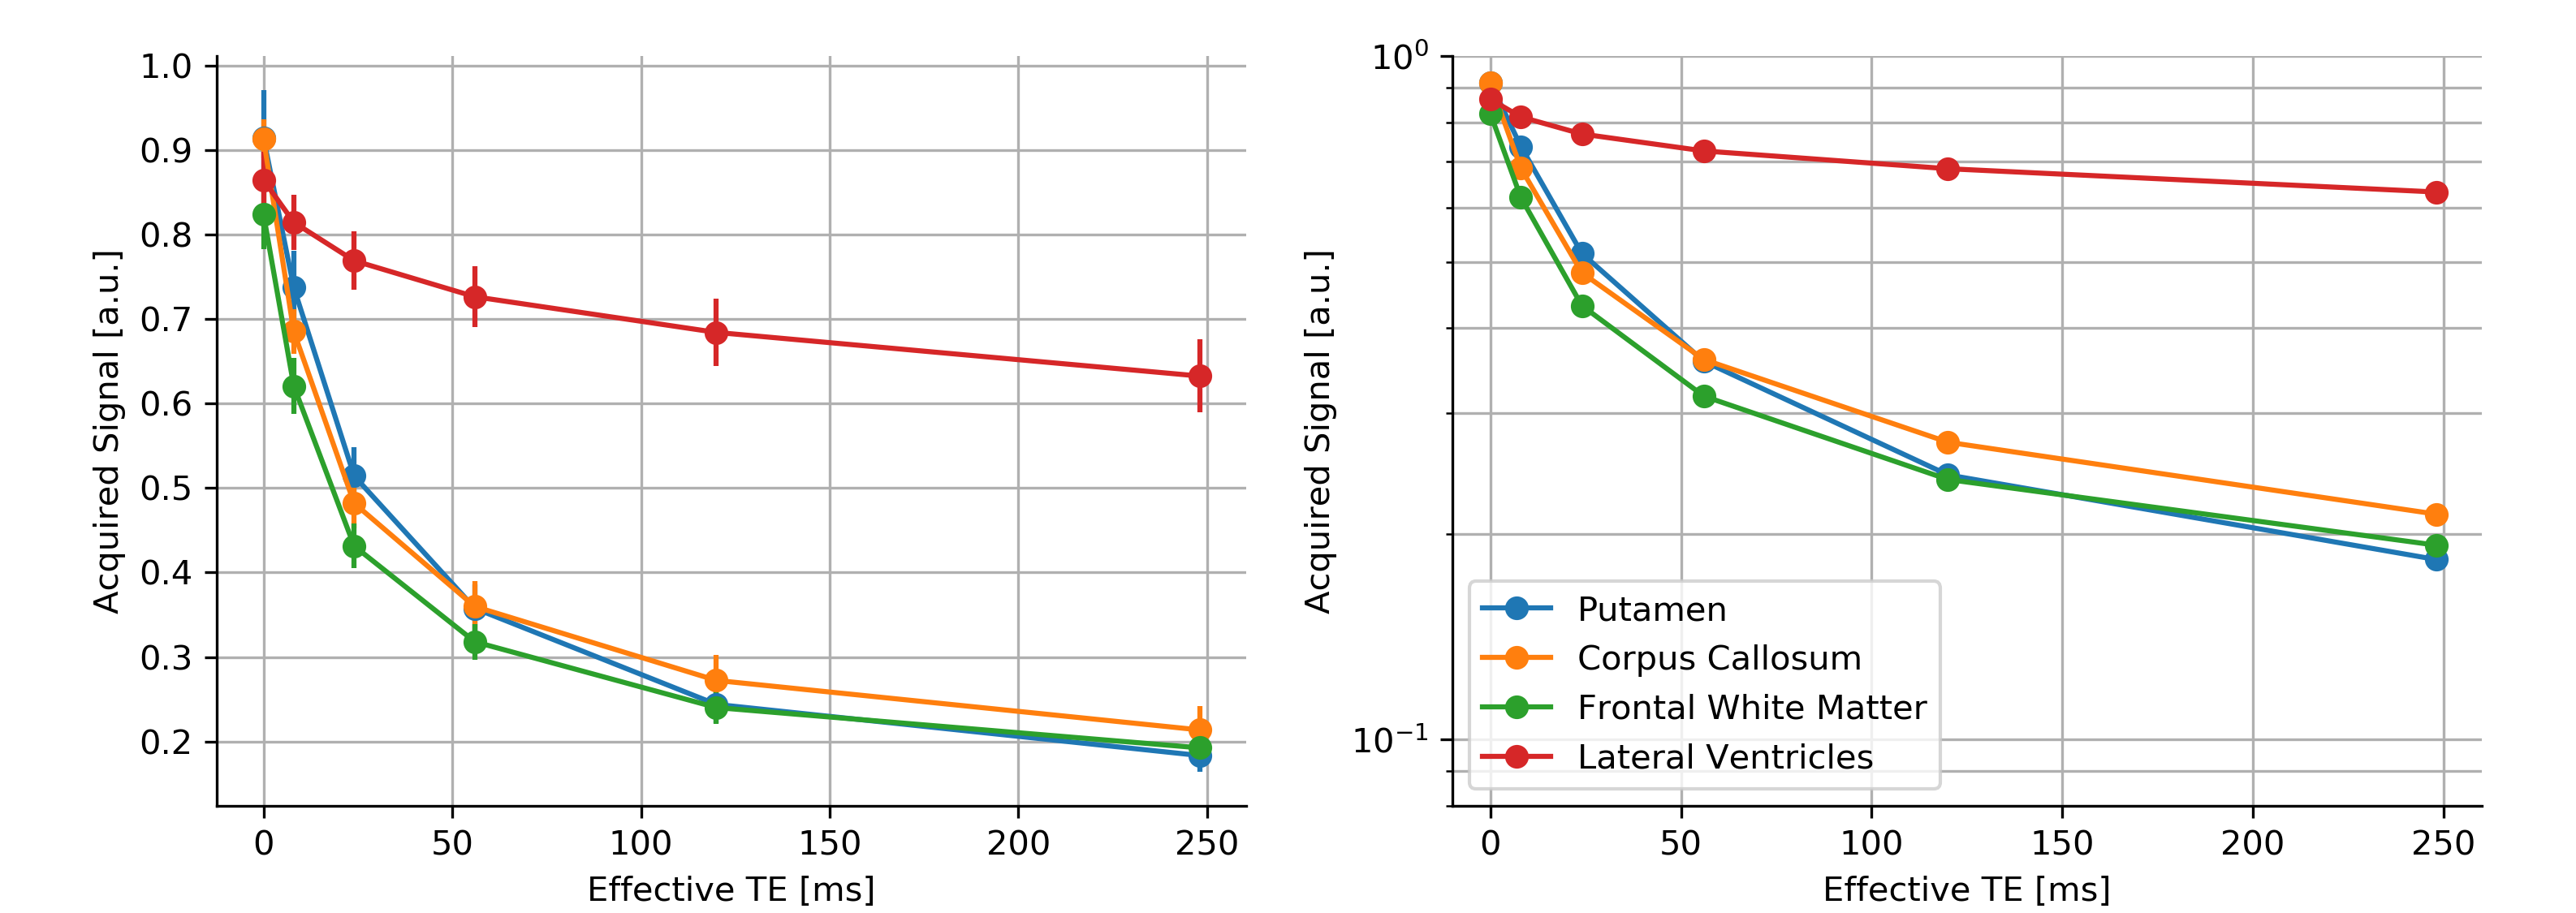
Signal-decay curves were obtained from the putamen, corpus callosum, lateral ventricles and frontal white matter from manually outlined regions of interests (ROI).
Results
Results from simulations (figure 2) shows how increasing the number of spokes increases T1-saturation and leads to the curve deviating more from that expected for simple spin echo signal decay. Plotting the data on a log scale shows that the signal-decay is not mono-exponential. This is because of T1-saturation and T1-recovery from the repeated excitation in the RUFIS readout.
In vivo results (figure 3) shows high image quality with uniform image intensity, as expected given the B0/B1-insensitivitivity of the mBIR-4 pulse. The expected T2-like signal decay is clearly seen in the images and shown for isolated ROI in figure 4. Plotting the data on a log scale shows that, as in the simulations, the data is not mono-exponential.
Discussion and Conclusion
In this work we have shown how T2-prepared RUFIS can be used for sequential acquisition of multiple echo times for rapid, silent, T2-weighted imaging. By acquiring six echo times sequentially we reduce the number of T1-recovery periods by a factor if six. We believe that this approach constitutes the first step in the development of a silent multicomponent T2 myelin imaging technique8. An advantage of the proposed technique is the freedom in choice of echo times as well as the a true TE=0 image, due to the ZTE readout. It has been suggested that six logarithmically spaced TEs from 0-300ms is sufficient for multicomponent T2-mapping5. We will investigate if this is possible using T2-prepared RUFIS or if additional measurements are necessary to account for T1-saturation as is the case for T2-estimation with mcDESPOT9.
Acknowledgements
This study represents independent research part funded by the NIHR-Wellcome Trust King's Clinical Research Facility and the National Institute for Health Research (NIHR) Biomedical Research Centre at South London and Maudsley NHS Foundation Trust and King’s College London. The views expressed are those of the author(s) and not necessarily those of the NHS, the NIHR or the Department of Health and Social Care. Funding was also received from General Electric Healthcare.References
- Madio DP, Lowe IJ. Ultra-Fast Imaging Using Low Flip Angles and FIDs. Magn Reson Med. 1995;34(4):525-529.
- Ljungberg E, Beatriz A, Sanchez S, et al. Silent T1-Mapping Using the Variable Flip Angle Method with Zero Echo Time. In: Proc. Intl. Soc. Mag. Reson. Med 26. Paris; 2018:0270.
- Garwood M, Ke Y. Symmetric pulses to induce arbitrary flip angles with compensation for rf inhomogeneity and resonance offsets. J Magn Reson. 1991;94(3):511-525
- Nezafat R, Ouwerkerk R, Derbyshire AJ, Stuber M, McVeigh ER. Spectrally selective B1-insensitive T2 magnetization preparation sequence. Magn Reson Med. 2009;61(6):1326-1335
- Nguyen TD, Deh K, Monohan E, et al. Feasibility and Reproducibility of Whole Brain Myelin Water Mapping in 4 Minutes Using Fast Acquisition with Spiral Trajectory and Adiabatic T2prep (FAST-T2) at 3T. Magn Reson Med. 2016;72(2):456–465.
- Weigel M. Extended Phase Graphs: Dephasing, RF Pulses, and Echoes - Pure and Simple. J Magn Reson Imaging. 2015;(41):266-295.
- Cao P, Zhu X, Tang S, Leynes A, Jakary A, Larson PEZ. Shuffled magnetization-prepared multicontrast rapid gradient-echo imaging. Magn Reson Med. 2018;79(1):62-70.
- MacKay A, Laule C, Vavasour I, Bjarnason T, Kolind S, Mädler B. Insights into brain microstructure from the T2 distribution. Magn Reson Imaging. 2006;24(4):515-525.
- Deoni SCL, Rutt BK, Arun T, Pierpaoli C, Jones DK. Gleaning multicomponent T1 and T2 information from steady-state imaging data. Magn Reson Med. 2008;60(6):1372-1387.
Figures