4568
Evaluation of different colormaps for best visual assessment of quantitative Magnetic Resonance Fingerprinting data1Radiology, Case Western Reserve University, Cleveland, OH, United States, 2Diagnostic, Pediatric and Interventional Radiology, Inselspital, Bern, Switzerland, 3Radiology, Mayo Clinic, Rochester, MN, United States, 4Radiology, University Hospitals Cleveland Medical Center, Cleveland, OH, United States
Synopsis
Increasingly quantitative methods such as apparent diffusion coefficient, T1, T2 and T2* mapping or elastography are used in MR imaging. As quantitative data provide multidimensional characterization of pathophysiology, color provides an additional dimensionality to visualize the data. This study demonstrates the superiority of three different colormaps over grayscale display of each T1 and T2 maps for MR Fingerprinting.
Introduction
Traditionally, radiologists base their reports and their personal/human interpretation based on a visualization approach of weighted gray scale images. However, quantitative methods such as apparent diffusion coefficient, T1 and T2 mapping are used in radiology (1, 2). As quantitative data provide multidimensional characterization of pathophysiology, color provides an additional dimensionality to visualize the data. Thus, the reader can know what data they are looking at directly from the color scale used. MR Fingerprinting (MRF) is a quantitative method that provides simultaneous mapping of multiple MR properties (T1 and T2 relaxation times) from a target tissue. MRF is able to acquire volumetric 3D datasets and future whole body coverage is imaginable. Already, multiple applications are feasible throughout brain, breast, abdomen and musculoskeletal imaging (3). In order to find a specific tissue anywhere in the body, colormaps should assist in the identification of similar tissue properties. To date there is no consensus over which color scale is most appropriate in order to be accurate and add facilitate the characterization and quantification of an underlying (pathological) tissue. Thus, the aim of the study was to investigate the use of non-gray colormaps versus grayscale maps and to evaluate which colormap is suited best for the display of T1 and T2 maps from MR Fingerprinting.Methods
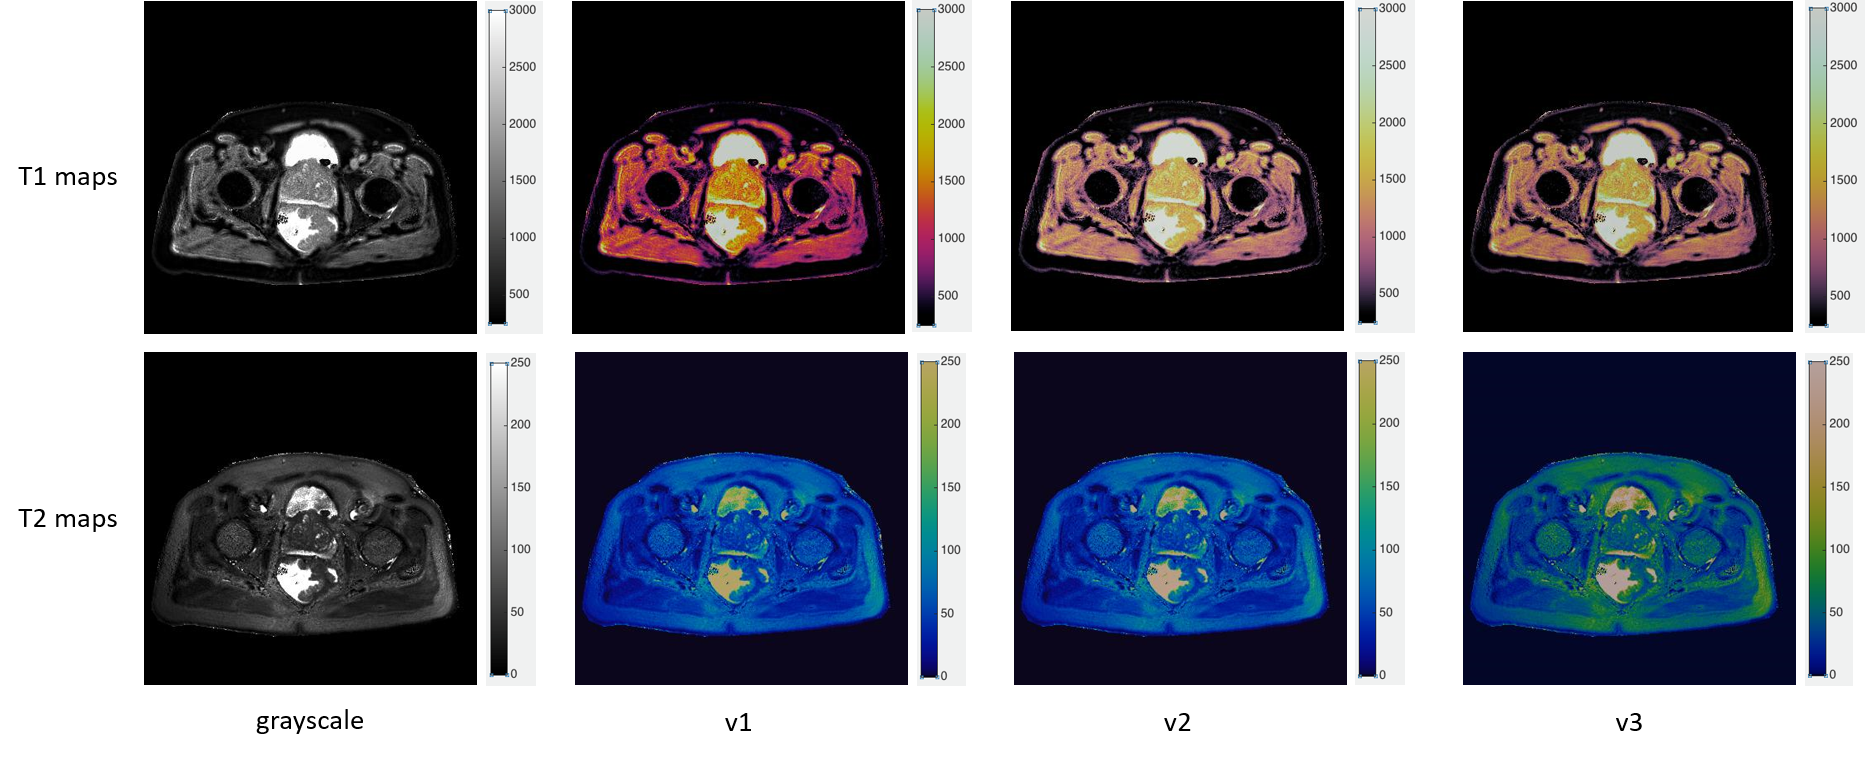
Our colormaps are based on the CIE LAB colorspace. They are multidimensional, meaning they incorporate both hue and luminance, allowing them to provide large perceptual differences between neighboring values while also showing relevant differences if viewed in greyscale. Both the T1 and T2 colormaps include exponential weighting to present their wide ranges while maintaining an approximately uniform sensitivity to small differences throughout their range. For comparison across the body, colors were kept consistent for specific values of T1 and T2, without re-windowing or change of the display. In addition, they are optimized to be used by people with colorblindness. Crucially, these maps are both intuitive to read out of context and easy to correlate with other similarly-mapped quantitative images. We compared three different colormaps for the display of T1 and T2 maps: with different min-max ranges and differing rates of color change within the maps. One T1 and one T2 map corresponded to the colormaps presented at ISMRM 2018 (4). Gray scale images were used as reference for both T1 and T2. The maps were applied to different tumor lesions (brain, breast, prostate and rectum). Eight blinded radiologists were asked to visually estimate the tumor relaxation time using only the presented T1 or T2 map, respectively. For demonstration purposes Figure 1 demonstrates an example of all maps applied to a rectal lesion. Another radiologist not involved in the blinded test measured the true relaxation times for both tissue properties with a polygonal ROI in Matlab.Results
Relaxation times attributed to the lesions based on grayscale maps differed more from true values (T1 14-108%, mean 42%; T2 12-185%, mean 67%) than colormaps (T1 2-34%, mean 15%; T2 18-46%, mean 36%) and were thus less visually accurate than colormap results (Table 1). Second, there was no consistent trend between the results of the 3 different colormaps for both T1 and T2. Mean percental error of relaxation times attributed on T1 colormaps was 15% for v1, 16% for v2 and 14% for v3, mean percental error relaxation times attributed on T2 colormaps was 32% for v1, 38% for v2 and 38% for v3 (Table 1).Discussion
These initial results suggest, that colormaps are superior to grayscale maps for the quantitative assessment of T1 and T2 maps from MR Fingerprinting. Many commercially-popular colormaps are problematic and not suited for MRF data display: First, many suffer from false edges due to inconsistent luminance gradients across the map leading to the interpretation errors and incorrect interpretation of the data when images are viewed in greyscale. Second, many default colormaps lack intuitiveness–a user must rely on a colorbar to form an understanding the relationship between a dataset and the colors used. A strong colormap should 1) demonstrate an intuitive order; 2) have discriminative power; 3) clearly show uniformity (i.e. no boundaries or Mach bands); 3) be robust to vision deficiencies; 4) be device independent but tissue property specific; and 5) show contrast effects and shading clearly. In addition, they should be aesthetically pleasing. All these criteria are fulfilled in our suggested colormaps.Conclusion
We could demonstrate the superiority of colormaps over grayscale display of T1 and T2 maps for MR Fingerprinting. To assess the advantages of the subtle differences between the different colormaps presented further larger scale assessments are suggested, since all of the colormaps outperformed grayscale and there was little consistent difference between the colormaps.Acknowledgements
This work was supported by NIH grant 1R01EB016728-01A1 and Siemens Healthineers.References
1. Hoad CL, Palaniyappan N, Kaye P, Chernova Y, James MW, Costigan C, et al. A study of T(1) relaxation time as a measure of liver fibrosis and the influence of confounding histological factors. NMR in biomedicine. 2015;28(6):706-14.
2. Yu AC, Badve C, Ponsky LE, Pahwa S, Dastmalchian S, Rogers M, et al. Development of a Combined MR Fingerprinting and Diffusion Examination for Prostate Cancer. Radiology. 2017:161599.
3. Panda A, Mehta BB, Coppo S, Jiang Y, Ma D, Seiberlich N, et al. Magnetic Resonance Fingerprinting-An Overview. Current opinion in biomedical engineering. 2017;3:56-66.
4. Griswold M, Sunshine J, Seiberlich N, Gulani V. Towards Unified Colormaps for Quantitative MRF Data. Abstract 2894. Proc Int Soc Mag Res Med 26 (2018). Paris, France.
Figures