4567
A novel strategy to perform the dual flip angle method for the fast and accurate T1 mapping by MRI1SUNY Geneseo, Geneseo, NY, United States, 2University of Colorado School of Medicine, Aurora, CO, United States
Synopsis
Fast T1 mapping can be done by utilizing dual flip angles in acquiring spoiled gradient echo signals. However, its accuracy may be questionable even when the suggested optimal flip angle pair is used. Noting that the faithful action of the prescribed flip angles is the key to the accuracy, we present here a novel dual flip angle method by which the system-specific RF-pulse fidelity of flip angles can be validated and, if necessary, calibrated to improve the T1 accuracy in a wide in vivo range. We tested this method on a few 1.5 or 3T MRI systems of major vendors.
Introduction
In the conventional dual flip angle (C-DFA) method, an optimal flip angle (FA) pair is suggested for a specific target T1 value to minimize the T1 uncertainty (1-3). However, the accuracy of T1 mapping is sometimes questionable, particularly over a wide range of T1 values. The main reason for this problem is the discrepancy between the prescribed and the actual FAs. Although spatial B1 inhomogeneity may sometimes be responsible, the system-specific FA calibration also plays a significant role to the discrepancy. Here, we propose a novel dual flip angle (N-DFA) method which renders us to reconsider the validity of conventionally suggested optimal FAs in order to overcome practical limitations of the C-DFA method.Methods
A T1 phantom was made of 12 vials (each of 50 ml capacity) containing distilled water and different concentrations of gadolinium contrast agent. MRI scans were performed using the phantom in 5 different MRI systems (1.5T or 3T, including all major vendors). At first, the phantom was scanned by the inversion recovery-based sequence (TI= varied from 50ms to 2000ms, TR=4s, TE=8ms) to determine the T1 value of each vial, which was taken as a reference T1 for each vial for the particular scanner at the time of the experiment. The phantom was then repeatedly scanned by a spoiled gradient echo-based sequence (SPGR, FLASH, or T1-FFE for GE, Siemens, or Philips) while the FA was changed by a small step (2°) in the range from 1° to 43°. For the SPGR sequences, a variation of the technique (3D or 2D) was also tested. The determined T1 values by the C-DFA method with optimal FAs were made to the reference values. A new strategy (the N-DFA method) was also developed to make the signal ratio acquired with certain FA pair, S(θ1)/S(θ2), almost linear over the wide T1 range. Fine calibration of FAs, if necessary, was performed by finding the line equation in the N-DFA method, and the resulting T1 values were compared to the reference values.Results
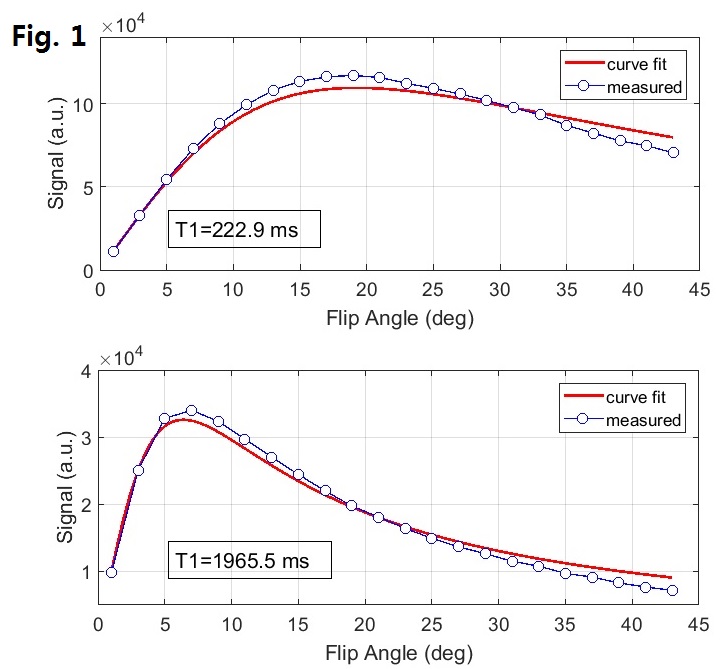
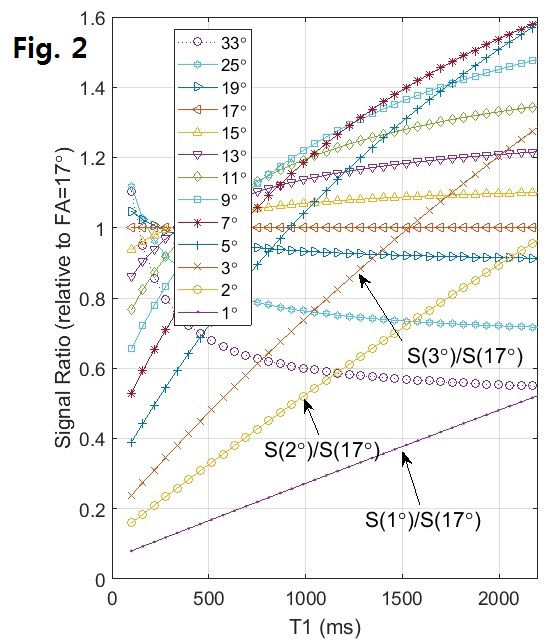
SPGR signal change curves over different FAs and their fit curves are shown in Fig. 1, where the discrepancy of the actual data and the fit curve clearly suggests that the FA may not be accurate (therefore C-DFA method may not work well) other than certain flip angles or angle ranges. Simulation curves of SPGR signals divided by a certain reference FA signal are shown in Fig. 2, where the signal with FA=1°, 2° or 3°, when divided by the signal with FA=17°, demonstrates almost linear relationship to the T1 values. The pair of FA=2° and 17° was chosen here in the N-DFA method and, after acquiring actual data from the phantom, the linear calibration parameters for the N-DFA method were obtained by the linear fit to the actual curve (shown in Fig. 3), and used successively to determine the T1 values with specific measured signal ratios. The T1 values obtained by the C-DFA and N-DFA methods were compared to the reference values and are shown in Fig. 4, where the T1 map obtained for the phantom, determined by the N-DFA method, is also shown.Discussion
Although optimal FA pairs are proposed in the C-DFA method (1-3) to minimize the uncertainty of T1 determination, the underlying assumption is the faithful action of the RF pulse for the prescribed FAs. However, system- and pulse sequence-specific FA calibration cannot be precisely done in all FAs, and, as shown in our experiments, that assumption may break. As a result, the accuracy of T1 mapping by the C-DFA method can be compromised. Therefore, we have come up with a novel strategy (the N-DFA method) to overcome this problem.
The need for tailored calibration for each technique is also suggested in Fig. 5, where the B1+rms (and SAR) for each prescribed FA is plotted for 2D or 3D technique. In Fig. 5, system FA calibration may be different between 3D and 2D, and even for the same 3D, below and above the FA around 19°. Therefore, we have chosen 17° in the N-DFA method, as well as the low FA value of 2° to make the linear relationship as shown in Figs. 2 & 3.
Conclusion
By utilizing the linear relationship of the signal ratio to the T1 values when the specific FA pairs (e.g. 2° and 17°, not the conventionally suggested optimal FAs) are used, the N-DFA method provides the possibility of tailored FA calibration to specific systems or sequences and improves the accuracy of T1 mapping in a wide in vivo range of T1 values.Acknowledgements
Dr. Ann Scherzinger, Ph.D., section chief, and Dr. Gerald Dodd, M.D., Chair of Department of Radiology for the other support
References
1. Wang HZ, Riederer SJ, Lee JN. Optimizing the precision in T1 relaxation estimation using limited flip angles. Magn Reson Med. 1987; 5:399‐416.
2. Deoni SCL, Rutt BK, Peters TM. Rapid combined T1 and T2 mapping using gradient recalled acquisition in the steady state. Magn Reson Med. 2003; 49:515‐526.
3. Schabel MC, Morrell GR. Uncertainty in T1 mapping using the variable flip angle method with two flip angles. Phys Med Biol. 2009; 54:N1-N8.
Figures