4562
Quantitative and synthetic MRI using a Multi-Pathway Multi-Echo (MPME) acquisition followed by machine-learning contrast translation1Radiology, Brigham and Women's Hospital, Harvard Medical School, Boston, MA, United States
Synopsis
Brain exams would ideally include 3D quantitative maps of several basic MR parameters, such as T1, T2, T2* and B0, along with popular qualitative contrasts such as MPRAGE and FLAIR, for example. A multi-pathway multi-echo (MPME) pulse sequence was developed that captured vast amounts of information about the imaged object relatively fast, but not necessarily with image contrasts that radiologists might be comfortable reading. A neural network was trained to act as a ‘contrast translator’, to convert information rapidly obtained from MPME scans into useful quantitative and qualitative contrasts, in effect condensing a whole exam into a single 3D scan.
Introduction
Quantitative MRI methods1-5 provide diagnostically-valuable information to help discriminate healthy and disease states. Ideally, modern protocols would combine traditionally-employed contrasts such as ‘magnetization prepared rapid gradient-echo’ (MPRAGE) and ‘fluid-attenuated inversion recovery’ (FLAIR) with 3D quantitative parameter mapping. However, total scan time can place limits on the number of sequences being run.
A multi-pathway multi-echo (MPME) pulse sequence similar to that in Ref.4 was developed that captures vast amounts of information about the imaged object. A neural network (NN) was trained as a ‘contrast translator’, to convert the information captured by the MPME sequence into better-known and arguably more useful contrast types, more specifically 3D quantitative maps of T1, T2 and B0, along with 3D MPRAGE-like and FLAIR-like images. As a result, the equivalent of an entire exam might be generated based on information from the MPME scan alone, when combined with NN-based contrast translation.
Methods
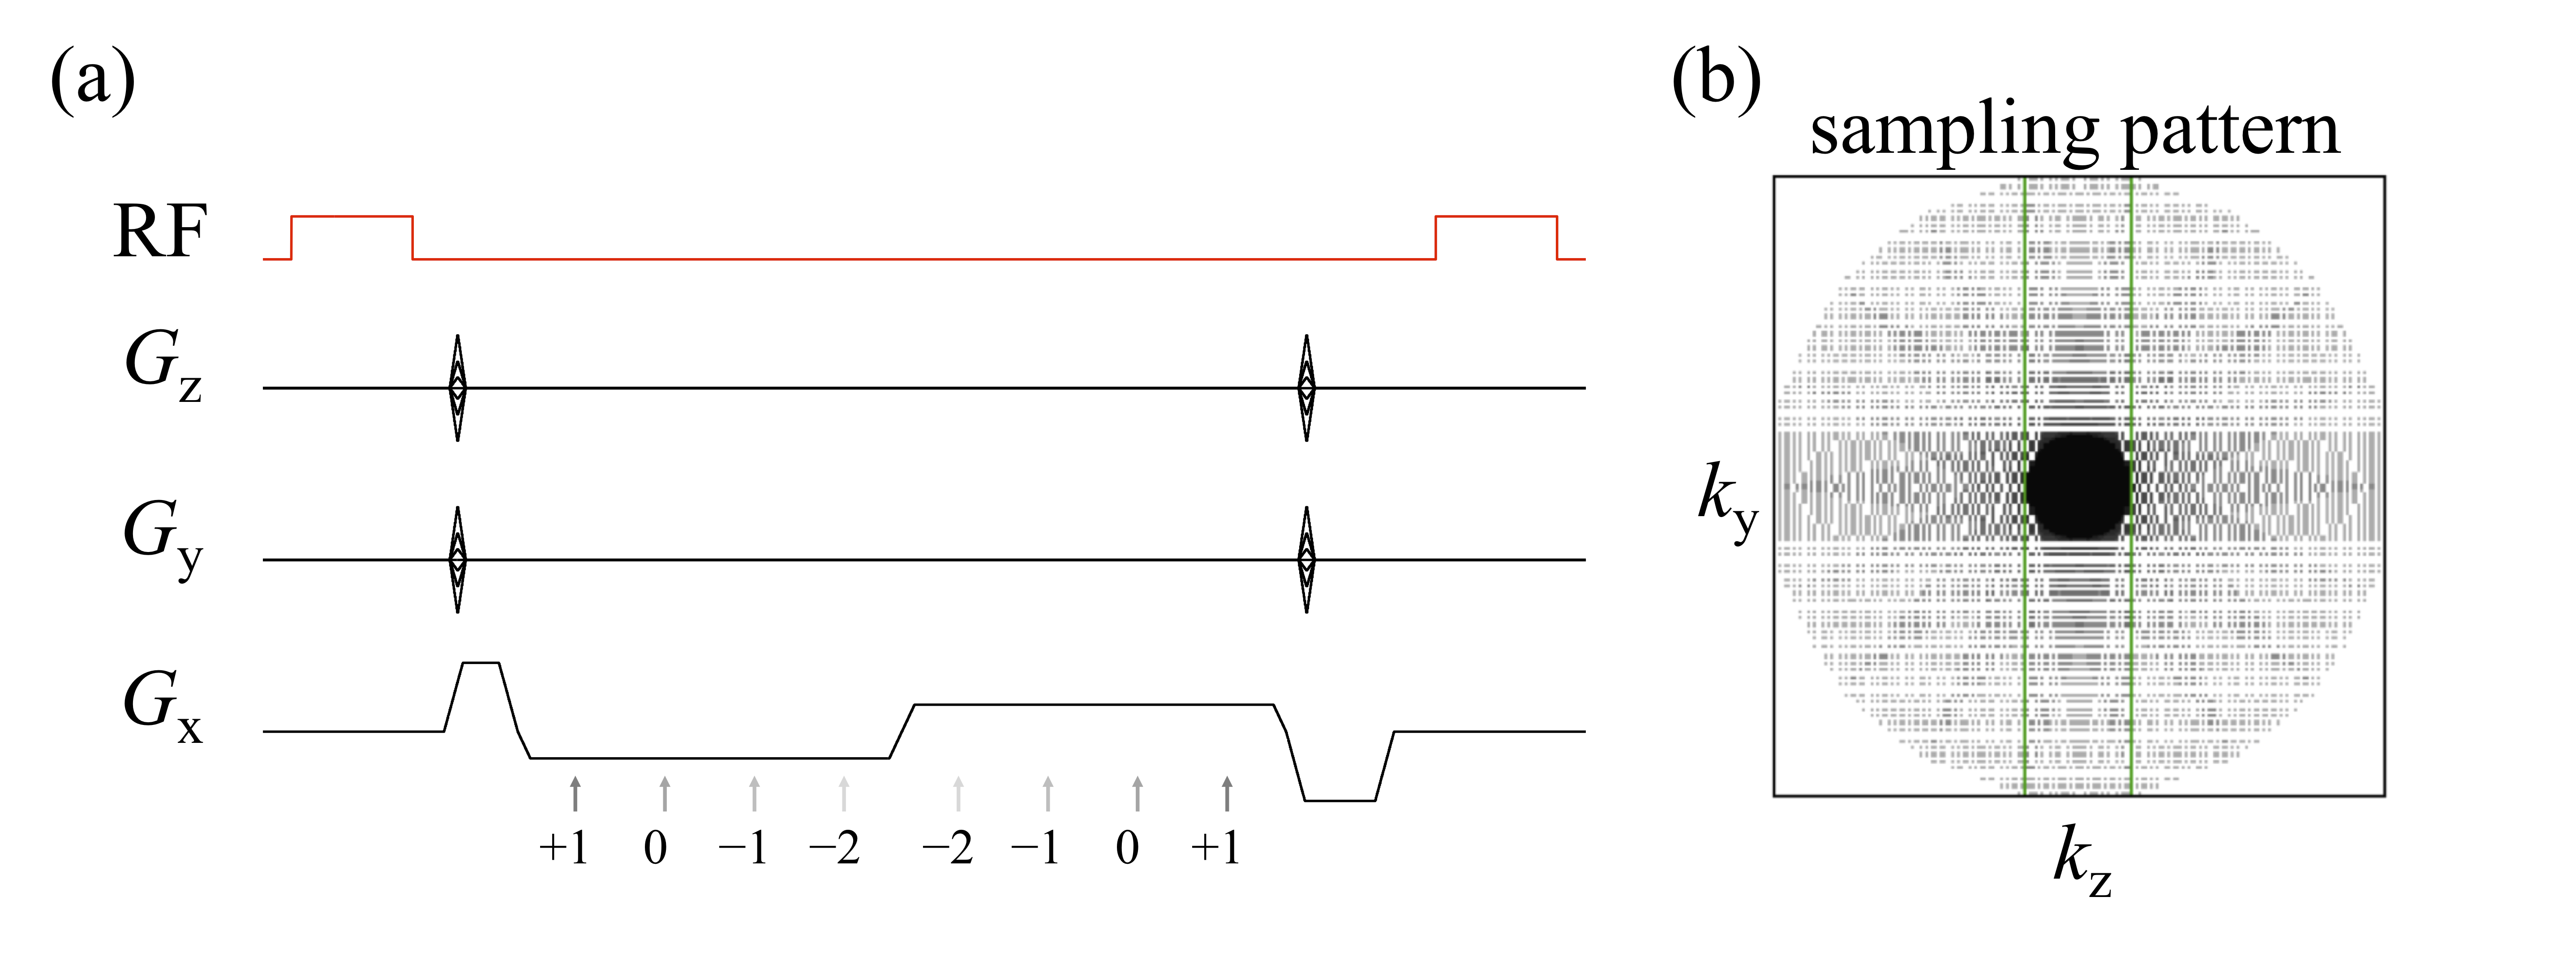
Eight healthy volunteers (1/7 female/male, 32±8.8 years old) were scanned following informed consent (Siemens Trio, 12-channel head matrix). The MPME sequence sampled four different pathways (-2nd, -1st, 0th and 1st) at two different echo times, see Fig. 1a (TR=20ms, α=9°, 1.2mm isotropic resolution). A PROPELLER-like scheme (Fig 1b) was employed in the ky-kz plane for increased motion robustness, and a conservative acceleration factor of 1.55-fold was used. Scan time was 6min41s in all volunteers but one; in one volunteer, a larger FOV due to larger head size led to a scan time of 7min58s instead. MPME data were reconstructed using software from the BART toolbox.5 B0 maps were computed from MPME data in a conventional way.
Ultimately, MPME data and NN-based contrast translation might conceivably be used to generate most needed contrasts. But in the present work, training and validation involved several other pulse sequences: IR-SE to generate 2D T1 maps (TE/TR=88/6000ms, TI=50, 300, 800, 2400ms, total acquisition time=12min20s). SE to generate 2D T2 maps (TR=1000ms, TE=25, 50, 90, 120ms; total acquisition time=10min08s). 3D MPRAGE (TE/TR=3.76/1750ms, α=9°, 3min42s) and 2D FLAIR (TE/TR=88/6000ms, α=130°, 1min38s) were also employed.
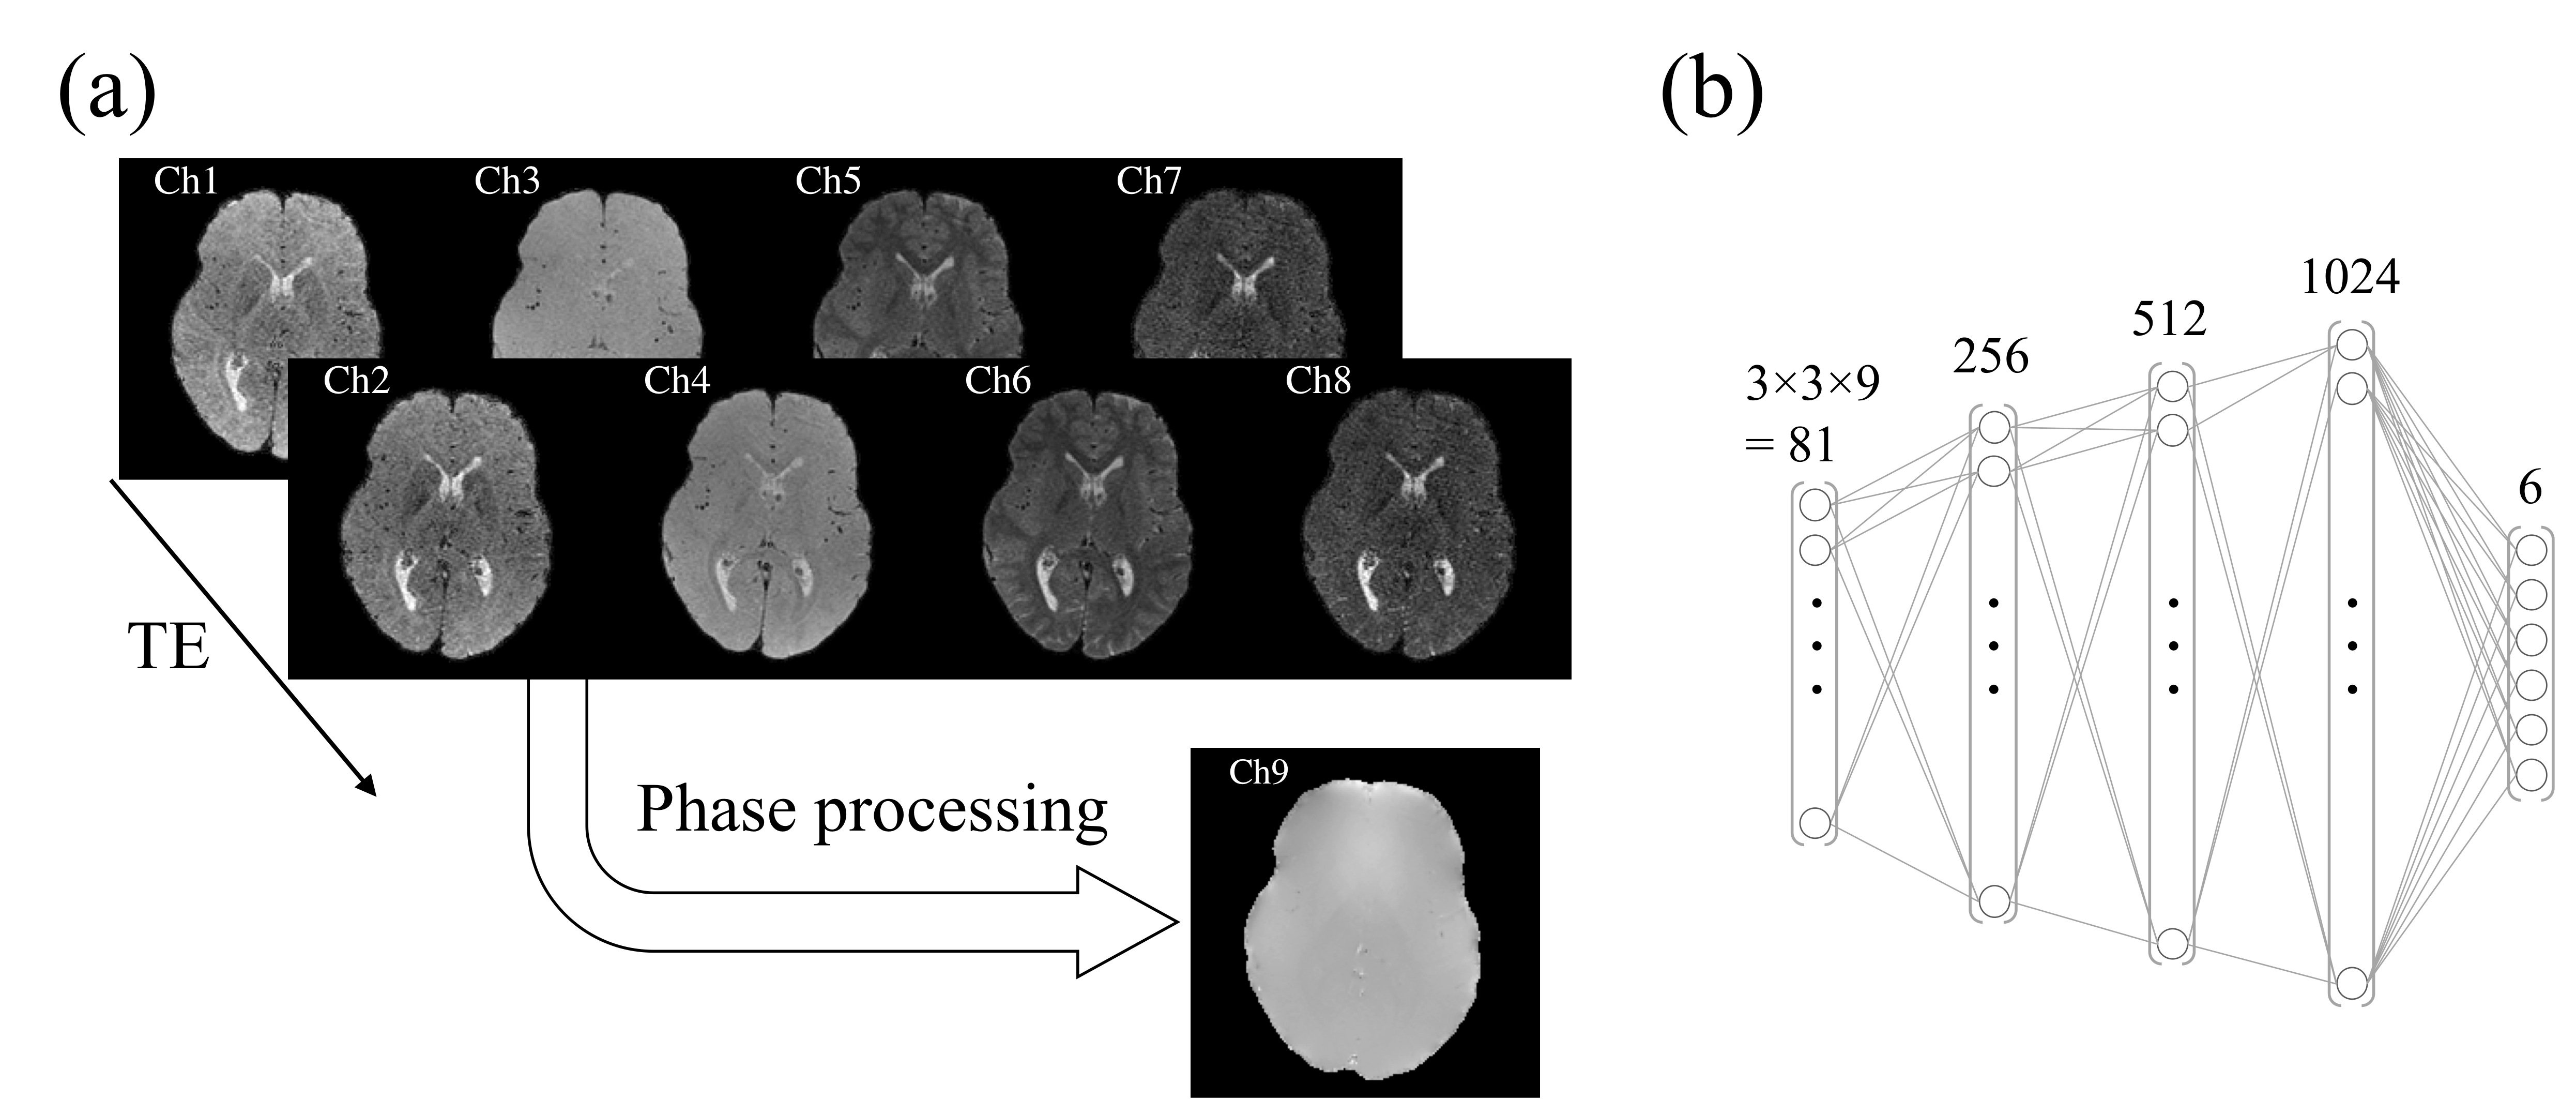
A localized feedforward neural network (NN) was implemented using Keras V.2.2.0 (Tensorflow 1.5.0 backend) in Python 3.6 and trained on an Nvidia Titan Xp GPU (Nvidia Coporation, Santa Clara, CA, USA). The input to the NN consisted of the eight MPME contrasts (4 pathways × 2 echo times, see Fig. 2a) along with the calculated field map, over a patch of 3×3 voxels. In contrast, there were 6 output channels: T1, T2, T1-weighted, T2-weighted, MPRAGE-like and FLAIR-like values (see Fig. 2b). The mean squared error loss function was used to train the neural network, using the ‘Adam’ optimizer.6
A ‘leave-one-out’ scheme was employed for training/validation: for example, when using data from Subject #1 for validation purposes, the corresponding NN was trained using data from Subjects #2-7. More generally, for each subject, data from this one subject was used for validation while data from all other subjects were used for training. In the process, eight different (but presumably similar) NNs were trained. Qualitative contrasts (e.g. MPRAGE and FLAIR) were scaled so that white matter had a signal of roughly 1.0.
Results
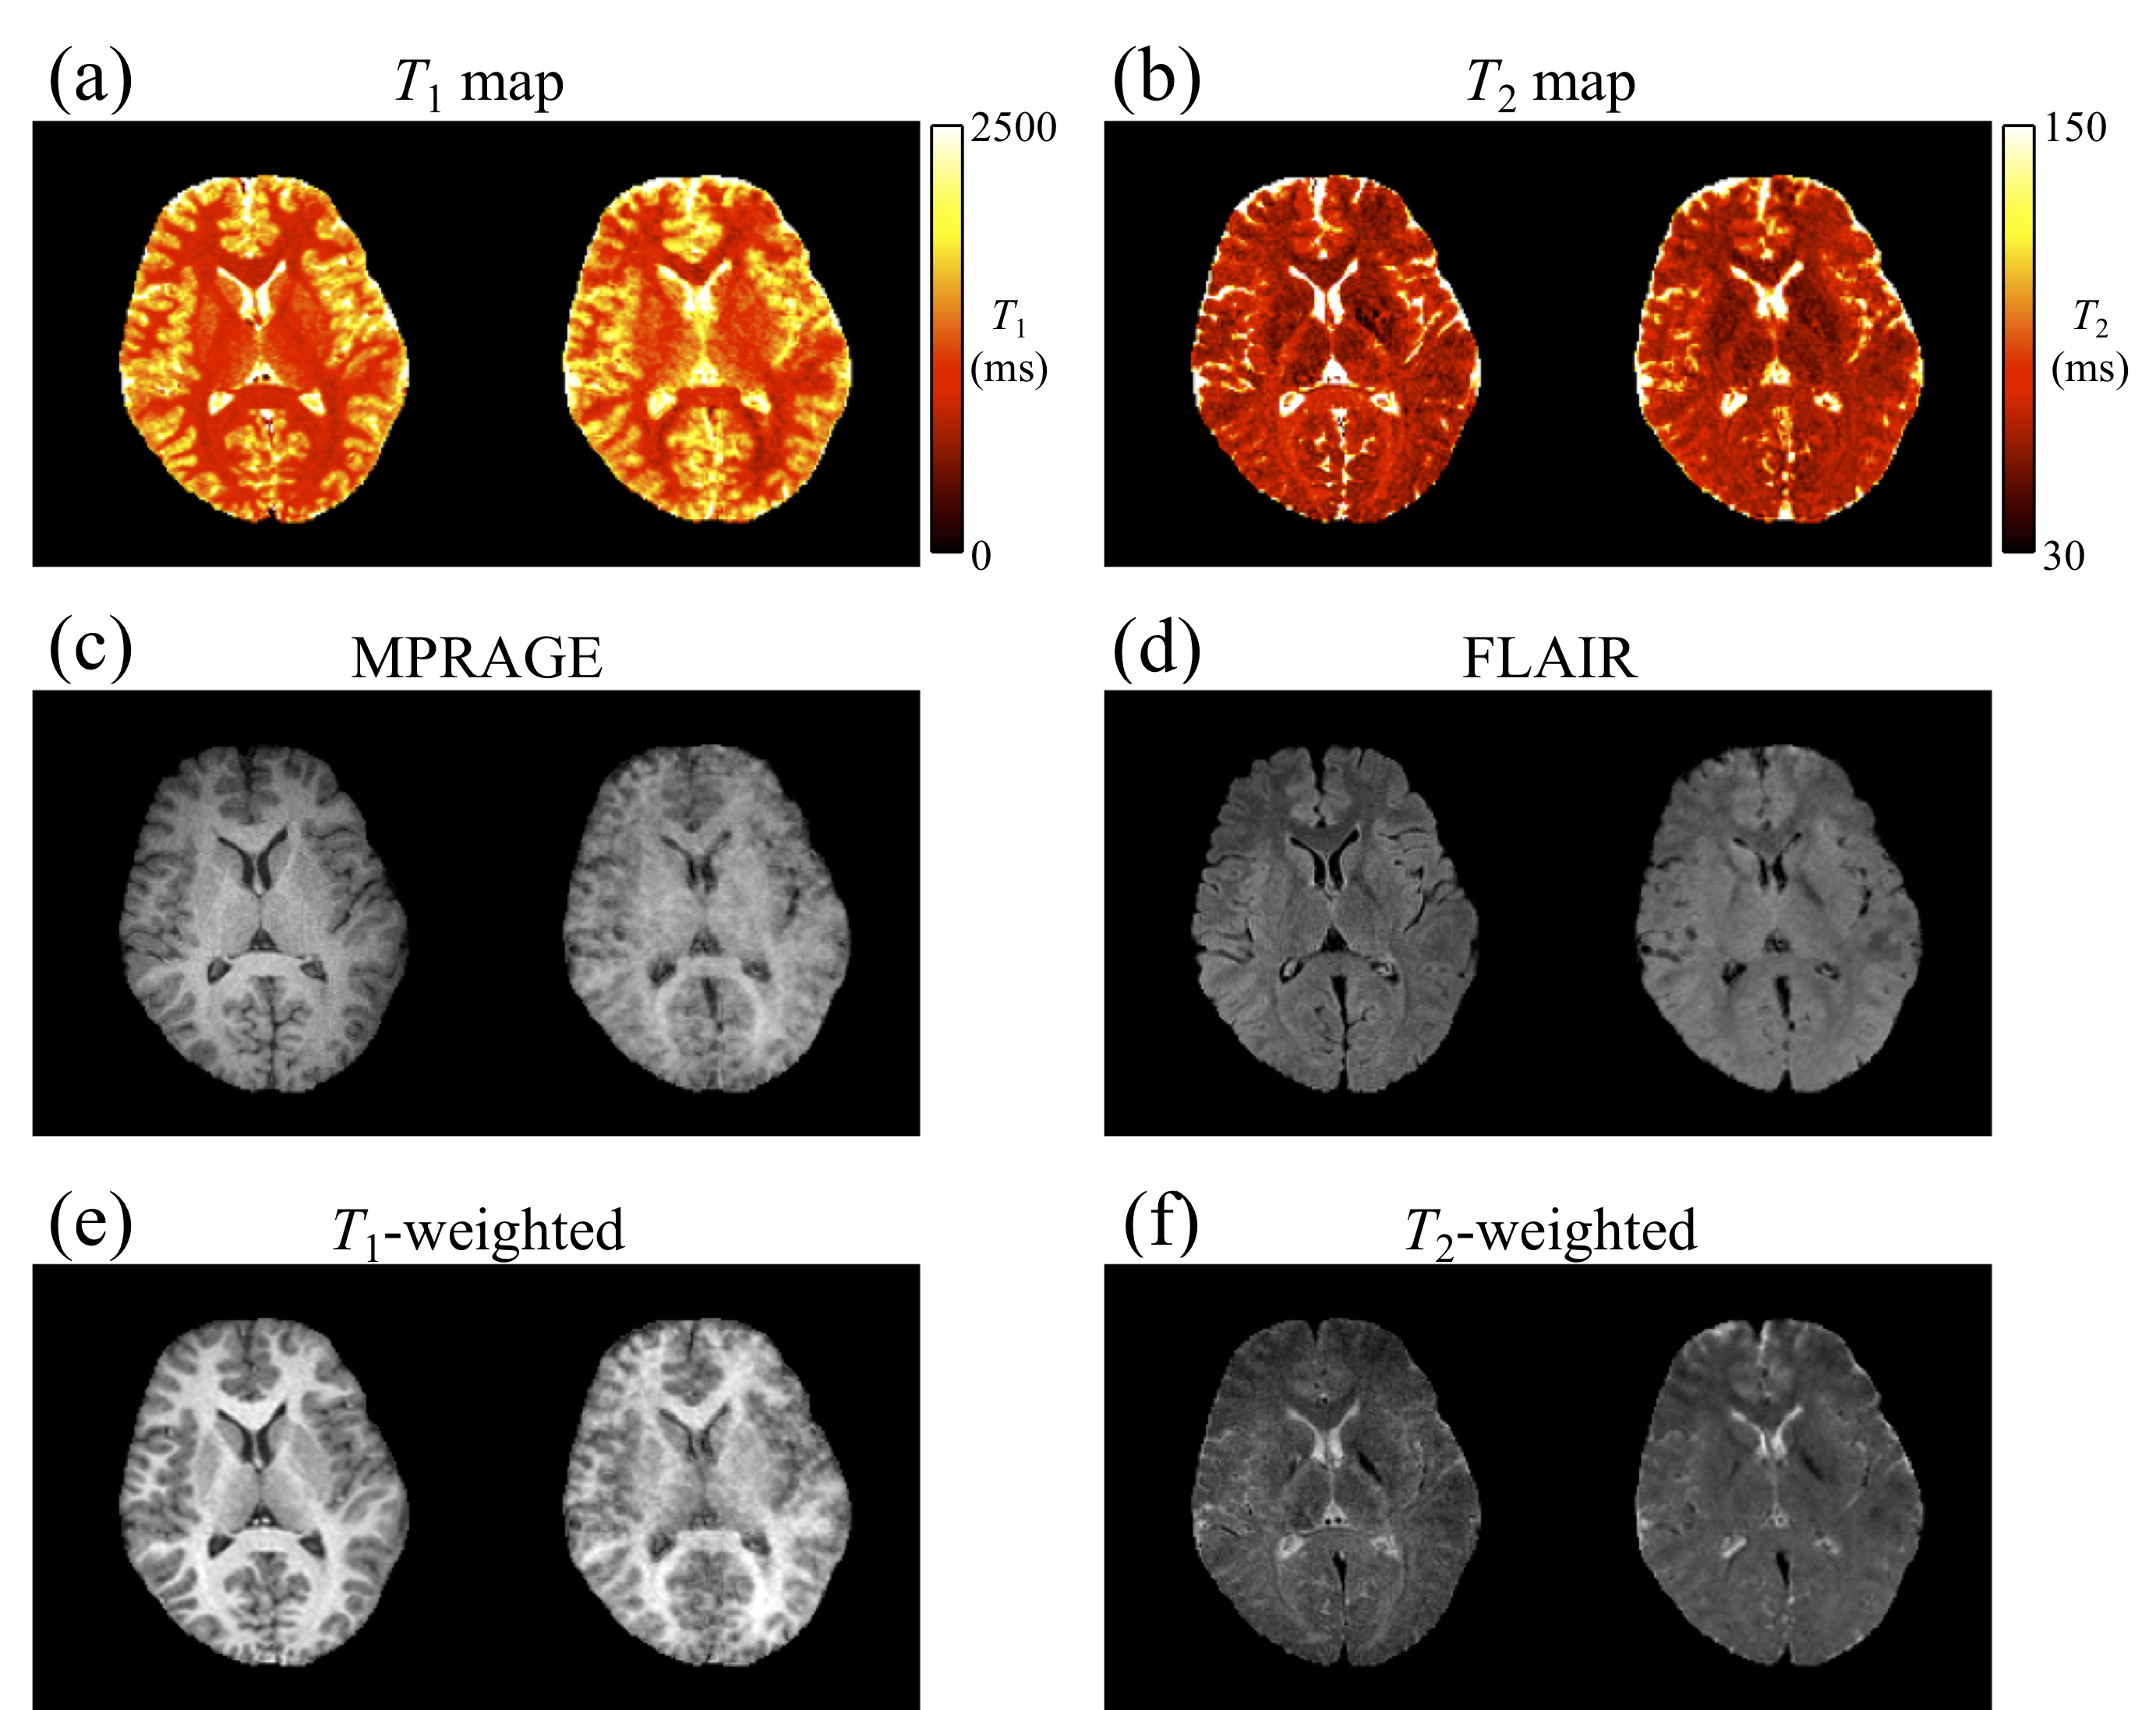
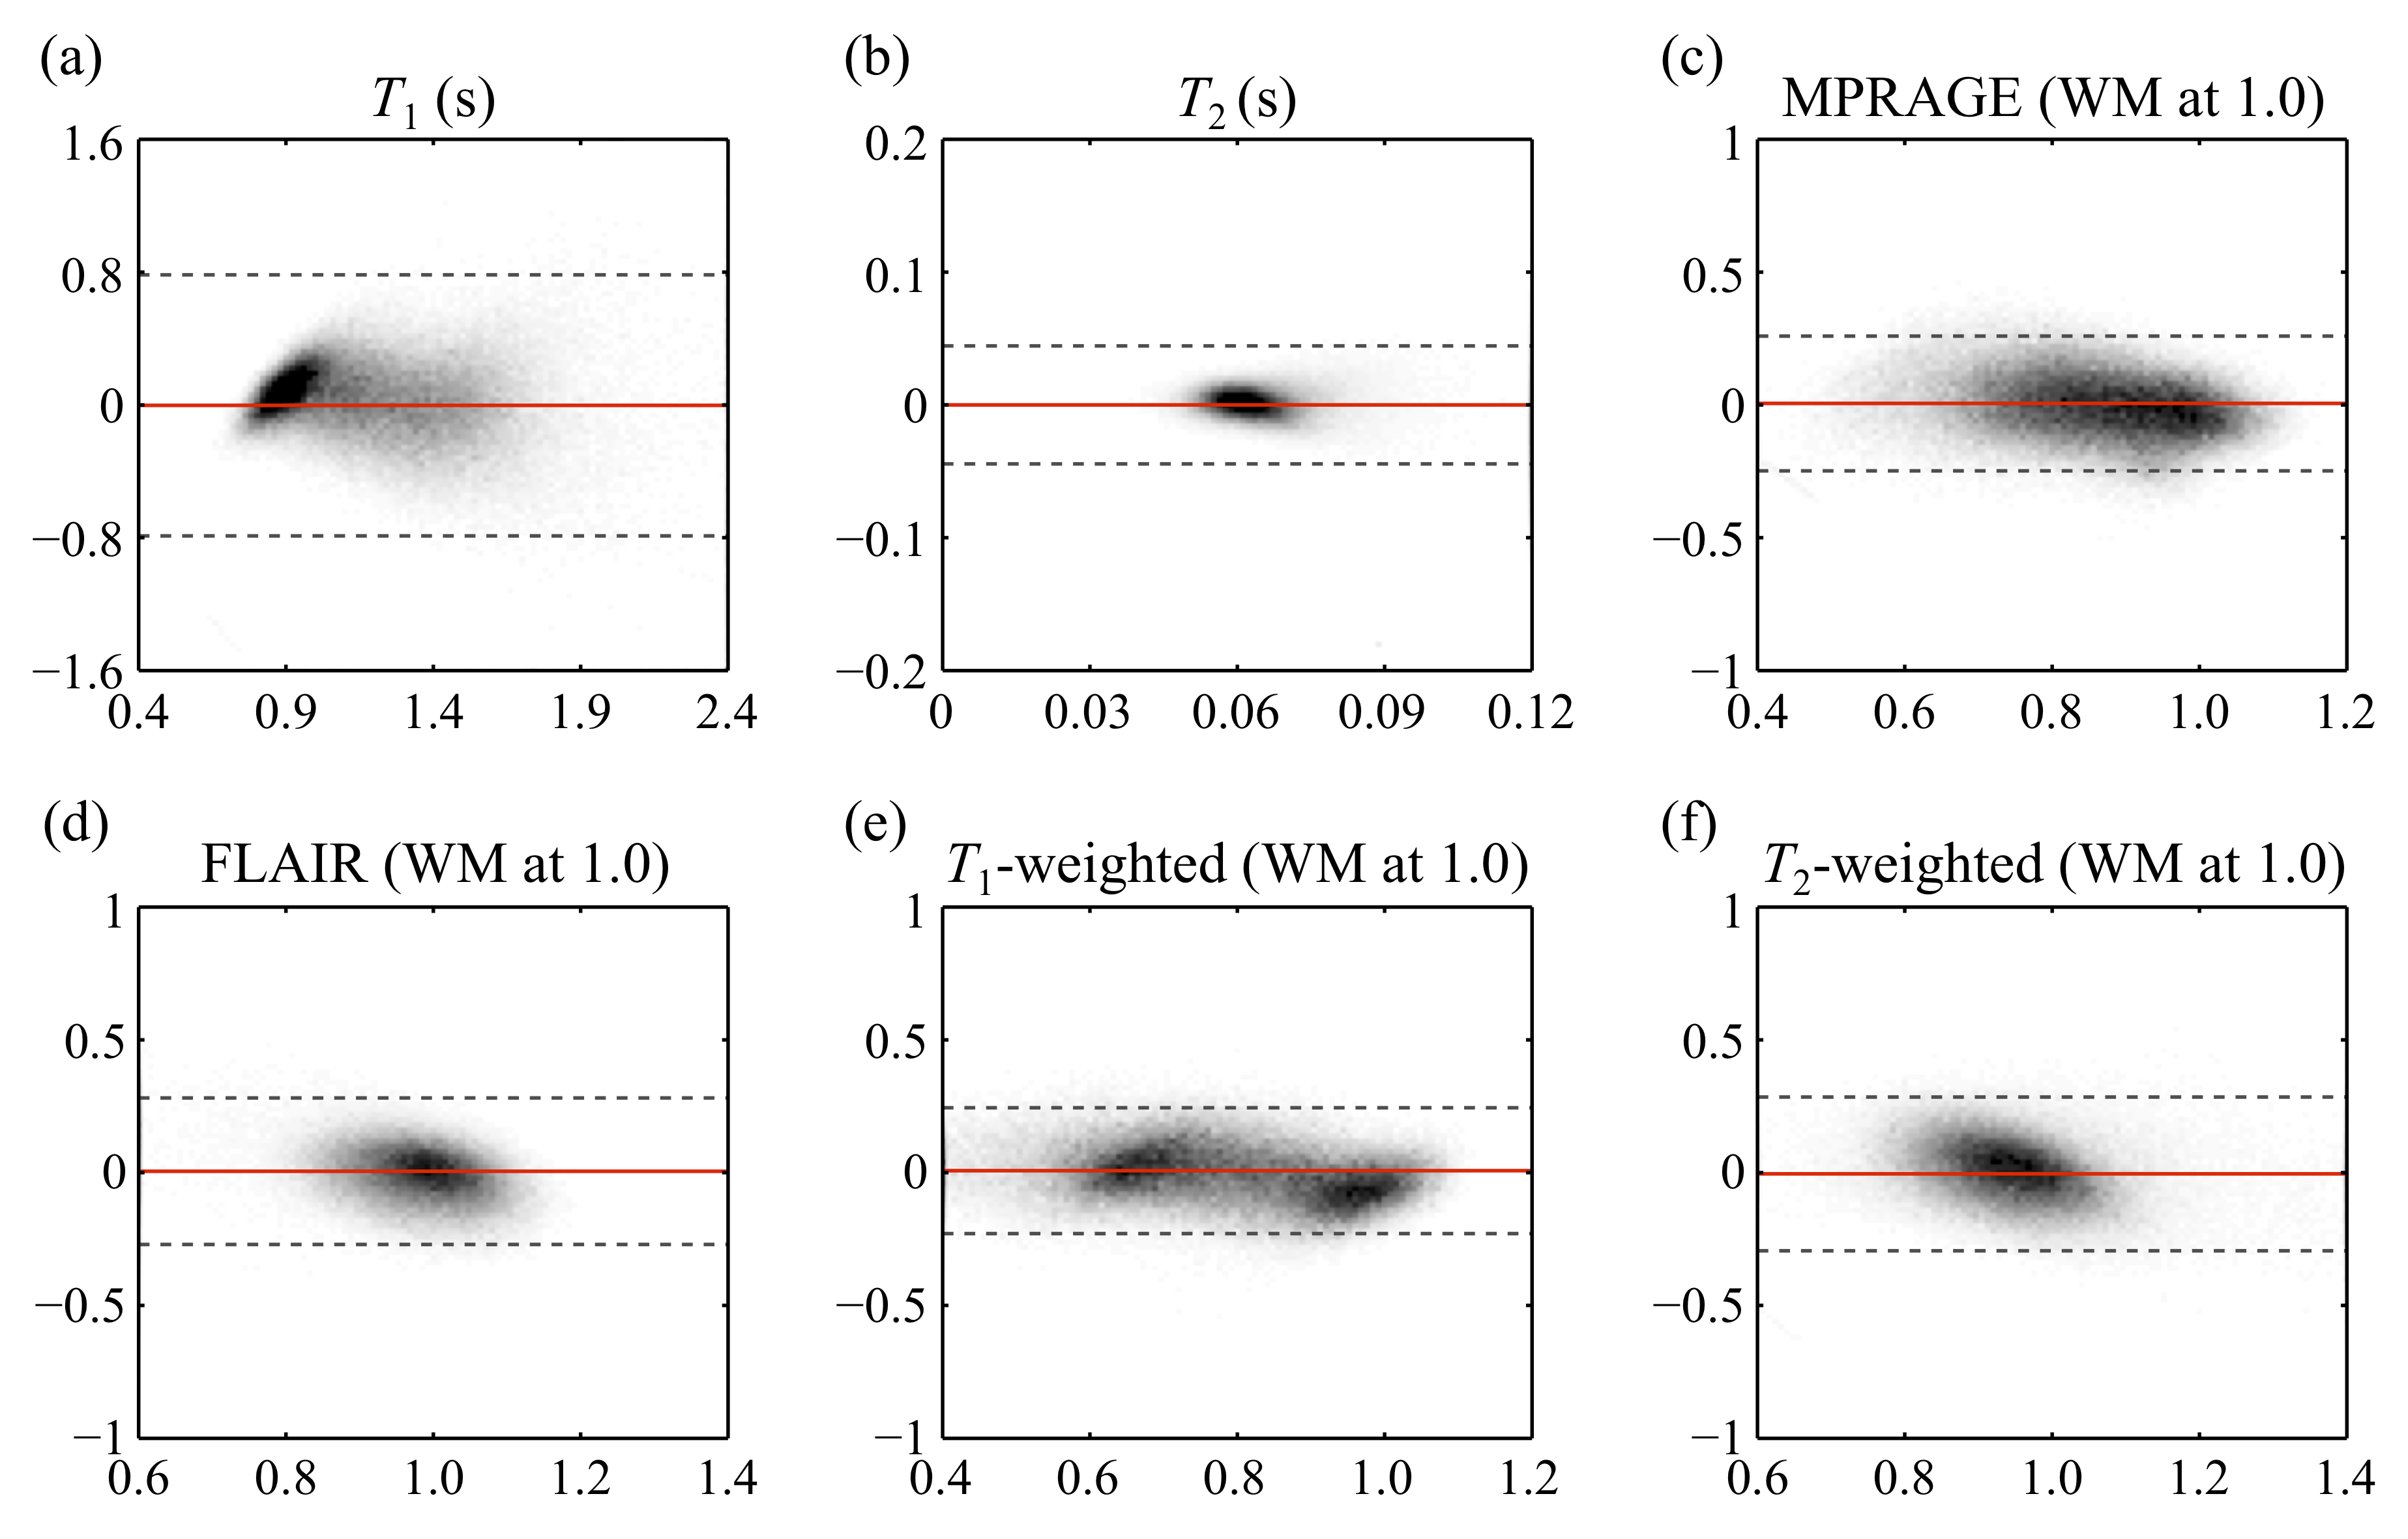
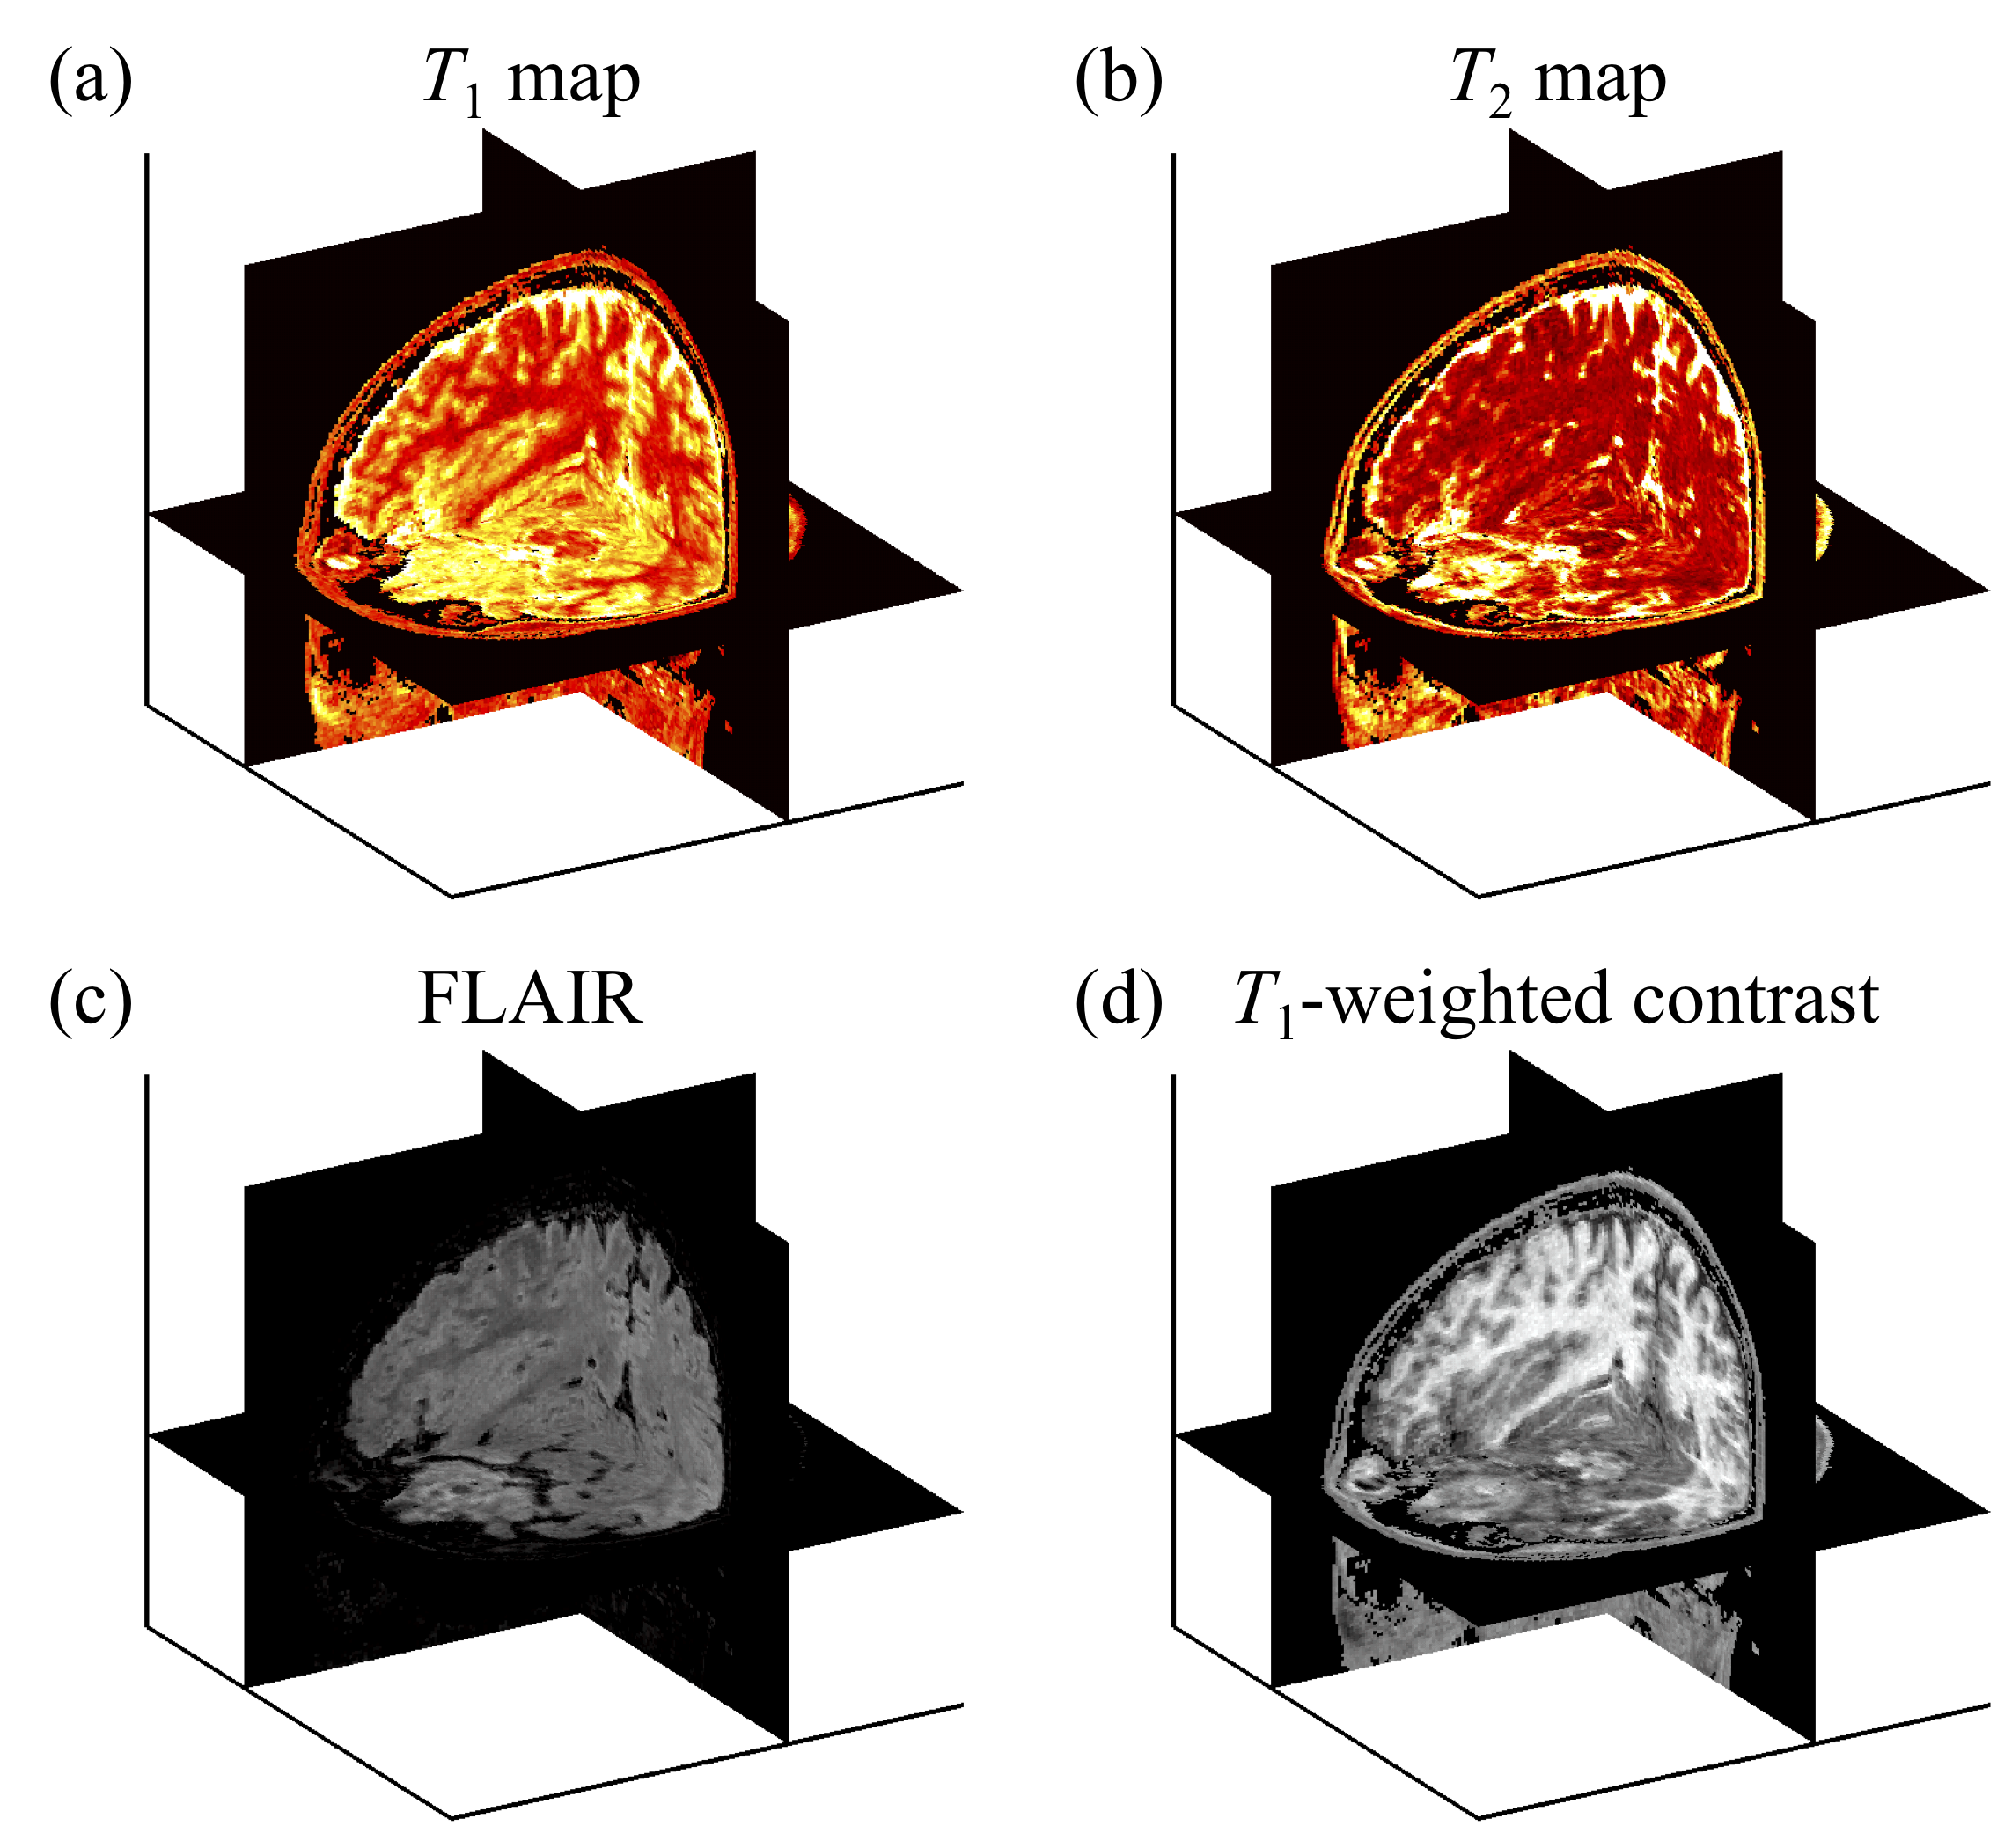
Figure 3 shows side-by-side comparisons between the reference (left) and predicted (right) results for one subject. In fig. 4, predicted parameters from all subjects were compared, on a pixel-by-pixel basis, with reference values (the bias and the width of the 95% confidence intervals for T1/T2/MPRAGE/FLAIR/T1W/T2W were 0.002/0.000/-0.006/-0.005/-0.007/0.005 and 1.57/0.08/0.51/0.55/0.47/0.57, respectively. Figure 5 show the full 3D predictions that emulate T1 map, T2 map, FLAIR, and T1-weighted contrasts, all from contrast-translated 3D MPME data acquired in less than 7min with minimal acceleration.Discussion and Conclusion
All maps and contrast translations were calculated from a single 3D full-brain MPME acquisition and as such, all of these contrasts are by nature spatially registered to each other. Ultimately, contrasts from a single MPME acquisition might be translated by a fully-trained NN into most of the contrasts that are currently individually acquired in neuro protocols, with great potential reductions in total scan time. Even though the number of subjects was small (eight), data from about 90,000 separate voxels were available to train each NN employed here for contrast translation, a number arguably large enough for the type of NN architecture employed here. Although not explicitly shown here the proposed method can capture B1+, in the sense that T1 measurements were not adversely affected by spatial B1+ variations. In conclusion, data from a roughly 7min 3D full-brain MPME scan could be translated into useful qualitative and quantitative contrasts with clinically-relevant resolution (1.2mm isotropic).Acknowledgements
Financial support from grants NIH P41EB015898, R21EB019500 and R03EB025546 is acknowledged.References
1. Deoni SC, Rutt BK, Peters TM. Rapid combined T1 and T2 mapping using gradient recalled acquisition in the steady state. Magn Reson Med. 2003;49:515-526.
2. Ma D, Gulani V, Seiberlich N, Liu K, Sunshine JL, Duerk JL, Griswold MA. Magnetic resonance fingerprinting. Nature 2013;495:187-192.
3. Heule R, Ganter C, Bieri O. Triple echo steady-state (TESS) relaxometry. Magn Reson Med 2014;71:230-237.
4. Cheng CC, Preiswerk F, Hoge WS, Kuo TH, Madore B. Multi-Pathway Multi-Echo (MPME) imaging: all main MR parameters mapped based on a single 3D scan. Magn Reson Med, Epub ahead of print Oct 2018.
5. Helms, G, Dathe, H, Dechent P. Quantitative FLASH MRI at 3T using a rational approximation of the Ernst equation. Magn Reson Med 2008;59(3):667-672.
6. The Berkeley Advanced Reconstruction Toolbox (BART). https://mrirecon.github.io/bart. Accessed September 10, 2018.
7. Kingma DP, Ba J. Adam: A Method for Stochastic Optimization. Proceedings of the 3rd International Conference on Learning Representations (ICLR), San Diago, 2014.
Figures