4554
Rapid, simultaneous non-synthetic multi-contrast and quantitative imaging using Tailored MR Fingerprinting (TMRF)1MR Research Center, Columbia University, New York, NY, United States, 2Radiology, Columbia University, New York, NY, United States, 3GE Healthcare, New York, NY, United States
Synopsis
The goal of this work was to rapidly acquire non-synthetic multi-contrast and quantitative images simultaneously, through tailoring the MR fingerprinting acquisition schedule in contrast blocks. TMRF providing for five contrasts was designed, simulated and demonstrated on four healthy volunteer brain scans. The acquisition times for MRF and TMRF were 5:11 and 4:41 (min: sec) respectively. The spatio-temporal profiles of T1, T2, PD, water-fat and flow contrasts were reconstructed block-wise along with relaxometric maps. Comparatively, TMRF images showed higher mean to standard deviation ratios for the four volunteers over the contrast blocks for PD and T2 while maintaining similarity of relaxometric maps.
Purpose
To rapidly acquire non-synthetic multi-contrast and quantitative images simultaneously through tailoring MR Fingerprinting [1] acquisition schedule in blocks of contrastMethods
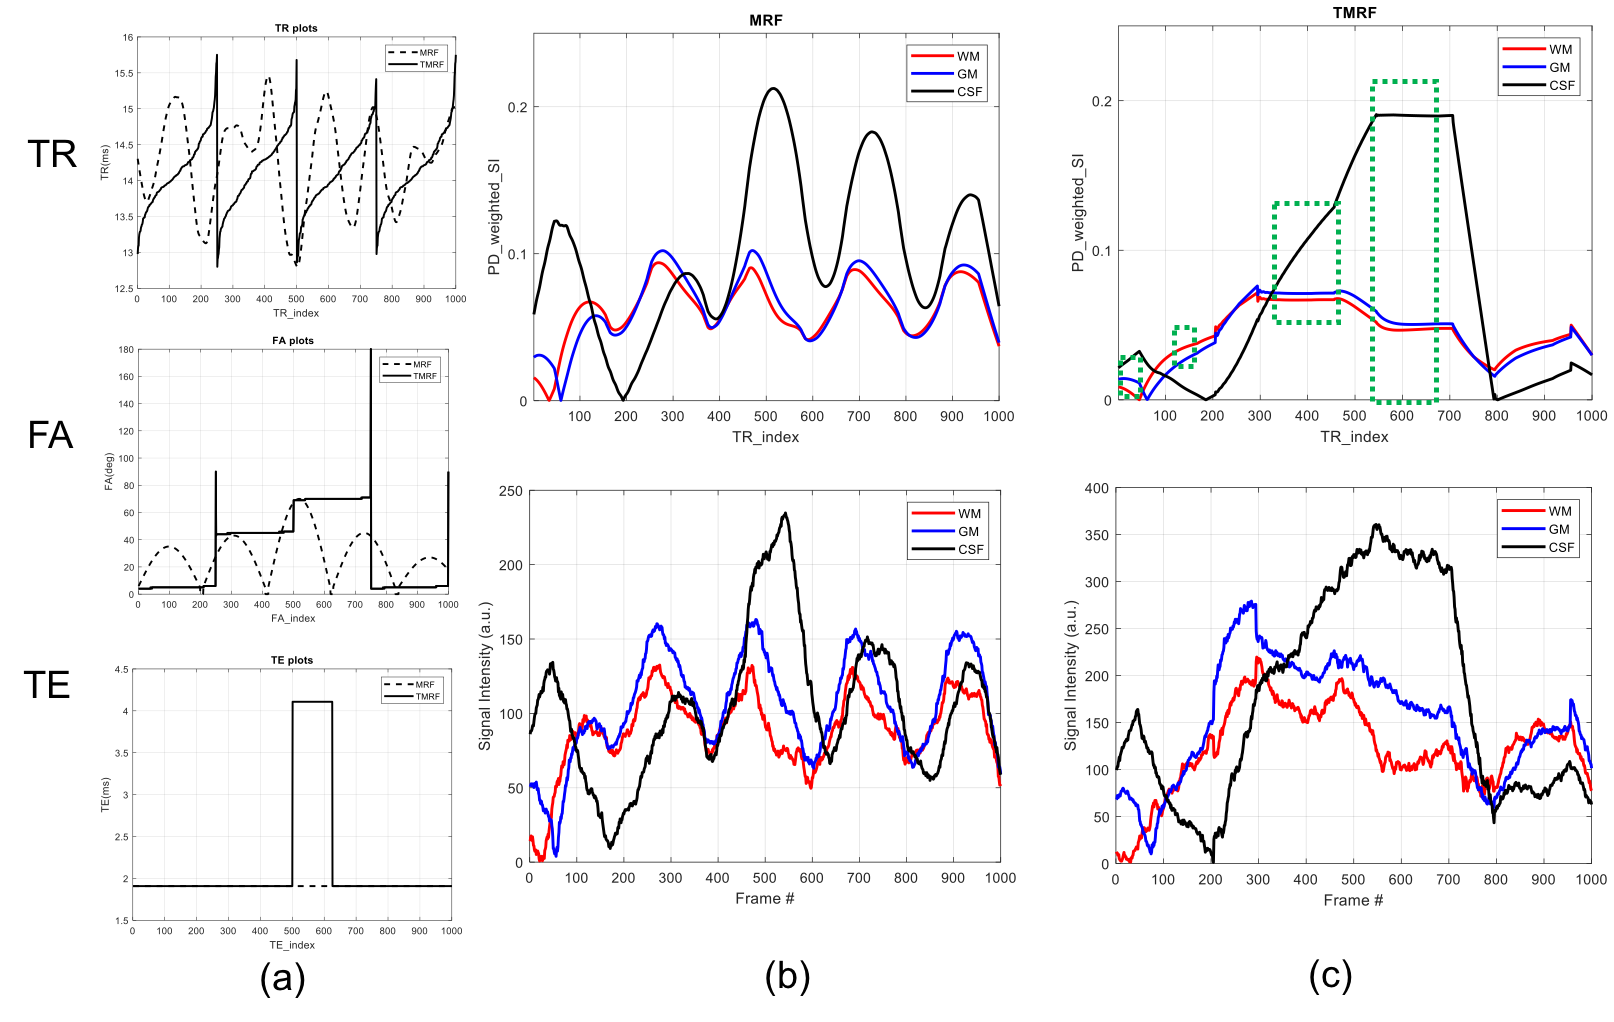
The Tailored MRF (TMRF) schedule was designed with 1000 Flip Angle (FA) and TR combinations, 89 shot spiral readout with 608 points. These combinations were divided into four blocks shown in figure 1a. The TR values in each block were generated based on adding a Gaussian random noise to the minimum TR (12.8ms) and then sorting the values in ascending order. Correspondingly, base FAs for the four blocks were chosen to be 50, 450, 700, 50 respectively, with Gaussian noise and sorting. This was chosen to provides PD, T1, and T2 contrasts. The inclusion of a 900 pulse allowed the generation of regions with constant magnetization profiles (figure 1(c), green blocks). The values of TE was chosen to be the minimum (1.908ms) except in time points between 500 and 625 (Dixon block, schedules in figure 1(a)). In this block, the TE was increased by 2.2ms to allow for an out of phase acquisition. Extended Phase Graph simulations were performed to generate dictionaries (figure 1(b,c)). These entries were then sliding window reconstructed using implementations from ref. [2]. In vivo studies: MRF, TMRF studies were performed on 4 normal volunteers as part of an IRB approved study on a 3T GE 750w. Both methods involved an axial, 20 slice brain coverage with a slice thickness of 5mm and 1mm in-plane resolution. The acquisition times for both methods were 5:11 and 4:41 (min:sec) respectively. Data from both methods were sliding window reconstructed and matched with the dictionary to yield parametric maps. Multiple contrast images from green blocks shown in figure 1(c) were visualized over time and space. In the T2 block, 125 images were used as in phase images and processed with the Dixon block to yield uncorrected water, fat images, and a fat fraction map. The ratios of mean to standard deviation over five temporal frames for each block for both methods were calculated to indicate signal-to-noise strength and temporal constancy measures.Results and Discussion
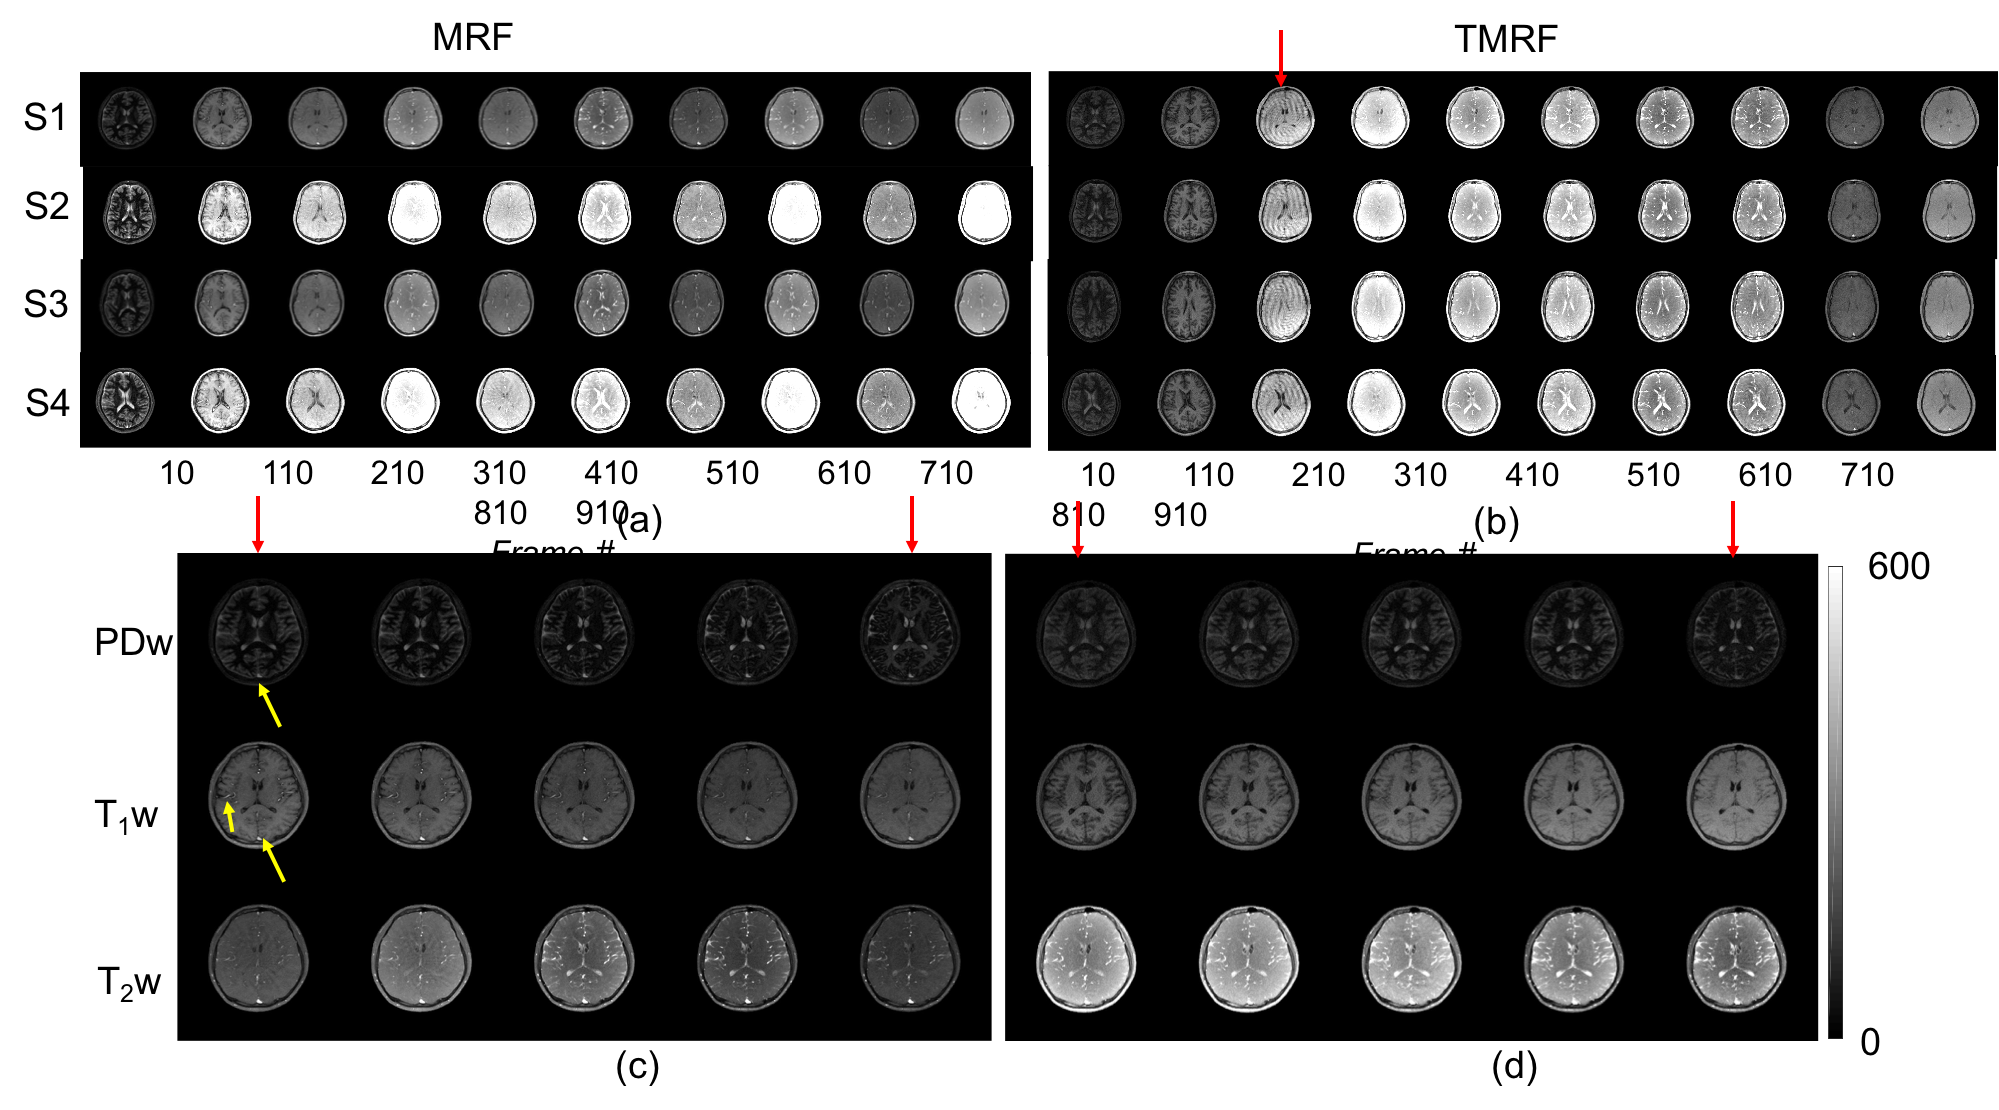
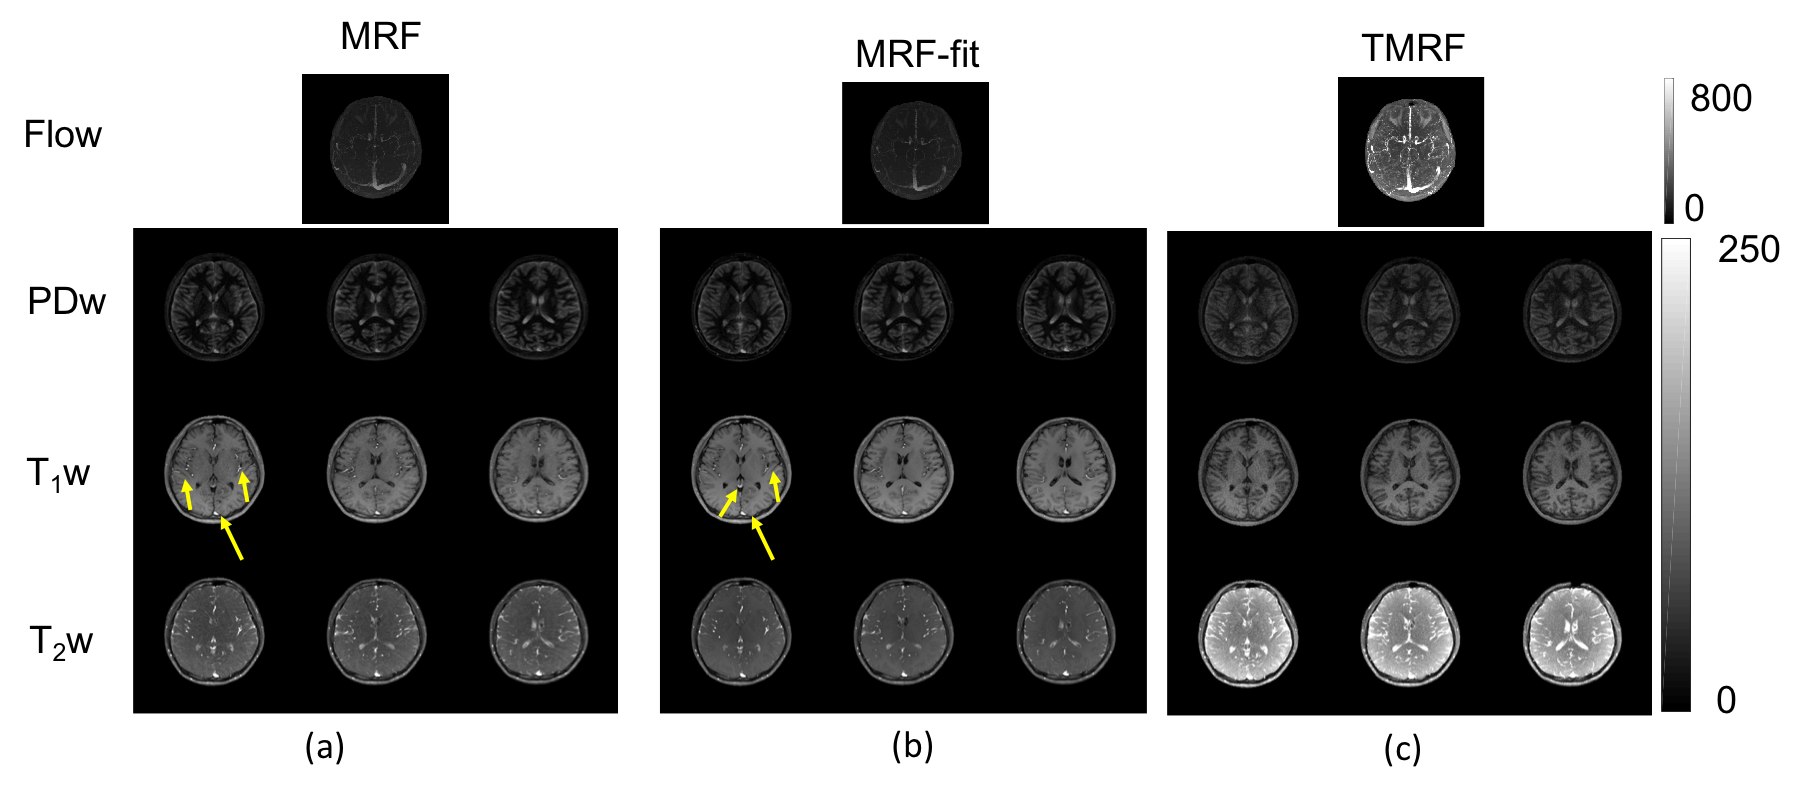
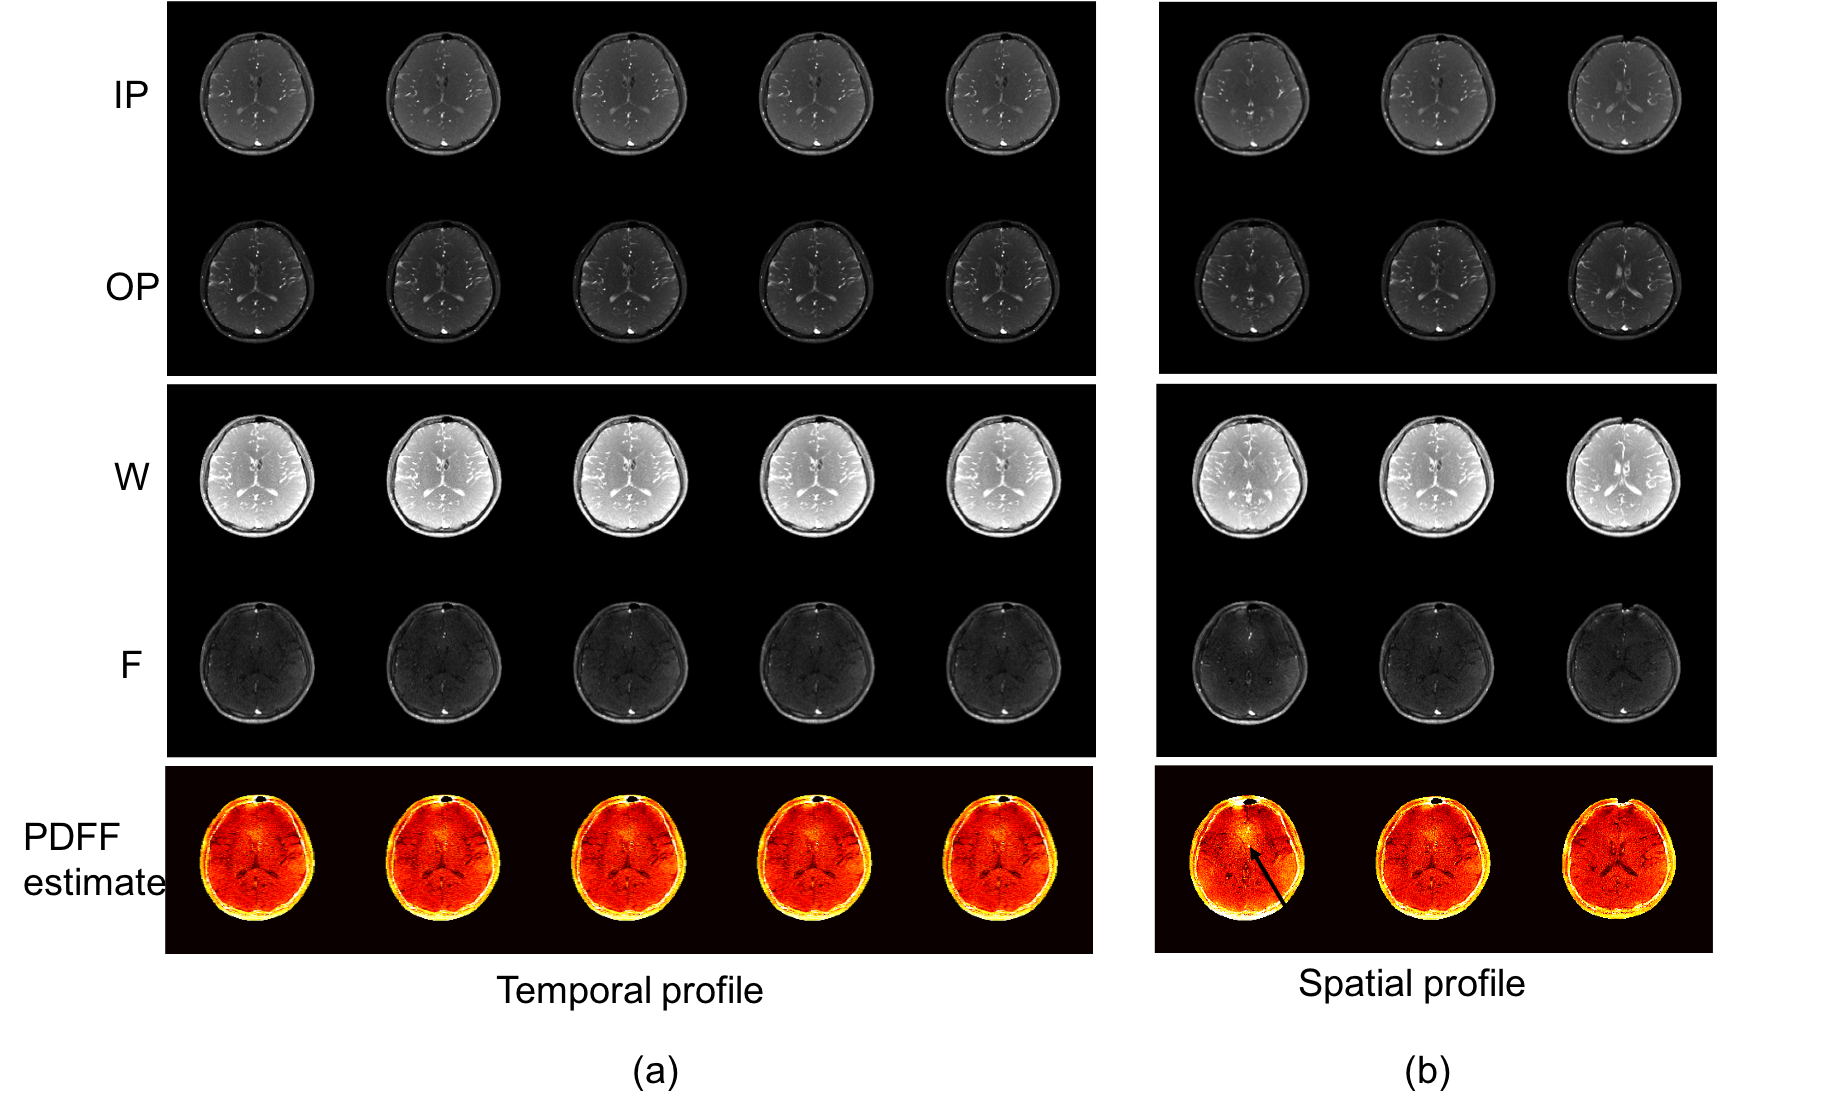
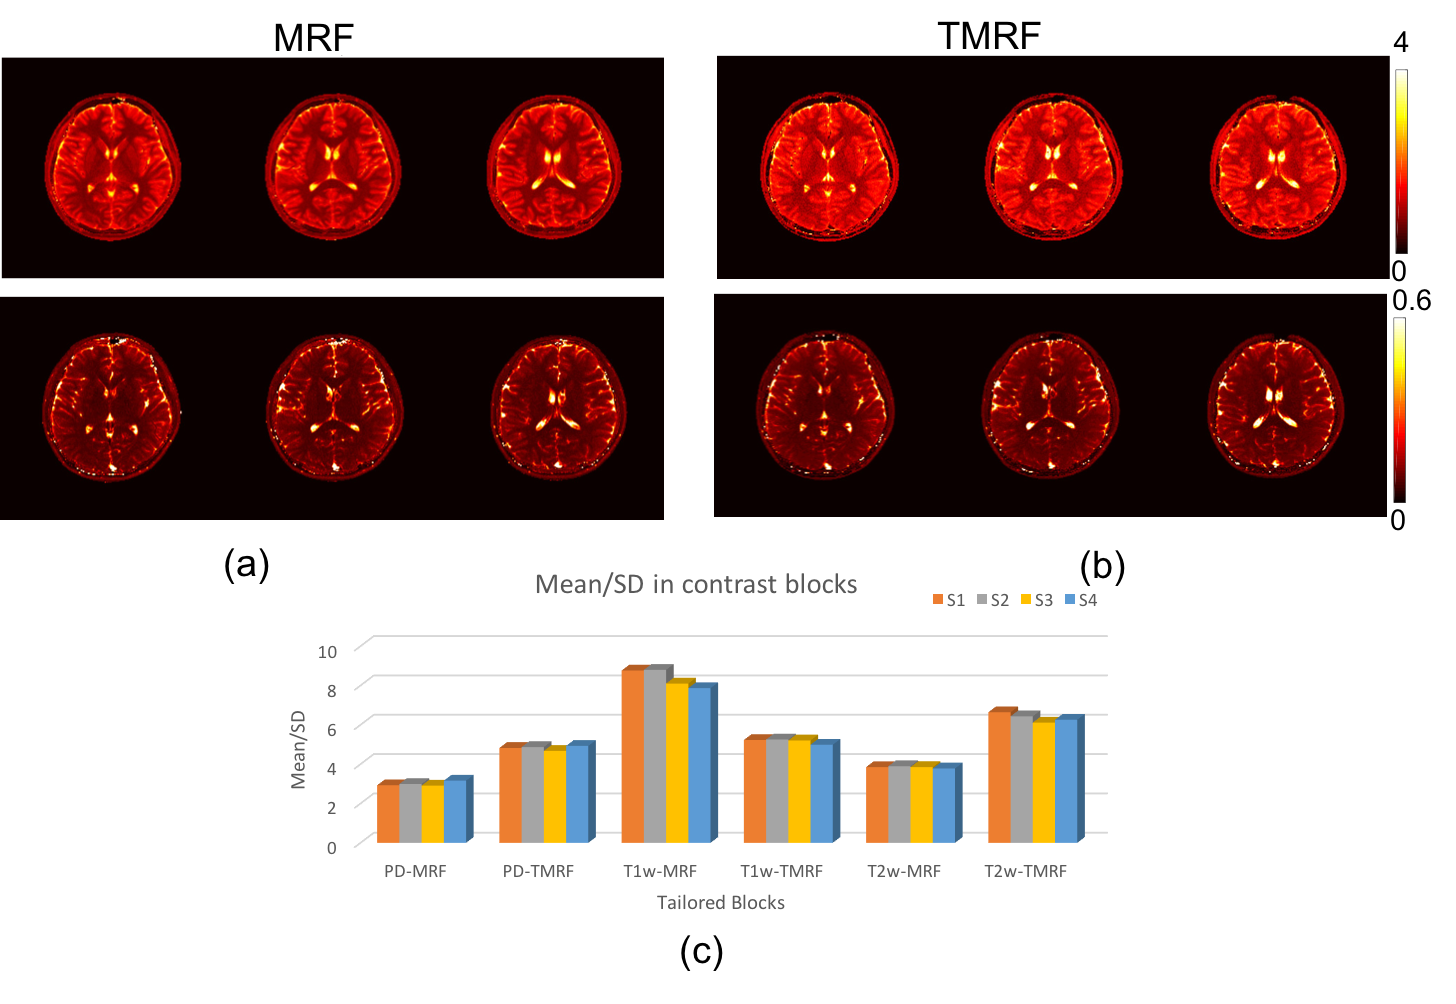
Figure 1(b,c) shows that the TMRF signal evolutions (simulation and voxel plots from representative data for the three tissue matters) have blocks of slowly varying magnitude compared to MRF which allow for meaningful sliding window reconstructions. Figure 2(a,b) shows that the MRF signal strengths relatively varied more in MRF as compared to TMRF which showed a similar signal strength across four volunteers. The red arrow in figure 2(b) indicates the effect of the 900 pulse at time point 250 on the sliding window reconstruction. Figure 2(c,d) show that the variation in contrast and signal shown in MRF is higher compared to TMRF in the cases of PD and T2 (shown by the red arrows). The signal strength of PD in the case of TMRF is lesser than MRF but has better temporal constancy. The yellow arrows in figure 2(c) indicate the flow artifacts seen in MRF which are suppressed in TMRF. This is due to the choice of the flip angle in the T1 block that allows for suppression of signals from liquids compared to MRF. Subsequently, the growth of CSF and other liquid-like matters is allowed in TMRF providing a maximum intensity projection image depicting flow. In figure 3, it can be seen that the flow effects are captured well by TMRF. It also shows the results for the three different contrasts over three slices for MRF, MRF generated synthetic data and TMRF. It can be observed that TMRF provides for better T1 contrast without flow artifacts (yellow arrows) as compared to the other two. However, it has relatively lower signal strength. This is indicated by the simulation and voxel results in figure 1. The PD and T2 images from TMRF suppress flow artifacts compared to MRF. Figure 4 depicts the spatio-temporal profiles of B0 phase uncorrected water-fat imaging with TMRF. The water only images can be used as an estimate of fat-suppressed images. The fat fraction map could be relevant in other anatomies. This additional water-fat imaging block demonstrates the flexibility of TMRF. Figure 5 shows that both methods yield similar relaxometric maps and conform to previously published literature. Figures 5c, 2, 3 indicate that TMRF provides better mean to standard deviation ratio for PD, and T2. TMRF has increased T1 contrast but lower mean values (figures 1(b,c), 2, 3).Conclusion
We have demonstrated a 5-minute sequence that simultaneously provides non-synthetic multi-contrast images (including water-fat) and relaxometric parametric maps.Acknowledgements
No acknowledgement found.References
1. Ma, D., Gulani, V., Seiberlich, N., Liu, K., Sunshine, J.L., Duerk, J.L. and Griswold, M.A., 2013. Magnetic resonance fingerprinting. Nature, 495(7440), p.187.
2. Gomez PA, Molina-Romero M, Buonincontri G, Menze BH, Menzel MI. Simultaneous Magnetic Resonance Angiography and Multiparametric Mapping in the Transient-state. In: Proceedings of the 26th Annual Meeting of ISMRM. Paris; 2018:63.
Figures