4552
Magnetic Resonance Fingerprinting with Pure Quadratic RF Phase1Biomedical Engineering, Case Western Reserve University, Cleveland, OH, United States, 2Radiology, Case Western Reserve University, Cleveland, OH, United States
Synopsis
Previous work has shown that Magnetic Resonance Fingerprinting with quadratic RF phase (qRF-MRF) can be used to simultaneously quantify off-resonance, T1, T2 and T2*. This method employed a mix of bSSFP and qRF pulse sequence block segments for reliable tissue property quantification. However, the incorporation of bSSFP type acquisition schemes resulted in null-band artifacts near bSSFP signal voids. Here, we present a bSSFP-free pure qRF-MRF method with elimination of null-band artifacts, and explore its potential for tissue property mapping with reduced acquisition time.
Introduction
Susceptibility weighted imaging (SWI), along with conventional T1- and T2- weighted imaging, is a frequently obtained component of many clinical protocols, due to its unique sensitivity to particular physiology, such as blood oxygenation level, and parenchymal iron and calcium concentration. Many conditions can be diagnosed and monitored based on the information obtained. These include hemorrhagic strokes and pneumocephalus in the acute setting, and aging, amyloidosis, Huntington’s, and Alzheimer’s diseases in the chronic setting. Subtle or global disease may be aided by a rapid quantitative MR methods capable of measuring T2* simultaneously with other tissue parameters as a more sensitive and quantitative metric for SWI sensitive pathologies.
Magnetic Resonance Fingerprinting with quadratic RF phase (qRF-MRF) method1 has been proposed for the simultaneous quantitative mapping of off-resonance (ΔB0), T1, T2 and T2* tissue properties. However, this method shared some of the same limitations as the initial bSSFP-MRF method2, due to use of an initial bSSFP-MRF acquisition for the initial 30% of frames. Here we propose an improved qRF-MRF (pqRF-MRF) method for 2D null-band-free tissue property mapping, compare its accuracy in vivo in volunteers against established methods, and explore its potential for reduced acquisition time.
Methods
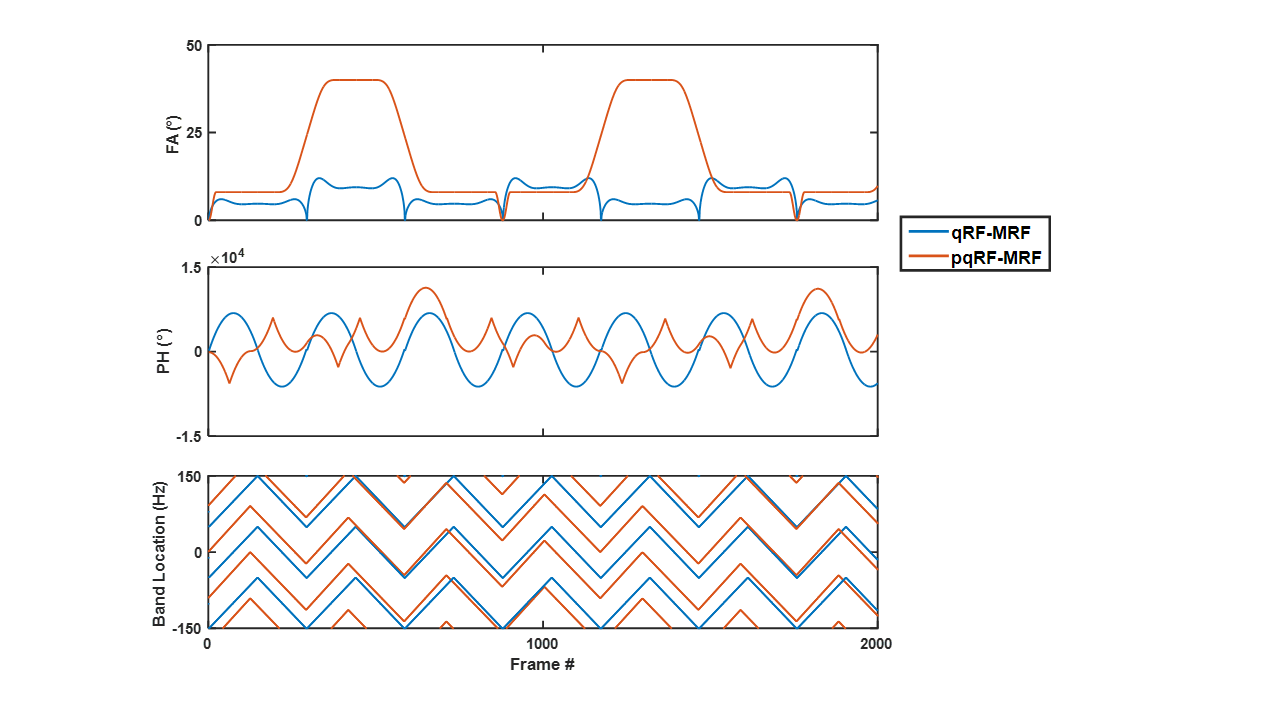
Data were collected with IRB approval and prior written consent. The pqRF-MRF pulse sequence parameters, consisting of the flip angle (FA) and RF excitation phase (PH) used per acquired imaging frame are shown in Fig. 1, alongside previous qRF-MRF pulse sequence parameters. A constant 11 ms TR was used throughout the pqRF-MRF method. Single-shot spirals3 were used to acquire a highly undersampled 256x256 image during each frame with 1.2 x 1.2 mm2 in-plane resolution and 5 mm slice thickness. A total of 3516 frames were acquired in 38.7 s per imaging slice.
The template matching method used to extract tissue property measurements from undersampled time frame data has been described previously1. Briefly, Bloch simulation was used to generate a dictionary of signal time courses composed of different combinations of T1, T2, and ΔB0 values spanning the range of expected physiologic values. T2* was added to the dictionary by convolving Lorentzian lineshapes of varying fullwidth-at-halfmax (Γ) values along the ΔB0 dimension of the dictionary. The T2* value associated with each dictionary entry was then calculated as: 1/T2*=1/T2+πΓ. Quantified parameter values were extracted from the dictionary entry with the highest computed l2-normalized inner product with each measured signal course.
pqRF-MRF method was tested in volunteers, and compared against both qRF-MRF and FISP-MRF4 methods. To accommodate for differences in dictionary resolution between methods, a quadratic fit interpolation was to matching results of both methods. pqRF-MRF was also assessed for acquisition time reduction potential comparing tissue property maps using a subset of acquired frames compared against the tissue property maps achieved using all acquired frames. All comparisons were performed using the concordance correlation coefficient (CCC)5.
Results
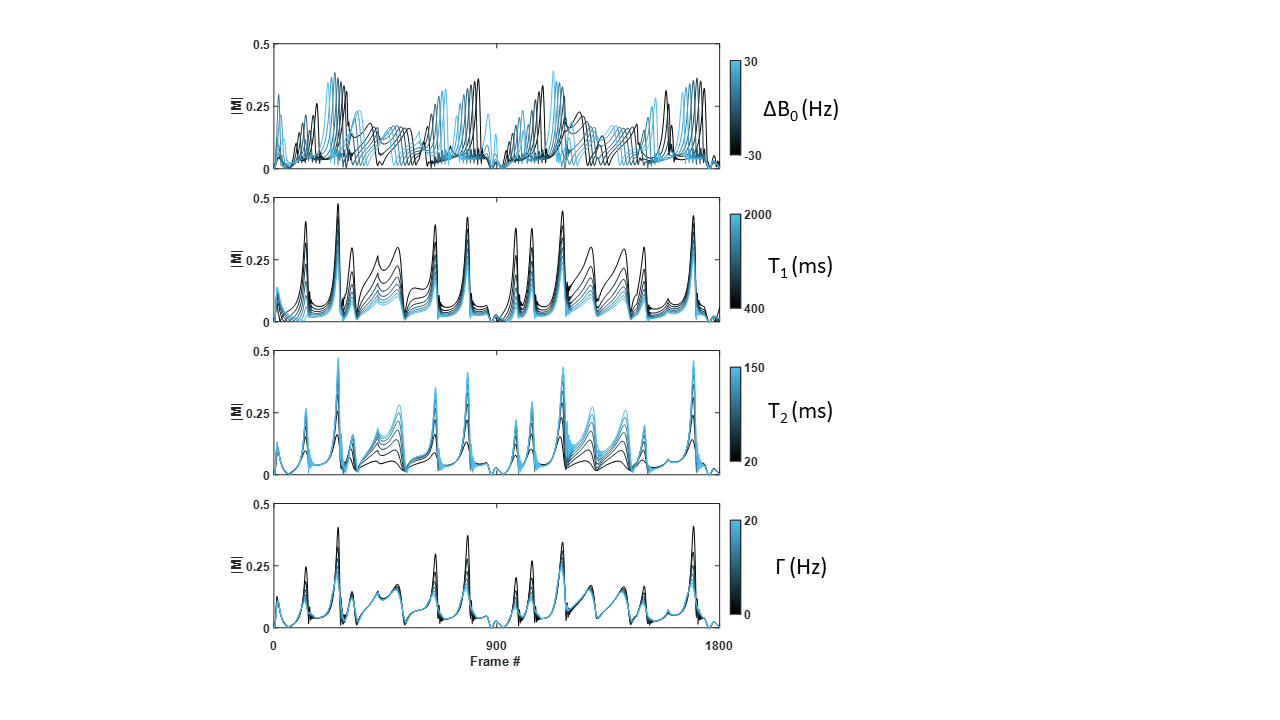
Signal evolution uniqueness with respect to each of the four tissue properties quantified through the matching process in the pqRF-MRF method can be seen in Fig. 2.
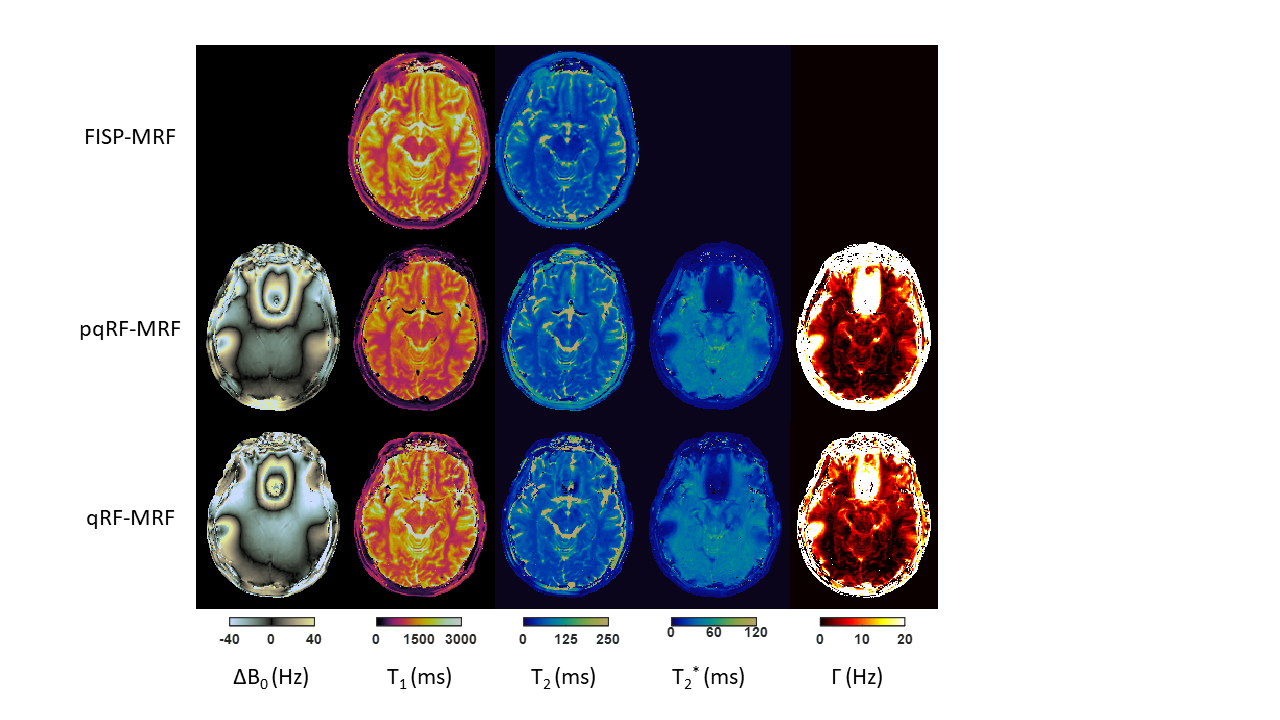
Maps obtained using FISP-MRF, pqRF-MRF, and qRF-MRF are shown in Fig. 3. Banding artifacts are visible in qRF-MRF maps, where the qRF-MRF matched near ±40 Hz ΔB0, such as in the frontal lobe region. Such artifacts are not present in pqRF-MRF or FISP-MRF methods. CCC comparisons between FISP-MRF and pqRF-MRF were 0.90 and 0.70 for T1 and T2 tissue property maps, respectively. CCC comparison between qRF-MRF and pqRF-MRF methods were 0.90, 0.79, 0.96, and 0.77 for T1, T2, T2*, and Γ properties, respectively.
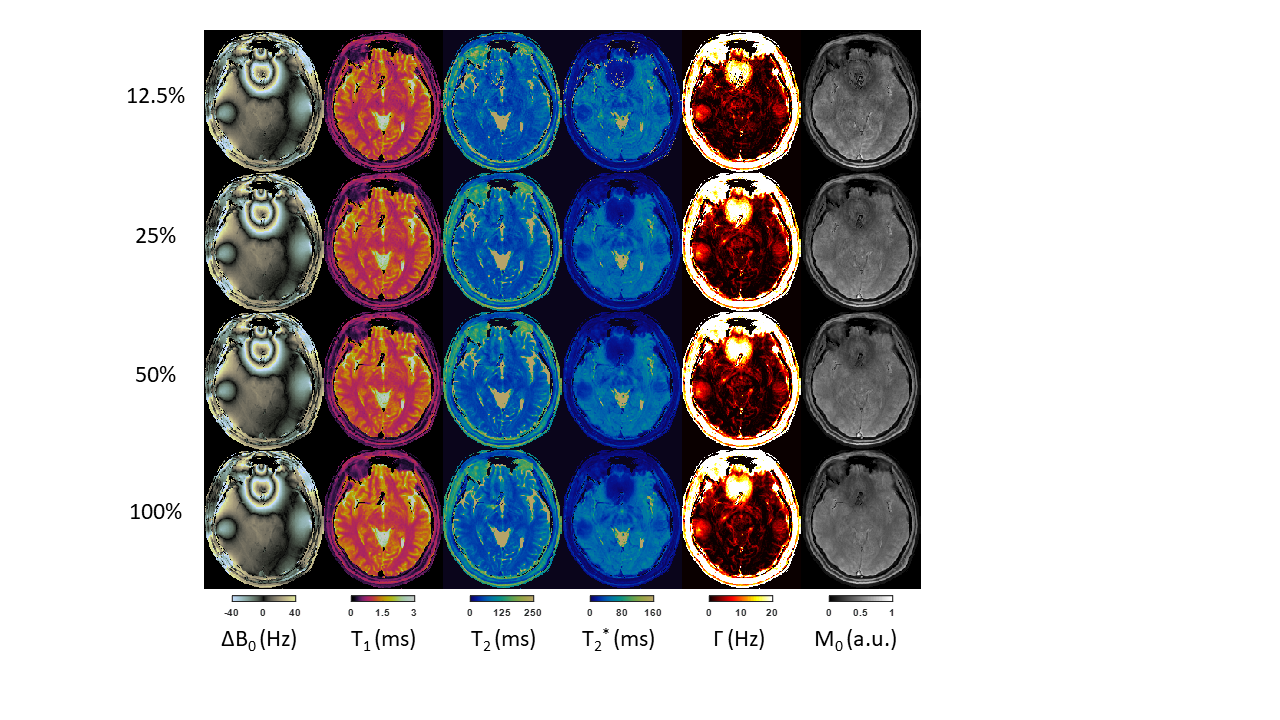
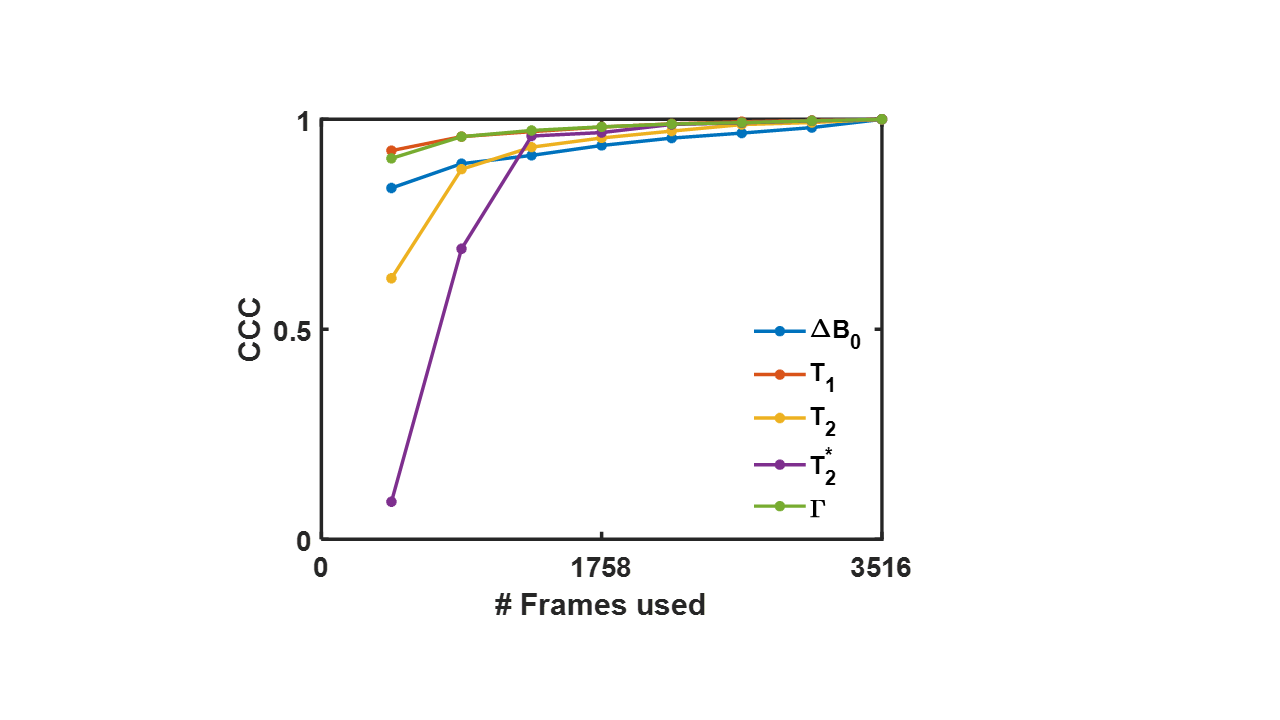
Example maps obtained using dictionary matching of only a subset of acquired frames of the pqRF-MRF are shown in Fig. 4. Complete CCC comparisons between each parameter measured using a specified subset of frames against the complete set of frames is shown in Fig. 5.
Discussion/Conclusion
The proposed pqRF-MRF method was able to obtain comparable tissue property maps, but without banding artifacts exhibited by the previous qRF-MRF method. Furthermore, pqRF-MRF method measured T1 and T2 property maps showed fair agreement with FISP-MRF methods. While the entire acquisition required under 40 s per slice to acquire, the results of this study also suggested only the first ~15 s of data were necessary for comparable results.Acknowledgements
The authors would like to acknowledge funding from Siemens Healthcare and NIH grants F30‐HL124894, TL1‐TR000441, T32‐EB007509, R01-EB016728, R01-EB017219 and R01-EB23704. This work made use of the High Performance Computing Resource in the Core Facility for Advanced Research Computing at Case Western Reserve University.References
1. Wang C, Coppo S, Mehta B, et al. Magnetic resonance fingerprinting with quadratic RF phase for measurement of T2* simultaneously with δf ,T1, and T2. Magn Reson Med, 2018, https://doi.org/10.1002/mrm.27543
2. Ma D, Gulani V, Seiberlich N, et al. Magnetic resonance fingerprinting. Nature 2013;495: 187–192.
3. Jin H. Lee, et al., "Fast 3D imaging using variable-density spiral trajectories with applications to limb perfusion", MRM 2003; 50(6):1276.
4. Jiang Y, Ma D, Seiberlich N, Gulani V, Griswold M a. MR fingerprinting using fast imaging with steady state precession (FISP) with spiral readout. Magn Reson Med. 2015;74(6):1621-1631.
5. Lin LI. A concordance correlation coefficient to evaluate reproducibility. Biometrics. 1989;45(1):255-268.
Figures