4551
Assessment of Absolute pH Using and Magnetic Resonance Fingerprinting and a Single Dysprosium-Based MRI Contrast Agent1Radiology, Case Western Reserve University, Cleveland, OH, United States, 2Chemistry and Biochemistry, The University of Texas at Dallas, Richardson, TX, United States
Synopsis
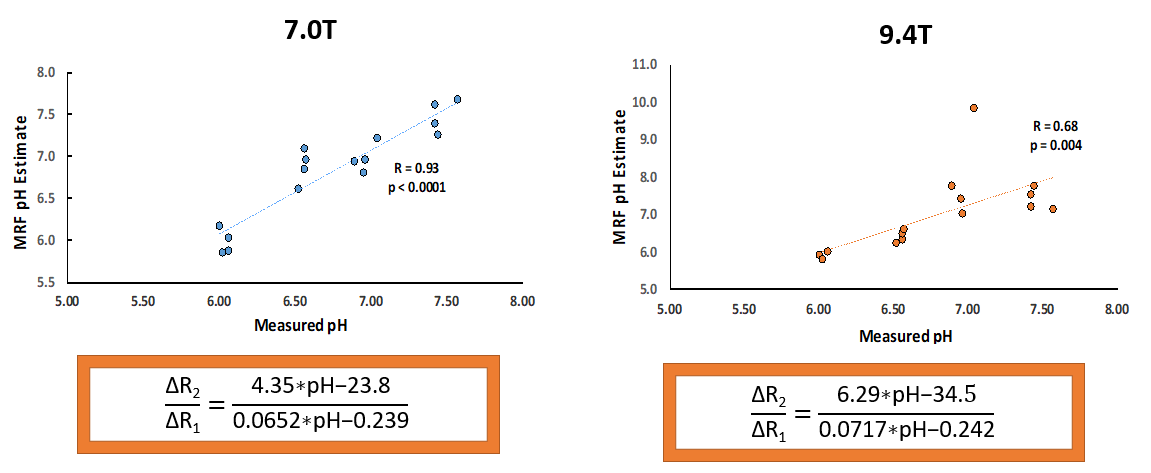
In this initial in vitro study, we used Magnetic Resonance Fingerprinting (MRF)-based T1 and T2 relaxation time maps to estimate the linear relationship between pH and relaxivity (r1 and r2) for a previously-described dysprosium (Dy) MRI contrast agent. These relaxivity estimates were then used to calculate MRF-based estimates of pH for each solution for comparison with gold-standard measurements by pH electrode at 7.0T (R = 0.93, p = <1e-6) and 9.4T (R = 0.68, p = 0.004). Results show MRF can be used in combination with a pH-sensitive paramagnetic MRI contrast agent to accurately estimate pH independent of agent concentration.
Purpose
Magnetic Resonance Fingerprinting has been shown to provide the capability to simultaneously and dynamically generate T1 and T2 relaxation time maps. This dynamic MRF approach has been shown previously to provide the capability to accurately and simultaneously detect two paramagnetic MRI contrast agents with differing magnetic relaxivities using a multi-agent relaxation model.1-2 Recently, dysprosium (Dy) MRI contrast agents have been shown to exhibit differential and approximately linear pH sensitivity in their magnetic relaxivities (r1 and r2) over a physiologic range (pH range = 6-8).3 Established linear models for the T1 and T2 relaxation times as a function of magnetic relaxivities and contrast agent concentration are shown in Equations 1a and 1b below.
1/T1 = 1/T10 + r1 * [A] Eq. 1a
1/T2 = 1/T20 + r2 * [A] Eq. 1b
If we model r1 and r2 as linear functions of pH (e.g., r1 = a*pH + b; r2 = c*pH + d), these two equations can be simplified to a single equation independent of the concentration of the contrast agent.
ΔR2/ΔR1 = r2/r1 = [c*pH + d] / [a*pH + b] Eq. 2
where ΔR2 (= 1/T2 – 1/T20) and ΔR1 (= 1/T1-1/T10) are directly measured by MRF, while a, b, c, and d are constants to be determined a priori for each contrast agent. In this initial in vitro study, we used MRF to model the relaxation characteristics of a pH-sensitive MRI contrast agent (Eq. 2) on a Bruker Biospec 7.0T and a 9.4T MRI scanner. These pH-relaxivity models were then used to compare MRF-based estimates of with gold-standard measurements obtained with a pH electrode.
Methods
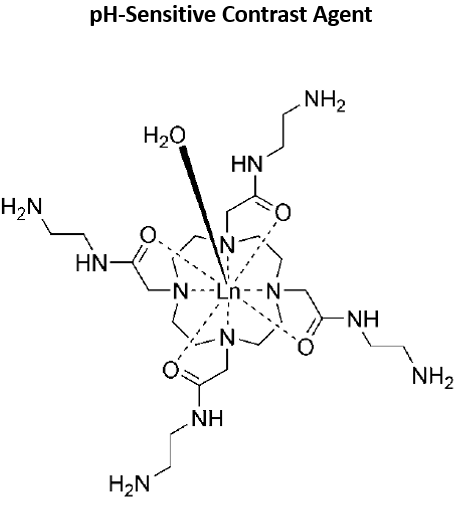
: A stock solution of a Dy-based paramagnetic MRI contrast (Figure 1) was prepared as described previously.3 Elemental analysis of the stock solution determined the concentration of Dy to be 24.1 mM. Serial dilutions were then used to prepare four sets of samples at 1mM, 2mM, 3mM, and 4mM, respectively using deionized water. For each concentration, the pH was adjusted to 6.0, 6.5, 7.0, and 7.5 nominal pH (within 0.05 pH units) using 1N NaOH or 1N HCl, respectively to generate a set of 16 total in vitro samples. A portion of each sample (500 mL) was transferred to a NMR tube for MRF scanning. An undersampled spiral MRF acquisition was used to generate T1 and T2 relaxation time maps for each sample on both 7.0T and 9.4T Bruker Biospec small animal MRI scanners. Linear-least squares regression was used to: 1) determine the relaxation rates for each pH, and 2) model the relaxivities (r1 and r2) as a function of pH to determine the constants (a,b,c,d) in Equation 2 above. A micro pH meter (D19885, Thermoscientific) was then used to measure the actual pH of each sample for comparison with the MRF results.Results
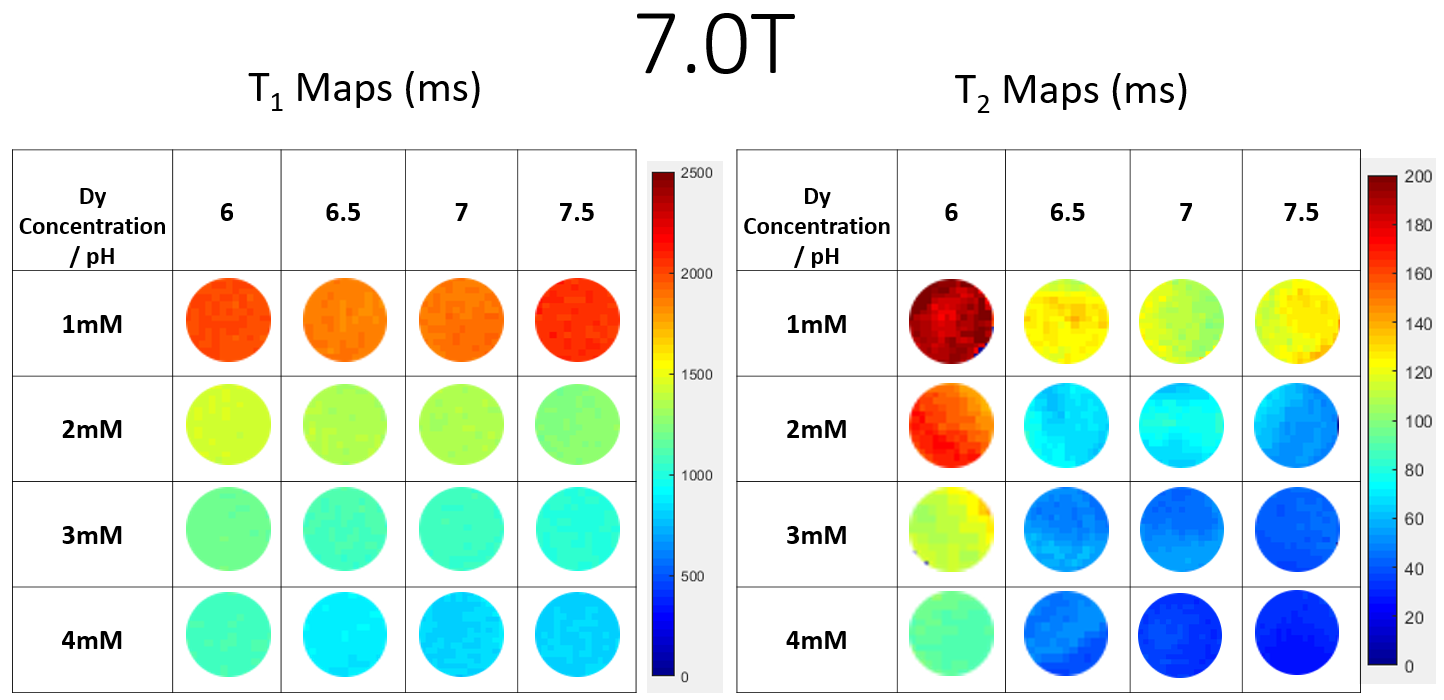
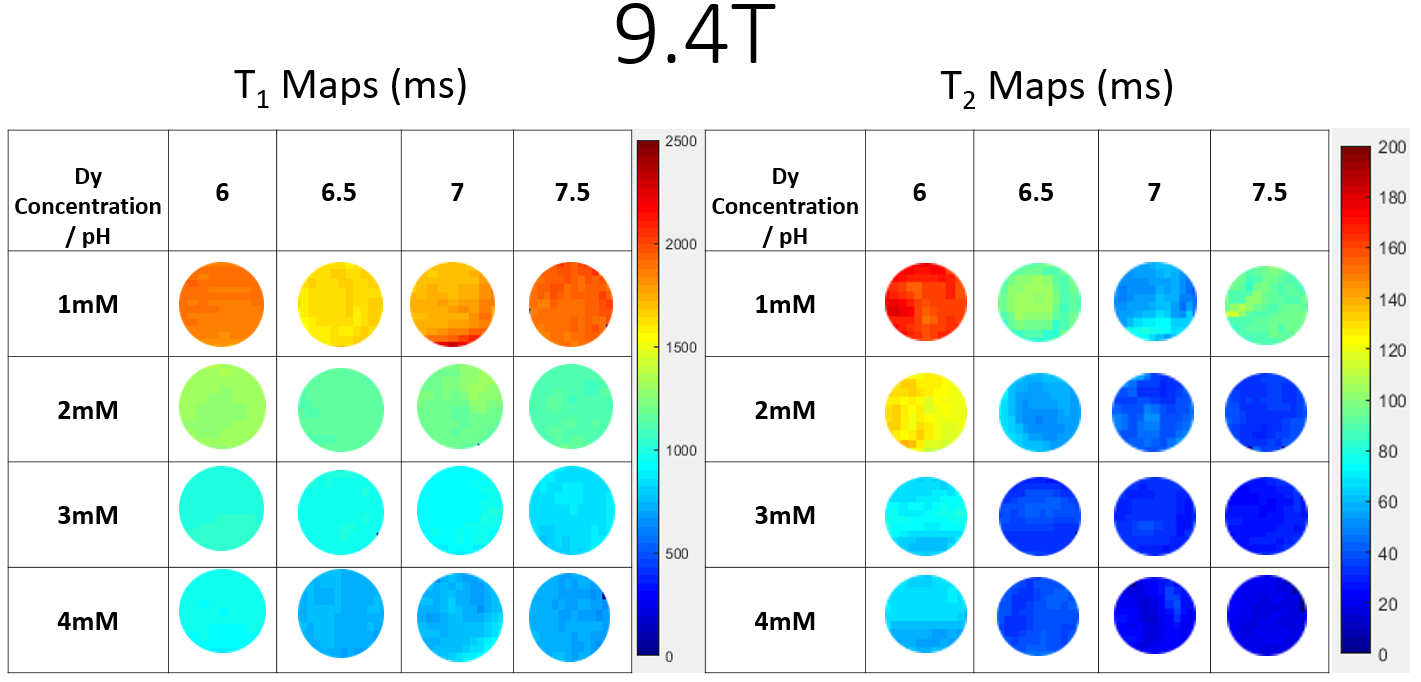
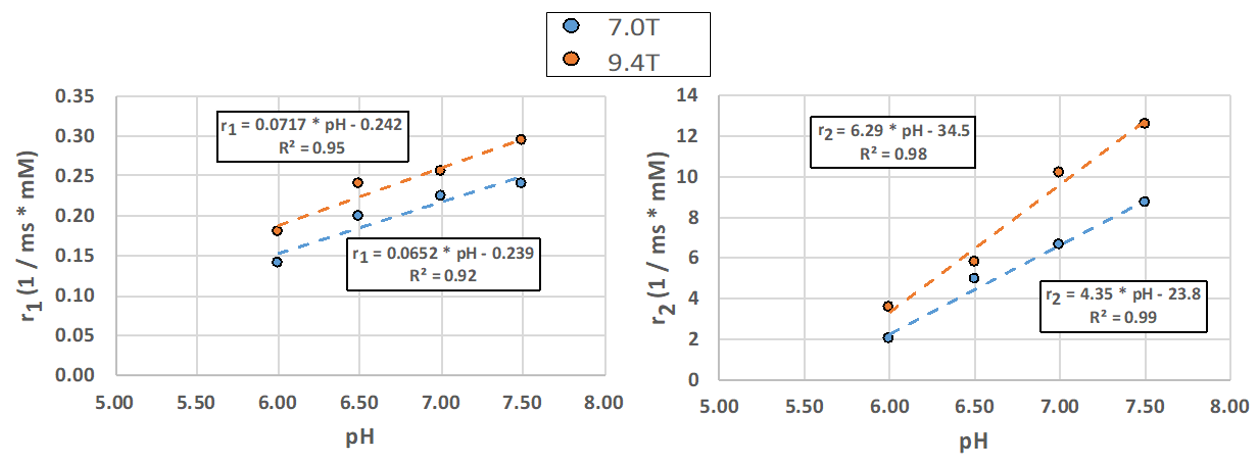
MRF-based T1 and T2 relaxation maps obtained at 7.0T and 9.4T for all 16 in vitro samples are shown in Figures 2 and 3. Note the pH sensitivity in both the T1 and T2 maps at each concentration and magnetic field strength. Scatterplots of r1 and r2 as a function pH at both 7.0T and 9.4T show that a linear model can be established for the magnetic relaxivities (Figure 4). The pH-relaxivity models were then used to calculate MRF-based estimates of each samples pH using Equation 2 (Figure 5) and resulted in significant correlations with gold-standard pH measurements at both 7.0T (R=0.93, p<1e-6) and 9.4T (R=0.68, p= 0.004).Discussion & Conclusion
Herein, we show that MRF-based T1 and T2 relaxation time maps can be used to establish linear models of relaxation rates (r1 and r2) as a function of pH. These pH-relaxivity models are independent of contrast agent concentration and result in accurate estimation of absolute pH in comparison to gold-standard pH measurements at both 7.0T and 9.4T. This approach could be used for a variety of paramagnetic pH sensors to allow accurate determination of absolute in vivo tissue pH for a variety of imaging applications.3,4Acknowledgements
This project is supported by NIH P30 CA043703 28S1 for Case Comprehensive Cancer Center .References
1. Gu Y, Wang CY, Anderson CE, Liu Y, Hu H, Johansen ML, Ma D, Jiang Y, Ramos-Estebanez C, Brady-Kalnay S, Griswold MA, Flask CA, Yu X. Fast magnetic resonance fingerprinting for dynamic contrast-enhanced studies in mice. Magn Reson Med. 2018 May 9. doi: 10.1002/mrm.27345. [Epub ahead of print] PubMed PMID: 29744935.
2. Anderson CE, Donnola SB, Jiang Y, Batesole J, Darrah R, Drumm ML, Brady-Kalnay SM, Steinmetz NF, Yu X, Griswold MA, Flask CA. Dual Contrast-Magnetic Resonance Fingerprinting (DC-MRF): A Platform for Simultaneous Quantification of Multiple MRI Contrast Agents. Scientific reports. 2017 Aug 16;7(1):8431.
3. Zhang L, Martins AF, Zhao P, Wu Y, Tircsó G, Sherry AD. Lanthanide‐Based T2ex and CEST Complexes Provide Insights into the Design of pH Sensitive MRI Agents. Angewandte Chemie. 2017 Dec 22;129(52):16853-7.
4. Luo Y, Kim EH, Flask CA, Clark HA. Nanosensors for the Chemical Imaging of Acetylcholine Using Magnetic Resonance Imaging. ACS Nano. 2018 Jun 6. doi: 10.1021/acsnano.8b01640. [Epub ahead of print] PubMed PMID: 29851460
Figures